Constraints On Galaxy Evolution Through Gravitational Lensing Statistics
Abstract
Explaining the formation and evolution of galaxies is one of the most challenging problems in observational cosmology. Many observations suggest that galaxies we see today could have evolved from the merging of smaller subsystems. Evolution of galaxies tells us how the mass or number density of the lens varies with cosmic time. Merging between the galaxies and the infall of surrounding mass into galaxies are two possible processes that can change the comoving number density of galaxies and/or their mass. We consider five different evolutionary models of galaxies .These models are: Non evolutionary model, Guiderdoni and Volmerange model, fast merging, slow merging and mass accretion model. We study the gravitational lens image separation distribution function for these models of evolving galaxies. A comparison with data for lensed quasars taken from the HST Snapshot Survey rules out the fast merging model completely as this model produces a large number of small-separation lenses. It is possible that the mass accretion model and the non evolutionary model of galaxies may be able to explain the small angle separations.
1 Introduction
After the discovery of the first multiply imaged quasars, gravitational arcs and arc-lets, gravitational lensing has rapidly become one of the most promising tools for cosmology. It is not a new idea that the statistics of gravitational lensing can be used as a tool for the determination of cosmological parameters.[1, 2]. In their pioneering work, Turner, Ostriker & Gott (1984, hereafter TOG)[3] developed a formalism to calculate the lensing probability and image separation distributions. TOG modelled the lens population as point masses, singular isothermal sphere (SIS) galaxies and cluster of galaxies. Since gravitational lens frequencies are sensitive to the cosmological constant , many authors [4, 5, 6, 7, 8, 9] used the lens statistics, developed by TOG, to constrain the cosmological parameters. Hinshaw & Krauss [10] (1987) and Krauss & White [11](1992) studied these effects with finite core radii of galaxies. In all these papers one simplifying assumption is made that the comoving number density of galaxies (lenses) is constant. However, it is an oversimplification to assume that galaxies are formed at a single epoch.
Mao[12] (1991) first examined the effect of galaxy evolution on the statistical properties of gravitational lenses using a simple redshift cut-off model. This model reduces the lensing probability and also explains the large mean separation of images in the observed gravitational lenses. Sasaki & Takahara [13](1993) used a more realistic model than that of Mao and studied the effect of a more gradual evolution in the number of galaxies on lens statistics. Mao & Kochanek[14] (1994) put a limit on galaxy evolution by studying its effects on gravitational lens statistics and image separations. They concluded that most of the galaxies must have collapsed and formed by if the universe is described by the Einstein-de Sitter model. If elliptical galaxies are assembled from merging of spirals then most of ellipticals must be formed by a redshift of 0.4.
Rix et al. [15](1994) considered an evolutionary model which is physically more plausible. They have studied the gravitational lens statistics with an evolving lens population through the fast merging process only. They showed that some specific merger models can be rejected and - dominated cosmologies are ruled out as they predict a large number of sub-arc second lenses and with merging, this problem becomes more acute. They find that the lensing probability of getting multiple images is insensitive to merging and the merging scenario skews towards smaller separation. Park & Gott [16](1997) tried to explain the correlation between gravitational lens image separation and the source redshift in the presence of the galaxy evolution. Jain et al.[17] (1998a) also studied the effect of galaxy evolution on the statistical properties of lenses both with decaying and constant .
The aim of this paper is to use the image separation distribution function of lensed quasars, (), as a tool to put constraints on the various evolutionary models of galaxies. Hamana et al. [18](1997) studied the distribution of image separation angle of lensed quasars. However they found a complete mismatch between the theoretical estimates and the observed lensed events. We find that if we use () as a tool to study galaxy evolution, it not only reduces the gap between observations and theoretical predictions but also tells us which evolutionary model of galaxies might explain the observations. The paper is organized as follows. In we explain the different evolutionary models of galaxies. In we present the statistical formulas we use for comparing the model calculations with the observations. We briefly summarize our results in .
2 Evolution Of Galaxies
The theory of the formation and evolution of galaxies is one of the unsolved problems of astrophysics. Some authors believe that galaxies evolve through a complex series of interactions before settling in the present day form [19, 20]. Others believe that galaxies were created in a well defined event at very early time[21, 22]. It remains unclear which process dominates the formation of elliptical galaxies. Among the many theories of galaxy formation, the idea that galaxies may form by the accumulation of smaller star forming subsystems has recently received much attention. Many observations also support this ’bottom-up’ scheme.
First, deep Hubble Space Telescope (HST) images [23] indicate that early type galaxies were assembled largely at and have been evolving passively since . Moreover, HST and ground based telescopes show that the galaxy-merger rate was higher in the past and it roughly increases with redshift [24, 25]. This suggests that the galaxies we see today could have been assembled from the merging of smaller systems sometime before .
Recent observations[26] also show that elliptical galaxies are rarer at high redshifts than those predicted by models in which elliptical galaxies completed their star formation by . Therefore elliptical galaxies must have had significant star formation at through merging and associated starbursts. The formation of elliptical galaxies in this way is also consisitent with the predictions of hierarchical clustering models of galaxy formation.
The second piece of evidence comes from the excess of faint blue galaxies which has been found in many deep imaging studies [27, 28, 29]. Comparison with the model which assumes that no luminosity evolution takes place in the galaxy population, shows that in the B band the actual observed galaxy count exceeds the model predictions by a factor of 5. Merging of galaxies can solve the surprisingly steep increase in the number density of galaxies [30, 31, 32, 33]. But at present it is not clear whether such models adequately describe the merging of galaxies in any realistic models of structure formation in the universe.
We consider five different evolutionary models of galaxies which try to explain some of the observational facts listed above . These models are: Non evolutionary model, Volmerange and Guiderdoni model, fast merging, slow merging and mass accretion model. We study the gravitational lens image separation distribution function in the presence of evolving models of galaxies.
Non- Evolutionary Model
This is the conventional lens model in which the luminosity function of lens galaxies is assumed to be of the Schechter form [34]
| (1) |
where the , and are the normalization factor, the index of faint - end slope, and the characteristic luminosity respectively. These values are fixed in order to fit the current luminosities and densities of galaxies. This model assumes that the comoving number density of galaxies is constant and the mass of galaxies does not change with cosmic time.
| (2) |
where t is the look-back time. The velocity dispersion of Singular Isothermal Sphere (SIS) lenses at t is
| (3) |
The subscript refers to present-day values.
Volmerange and Guiderdoni Model
In 1990, Volmerange and Guiderdoni [30], proposed a unifying model to explain faint galaxy counts as well as observational properties of distant radio galaxies. This model of galaxy evolution is based on number evolution in addition to pure luminosity evolution. According to this model the present day galaxies result from the merging of a large number of building blocks and the comoving number of these building blocks evolves as .
It is argued that the present luminosity function is the well known Schecter Luminosity Function [34] given in eq.(1) above. Then at high z, the comoving number density follows New Luminosity Function
| (4) |
It is seen that the value gives a fair fit to the data on high redshift galaxies. The functional form has the following properties:
-
(i)
Self-similarity as suggested by the Press-Schecter (1974)[35] formalism subject to the constraint that the total mass of associated material is conserved.
-
(ii)
The comoving number density evolves as = and the characterstic luminosity of the self similar galaxy luminosity function varies as
Fast Merging Model
The first merger model is that of Broadhurst, Ellis & Glazebrook (1992) [32], which was originally motivated by the faint galaxy population counts. This model assumes the number density of the lenses to be a function of the look back time as:
| (5) |
The velocity dispersion of SIS lenses at t is
| (6) |
This form implies that if we had galaxies at time each with velocity dispersion , they would by today have merged into one galaxy with a velocity dispersion . The strength and the time dependence of merging is described by the function :
| (7) |
where is the Hubble constant at the present epoch and Q represents the merging rate. We take Q = 4 [32]. The look back time is related to the redshift through
| (8) |
where ,
, is the density of matter, and is density of vacuum energy.
Slow Merging Model
In this less extreme merger model the total mass of galaxies within a given comoving volume is conserved. The comoving number density goes like while the mass of an individual galaxy increases like , where is the cosmic time since the big bang[36, 16]. We further assume the mass-velocity relation . The values of and are given in Table 2 for elliptical galaxies. Then
| (9) |
| (10) |
where is present age of the universe.
Mass Accretion Model
Mass accretion is the key factor for evolution of galaxies. A galaxy can accrete mass through two processes: either it accretes gas regularly through internal dynamics or the accretion occurs in more violent events, galaxy interactions and mergers. This is in line with the idea of hierachical formation. In this model the comoving density of the galaxies is constant but the mass increases as as in the cosmological infall model [16]. The total mass in galaxies thus increases with time. The comoving number density and the dispersion velocity vary as
| (11) |
| (12) |
3 Basic Equations For Gravitational Lensing Statistics
The differential probability of a beam encountering a lens in traversing the path of is given by
| (13) |
.
where is the comoving number density [TOG 1984].
The Singular Isothermal Sphere (SIS) provides us with a reasonable approximation to account for the lensing properties of a real galaxy. The lens model is characterized by the one dimensional velocity dispersion . The deflection angle for all impact parameters is given by . The lens produces two images if the angular position of the source is less than the critical angle , which is the deflection of a beam passing at any radius through an SIS:
| (14) |
we use the notation , where is the angular diameter distance between the redshift and [6]. Then the critical impact parameter is defined by and the cross- section is given by
| (15) |
The Evolutionary Model
| (16) | |||||
.
where . The functional form of in various models is described in Table 1.
Table 1
The Functional Form of
superscript ’a’: In this case the exponent of in eq. (16) becomes as the total mass in galaxies increases with time.
Using the relations , and luminosity - velocity relation , we get . is image angular separation. The differential optical depth of lensing in traversing with angular separation between and is given by
| (17) | |||||
In eq.(17) the exponent of becomes for the mass accretion model while in other evolutionary models the exponent of remains . After integrating eq.(17) over the lens redshift , we obtain the angular separation distribution
| (18) |
where the summation is over sources in the HST quasar sample and is the averaged bias which is equal to 9.76 in the HST quasar sample[18].
The Non Evolutionary Model
In the non- merging model the optical depth is given by [6]
| (19) | |||||
It is clear from eq. (16) that if then optical depth at each redshift in evolutionary model of galaxies (except mass accretion model) becomes equal to the optical depth in the non evolving model of galaxies. The differential optical depth of lensing in traversing for angular separation between and for the non evolutionary model is given by
| (20) | |||||
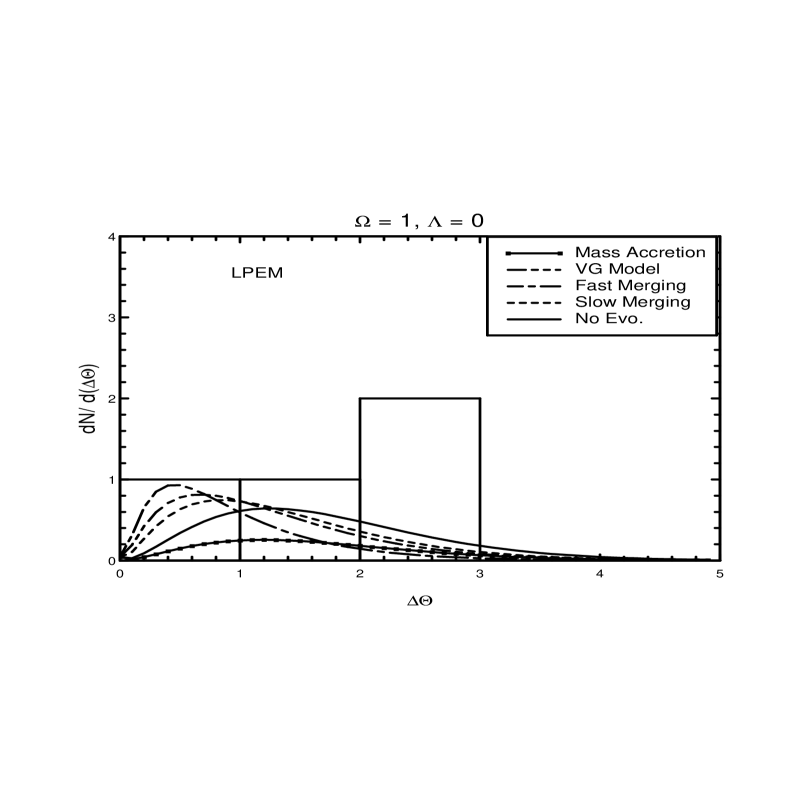
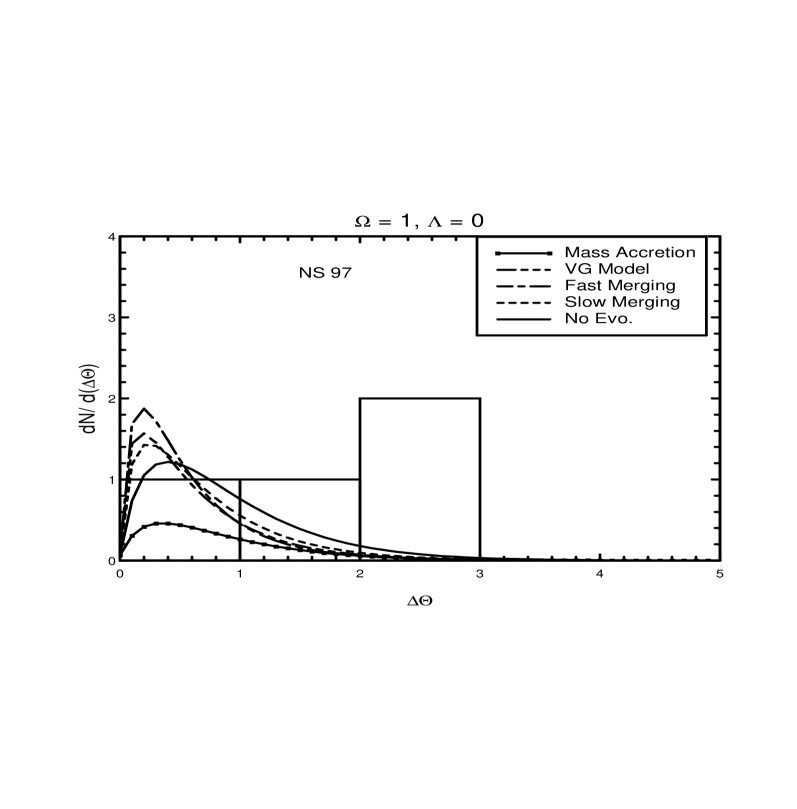
The which is given by eq.(18), strongly depends upon the four parameters , , and dispersion velocity . We consider three sets of these parameters given in Table 2.
4 Result and Discussion
An obvious noticeable fact from eq. (16) is that when the index (the Faber-Jackson index) is different from the value of four that we get any dependance on the evolution of galaxies. The combination vanishes when has the value 4 and totally suppresses the effect of evolution.
Figs. 1 to 3 give the calculated and observed number of lensed objects as a function of the image separation for the currently accepted values of cosmological parameters [41, 42] and . In all these figures the histograms indicate the image separation distribution of the four lensed quasars observed in the HST snapshot survey. It is clear from these figures that there is a very significant dependance of the results on the Schecter and lens parameters. The uncertainties associated with these parameters [43] will be diminished greatly by the data that emerges from the surveys planned for the next few years. The K96 set of parameters shift the peak of the image separation distribution function ( ) for all the evolving models towards smaller angles of separations. The larger angle separations are not explained by these parameters. With LPEM parameters, the mass accretion model and, to a lesser extent, the non-evolution model seem to have reasonable success in explaining the observations. Figs 4 to 6 present the results for the case of zero cosmological constant. Here the best fit seems to be the K96 parameters.
It is clear that to reach at a firm conclusion about galaxy evolution more reliable and valid set of Schechter parameters are badly needed. This should be forthcoming in the next few years with the large number of surveys that are in progress and that are being planned for the future.
Satisfactory and unambiguous identification of lensed objects should also improve in the coming years. The X-ray observations by CXO (Chandra X-ray Observatory) should be specially helpful.[44]. An increase in the overall number of lensed objects at all wave lengths is also expected in the next few years. It is hoped that knowledge of cosmological parameters and galaxy distribution (Schechter) parameters will mutually refine each other as more results become available. It will then be possible to say with some certainty which of the various galaxy evolution models are favoured by observations and which are ruled out.
Acknowledgements
We thank E. Turner, D. Maoz, Takashi Hamana and Yu- Chung N. Cheng for useful discussions.
References
- [1] S. Refsdal, Mon.Not.R. Astron. Soc., 128, 295 (1964)
- [2] W. H. Press & J. E. Gunn Astrophys. J., 185, 397 (1973)
- [3] E. L. Turner, J. P. Ostriker & J. R. Gott, Astrophys. J., 284, 1 (1984)[TOG]
- [4] E. L. Turner, Ap.J, 365, L43 (1990)
- [5] M. Fukugita & E. L. Turner, Mon.Not.R. Astron. Soc., 253, 99 (1991)
- [6] M. Fukugita et al., Astrophys. J., 393, 3 (1992)
- [7] D. Maoz & H. Walter Rix, Astrophys. J., 416, 425, (1993)
- [8] C. S. Kochanek, Astrophys. J., 466, 638 (1996) (K96)
- [9] M. Chiba & Y. Yoshii, astro - ph/9808321 (1998)
- [10] G. Hinshaw & L. M. Krauss, Astrophys. J., 320, 468, 1987
- [11] L. M. Krauss & M. White, Astrophys. J., 397, 357, 1992
- [12] S. Mao, Astrophys. J., 380, 9 (1991)
- [13] S. Sasaki & F. Takahara, Mon.Not.R. Astron. Soc., 262, 681, (1993)
- [14] S. Mao & C. S. Kochanek, Mon.Not.R. Astron. Soc., 268, 569 (1994)
- [15] H. W. Rix et al., Astrophys. J., 435, 49 (1994)
- [16] M.- Gu Park & J. Richard Gott III, Astrophys. J., 489, 476, 1997.
- [17] D. Jain, N. Panchapakesan, S. Mahajan & V. B. Bhatia, astro - ph/ 9807192 (1998a)
- [18] T. Hamana et al., Mon.Not.R. Astron. Soc., 287, 341, (1997)
- [19] A. Toomre, in The Evolution of Galaxies and Stellar Populations (eds B. M. Tinsley & R. B. Larson), p - 401 (Yale Univ. Observatory, New Haven, 1977)
- [20] F. Schwezier, Astron. J., 111, 109, (1996)
- [21] O. J. Eggen, D. Lynden-Bell, & A. R. Sandage Astrophys. J., 136, 748 (1962)
- [22] R. B. Partridge & P. J. E. Peebles Astrophys. J., 147, 868 (1967)
- [23] S. P. Driver et al., Astrophys. J., 449, L23 (1995)
- [24] J. M. Burkey et al., Astrophys. J., 429, L13 (1994)
- [25] R. G. Carlberg et al., Astrophys. J., 435, 540 (1994)
- [26] S. E. Zepf Nature, 390, 377 (1997)
- [27] K. Glazebrook et al., Mon.Not.R. Astron. Soc., 273, 157 (1995)
- [28] S. J. Lilly et al., Astrophys. J., 455, 108 (1995)
- [29] R. S. Ellis et al., Mon.Not.R. Astron. Soc., 280, 235 (1996)
- [30] B. Rocca-Volmerange & B. Guiderdoni, Mon.Not.R. Astron. Soc., 247, 166 (1990)
- [31] B. Guiderdoni & B. Rocca-Volmerange, Astron. Astrophy., 252, 435 (1991)
- [32] T. Broadhurst, R. Ellis & K. Glazebrook, Nat, 355, 55 (1992)
- [33] R. G. Carlberg Astrophys. J., 399,L31 (1992)
- [34] P. Schechter Astrophys. J., 203 297 (1976)
- [35] W. H. Press & P. Schechter Ap.J, 187 , 487 (1974)
- [36] J. E. Gunn & J. R. Gott, Astrophys. J., 176, 1 (1972)
- [37] D. Jain, N. Panchapakesan, S. Mahajan & V. B. Bhatia, Int. J. Mod. Phys, A13, 4227 (1998)
- [38] D. Jain, N. Panchapakesan, S. Mahajan & V. B. Bhatia, Int. J. Mod. Phys, D8, 507 (1999)
- [39] J. Loveday, B. A. Peterson, G. Efstathiou & S. J. Maddox, Astrophys. J., 390, 338 (1992) (LPEM)
- [40] T. T. Nakamura & Y. Suto, Prog. Of Theor. Phys., 97, 49 (1997) (NS97)
- [41] S. Perlmutter et al., astro-ph/9812133 (1998)
- [42] A. G. Riess et al., Astron. J., 114, 722 (1998)
- [43] Y. N. Cheng & L. M. Krauss, astro-ph/9810393 (1998)
- [44] J. A. Munoz, C. S. Kochanek & E. E. Falco astro-ph/9905293 (1999)
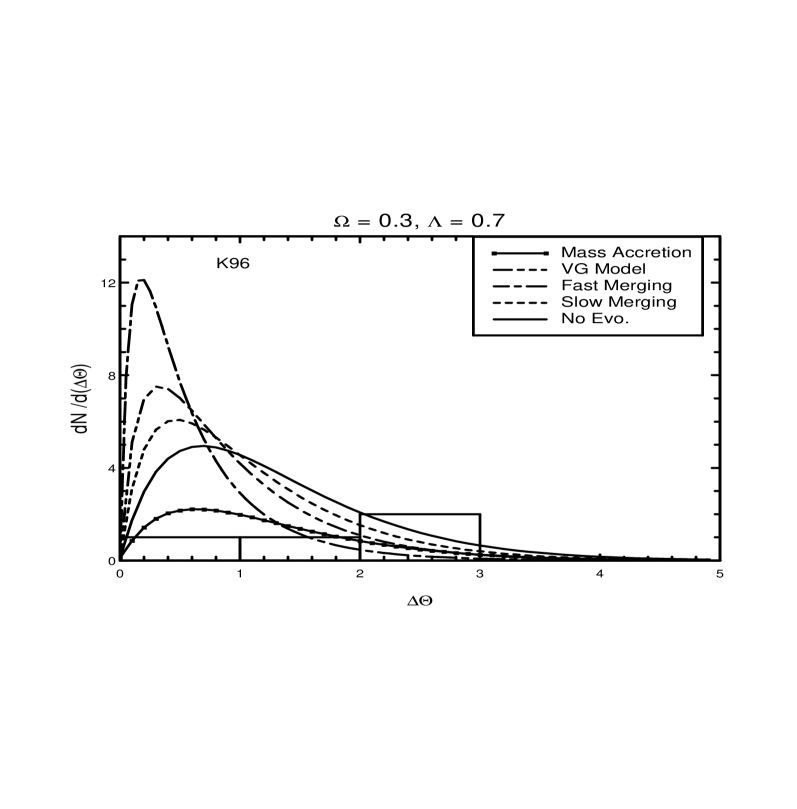
The expected distribution of lens image separations with K96 parameters with
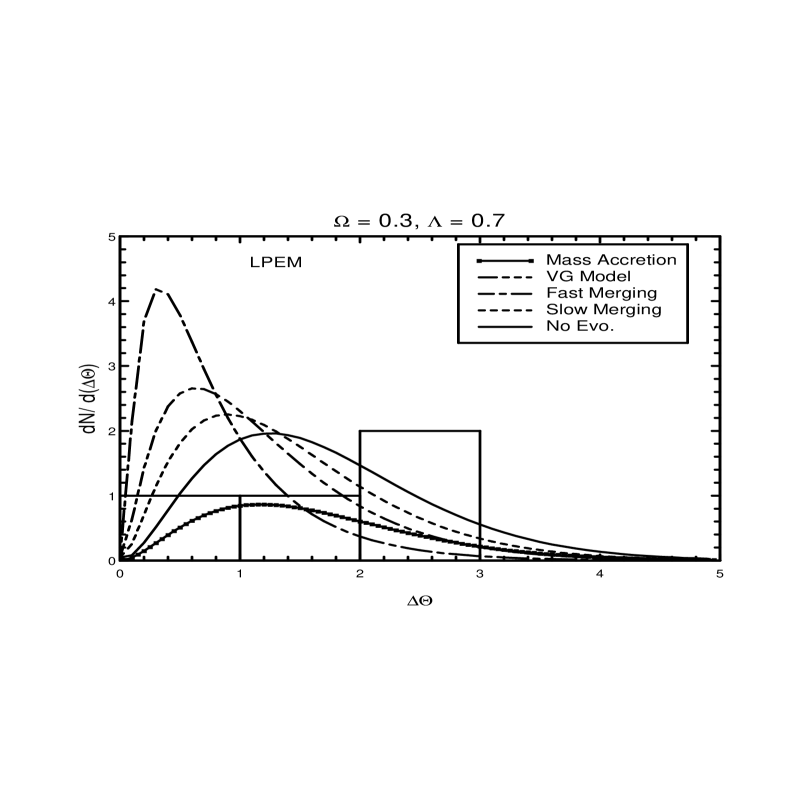
The expected distribution of lens image separations with LPEM parameters with
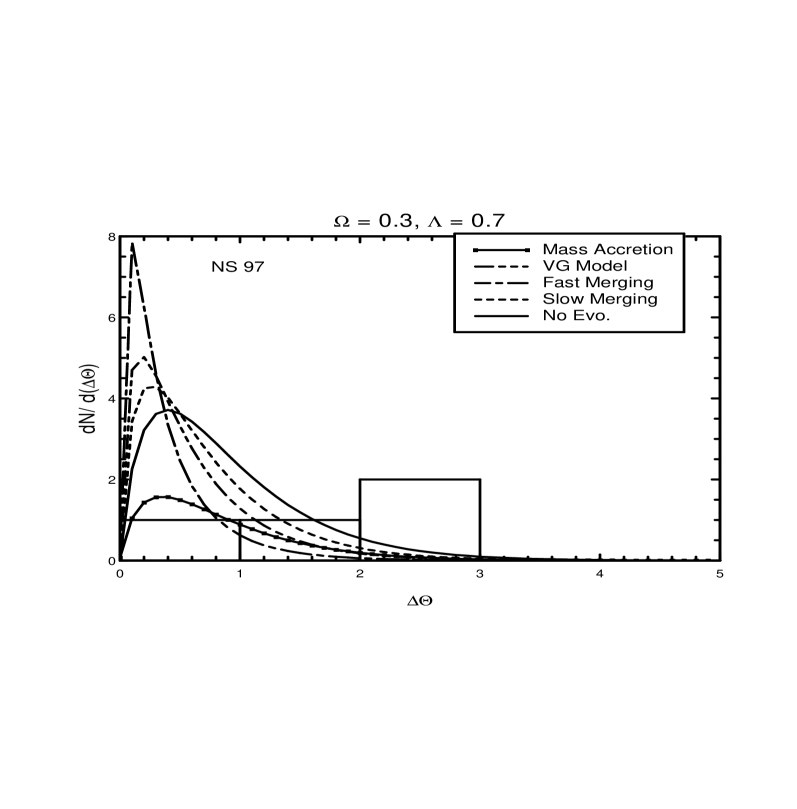
The expected distribution of lens image separations with NS97 parameters with
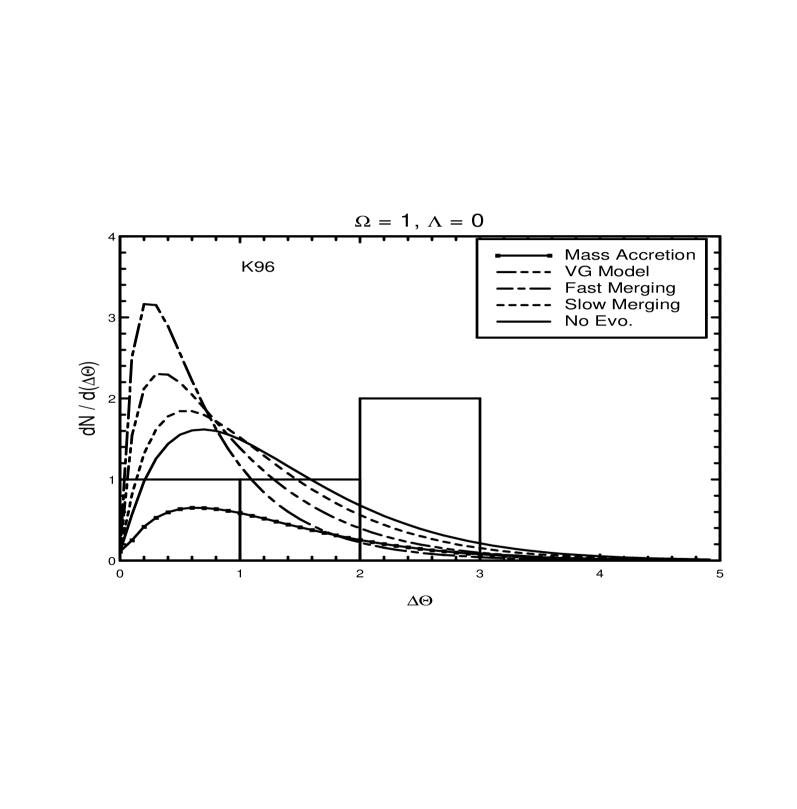
The expected distribution of lens image separations with K96 parameters with
The expected distribution of lens image separations with LPEM parameters with
The expected distribution of lens image separations with NS97 parameters with