Interaction rate at
Abstract
We found 25 galaxies with probable tidal tails in the Hubble Deep Fields North and South at =0.5–1.5. General characteristics of the selected tidal features are very close to characteristics of tidal tails of local interacting galaxies. Using objects with =0.5–1.0, we found that volume density of galaxies with tidal tails changes with as (1 + )4±1. Therefore, we estimated the rate of close encounters between the galaxies of comparable mass leading to the formation of extended tidal structures. If this rate reflects the merger rate, our data support a steeply increasing merger rate at 1 and consistent with zero curvature universe.
Key Words.:
galaxies: interaction, photometry, peculiar, structure1 Introduction
The redshift dependence of the interaction and merger rate is an important test of the current models for the formation and evolution of galaxies. It is now well established that galaxy interactions play a major role in galaxy formation and evolution (e.g. Schweizer 1998, Combes 1999 for recent reviews). Toomre (1977) demonstrated that the universe’s higher density in the past ( (1+)3 ) suggests a higher past merger rate, increasing back in time as (with time ) if the binding energies of binary galaxies had a flat distribution. If the galaxy merger rate is parametrized in the power-law form , then the exponent has been found to be from Toomre’s (1977) approach (assuming ). Statistics of close galaxy pairs from faint-galaxy redshift surveys (e.g. Yee & Ellingson 1995, Le Fevre et al. 1999) and morphological studies of distant galaxies support a large value of the exponent for . For instance, Abraham (1998) concluded that current best estimates for the merger rate are consistent with . Preliminary studies of distant peculiar objects representing distinct results of interactions/mergers (collisional ring galaxies, polar-ring galaxies, mergers) also support (Lavery et al. 1996, Reshetnikov 1997, Remijan et al. 1998, Le Fevre et al. 1999), although statistics are still insufficient. Many other surveys, including IRAS faint sources, or quasars, have also revealed a high power-law (e.g. Warren et al. 1994, Springel & White 1998). However, some recent works have suggested a moderate () (e.g. Neuschaefer et al. 1997, Wu & Keel 1998) or intermediate () (Burkey et al. 1994, Im et al. 1999) density evolution of merging systems with .
From analytical formulation of merging histories (e.g. Carlberg 1990, 1991; Lacey & Cole 1993), it is possible to relate the dark haloes merger rate to the parameters of the universe (average density , cosmological constant ). The merging rates for visible galaxies should follow, although the link is presently not well known (Carlberg 1990, Toth & Ostriker 1992). Theoretical models based on Press-Schechter formalism (Carlberg 1990, 1991) predict a redshift evolution of the merger rate with (the exponents must be somewhat changed if the average halo mass decreases with – Carlberg et al. 1994). This conclusion is confirmed by numerical simulations within the CDM scenario – () and () for (Governato et al. 1997).
Tidal tails originate in close encounters of disk galaxies (e.g. Toomre & Toomre 1972). The purpose of this note is to show that statistics of galaxies with extended tidal tails (tidal bridges have, on average, fainter surface brightnesses – Schombert et al. 1990) is a useful tool to study evolution of interaction rate to . The simulations by Hibbard & Vacca (1997) – they showed that extended tidal features remain readily visible in the long exposures typical of the Hubble Deep Fields out to – is the theoretical base for our work. We found that current statistics of such objects in the North and South Hubble Deep Fields (HDF-N and HDF-S correspondingly) leads to . (Preliminary results based on the HDF-N only are presented in Reshetnikov 1999 – Paper I.)
2 Sample of galaxies
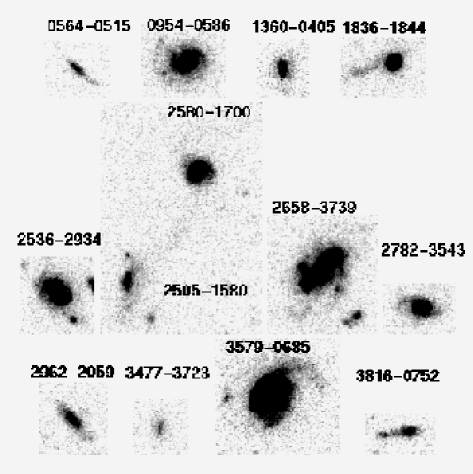
We used the deepest currently available deep fields (HDF-N – Williams et al. 1996 and HDF-S – Williams et al. 1999) to search galaxies with extended tidal tails. From detailed examination of the fields in the F814W filter (hereinafter referred to as ), we selected more than 70 tailed objects. Careful analysis of their images in combination with the redshift data enabled us to distinguish 25 galaxies with (12 objects in the HDF-N and 13 in the HDF-S). Galaxies with tidal tails in the HDF-N are described in detail in Paper I. Here we present the data for the HDF-S objects (Fig.1). (Our statistics of galaxies with tidal structures are in general agreement with van den Bergh et al. (1996) data on morphology of galaxies in the HDF-N. van den Bergh et al. classified 20 galaxies with as objects with probable tidal distortions in the HDF-N.)
General characteristics of the galaxies are summarized in Table 1.
The columns of the table are: galaxy identification, band apparent
magnitude, photometric redshift (there are no published spectroscopic
redshifts for the sample galaxies). All the data are taken from
the web site of the HDF-S group at SUNY, Stony Brook (Chen et al. 1998).
In the fourth column we present the absolute magnitude in the rest-frame
band calculated according to Lilly et al. (1995) as:
=–5 log(/10 pc)+2.5 log(1+)+()+0.17,
where
| (1) |
– luminosity distance (), – the Hubble constant (75 km/s/Mpc), – deceleration parameter (=0.05), – -correction color (we used correction for Sbc galaxy), and term 0.17 translates AB magnitudes into standard .
| Name | (tail) | (tail) | |||
|---|---|---|---|---|---|
| SB-WF-0564-0515 | 25.27 | 1.01 | -17.4 | 25.4 | 23.1 |
| SB-WF-0954-0586 | 22.63 | 1.29 | -21.1 | 24.9 | 21.6 |
| SB-WF-1360-0405 | 24.26 | 1.02 | -18.4 | 25.1 | 22.8 |
| SB-WF-1836-1844 | 22.85 | 0.91 | -19.4 | 24.9 | 23.0 |
| SB-WF-2505-1580 | 24.04 | 1.37 | -20.1 | 25.4 | 21.6 |
| SB-WF-2536-2934 | 22.68 | 1.00 | -20.0 | 24.9 | 22.6 |
| SB-WF-2580-1700 | 22.62 | 1.27 | -21.0 | 26.2 | 22.9 |
| SB-WF-2658-3739 | 21.78 | 0.47 | -18.7 | 25.7 | 25.1 |
| SB-WF-2782-3543 | 23.42 | 1.08 | -19.5 | 24.7 | 22.2 |
| SB-WF-2962-2059 | 24.20 | 0.51 | -16.5 | 25.1 | 24.4 |
| SB-WF-3477-3723 | 25.79 | 0.95 | -16.7 | 25.8 | 23.7 |
| SB-WF-3579-0685 | 21.33 | 0.58 | -19.7 | 24.9 | 24.0 |
| SB-WF-3816-0752 | 24.54 | 0.69 | -16.9 | 24.4 | 23.1 |
In Table 2 we compare mean characteristics of the tailed galaxies in two deep fields. As one can see, both samples are consistent within quoted errors.
| Parameter | HDF North | HDF South |
|---|---|---|
| Number of galaxies (all) | 12 | 13 |
| 0.5–1.0 | 7 | 7 |
| 1.0–1.5 | 5 | 6 |
| 0.940.30 | 0.930.28 | |
| –18.01.3 | –18.91.5 | |
| (tail) | 23.71.0 | 23.11.0 |
| dtail/dgalaxy | 1.40.7 | 1.20.5 |
3 Characteristics of tidal tails
To be sure that our selected galaxies possess true tidal tails, we performed photometric measurements in the passband using circular apertures centered on the brightest regions of the suspected tails. For the measurements, we retrieved the HDF-S images (version 1) from the ST ScI web site and processed them in the ESO-MIDAS environment. The results of these measurements are summarized in Table 1 (column 5). The observed surface brightness of the tails has been converted to a rest-frame by applying the cosmological dimming term and a -correction color term: – 2.5 log(1+)3 + () + 0.17 (Lilly et al. 1998). General photometric characteristics of the local tidal tails are close to those for late-type spiral galaxies (Sb-Sc) (Schombert et al. 1990, Reshetnikov 1998) and we used color term for Sbc galaxy (Lilly et al. 1995) in our calculations. The results are presented in the last column of Table 1 and in Fig.2.
The mean rest-frame surface brightness of the tidal structures in the joint (HDF-N plus HDF-S) sample is (tail) = 23.41.1, in full agreement with our results for the local sample of interacting galaxies (obtained by analogous manner) – (tail) = 23.80.8 (Reshetnikov 1998).
Fig.2 (top) presents the observed distribution of the values of the suspected HDF tails (dashed line) in comparison with the distribution for local objects in the passband. The bottom part of the figure shows converted to a rest-frame, distribution for HDF tails. It is evident that tails of distant galaxies demonstrate a distribution of values close to that for local interacting galaxies. Fig.2 illustrates clearly the influence of observational selection on the recognition of tidal structures – we are able to detect relatively faint tails among the galaxies with but among objects we can see only very bright tails. Therefore, our sample of galaxies with extended tidal tails is sufficiently incomplete for . Thus, objects with will give a more reasonable estimation of in comparison with the total sample.

4 Density evolution
The resemblance of morphological and photometric characteristics of suspected tidal tails of the HDFs galaxies with local objects allows us to use them to measure possible change with of volume density of galaxies with tails (and, therefore, the rate of close encounters leading to the formation of extended tails).
The co-moving volume element in solid angle and redshift interval is
| (2) |
where – photometric distance (eq.(1)), and (1 + ) for (e.g. Peebles 1993). The increase of the space density of galaxies with tidal tails we take in standard power-law form:
| (3) |
where – local volume density of such galaxies. By integrating equations (2) and (3) we can find the expected number of objects within solid angle and in required range of .
4.1 Local density of galaxies with tidal tails
We suppose that at the current epoch interactions and mergers accompanied by tail formation are almost entirely between bound pairs of galaxies (e.g. Toomre 1977). So we adopt that frequency of tidal tails among single objects (mergers) and in groups, is significantly lower than in pairs.
According to Karachentsev (1987), the relative frequency of galaxies with tails among the members of binary systems is 94/974=0.100.01. The fraction of paired galaxies in the local universe is not well determined. Various strategies give results between 5% and 15%. For instance, local pairing fraction is 7%1% according to Burkey et al. (1994), 6%-10% (Keel & van Soest 1992), 14%2% (Lawrence et al. 1989). The most intensive studies lead to 12%2% (Karachentsev 1987) and 10% (Xu & Sulentic 1991, Soares et al. 1995). Moreover, Xu & Sulentic (1991) found that the fraction of pairs is approximately constant (10%) over the luminosity range (see also Soares et al. 1995). Thus, we can adopt the value of 10%5% as a reasonable estimate of the local fraction of binary galaxies. Therefore, the relative fraction of galaxies with tidal tails at is 0.10.1=0.010.005.
To find total density of galaxies in the nearby part of the universe (), we considered the galaxy luminosity function (LF) according to Marzke et al. (1998). The adopted Schechter function parameters of the LF are: =–20.05, =5.410-3 Mpc-3 and =–1.12 (75 km/s/Mpc). By integrating LF from to –21.1 (the range of absolute luminosities of galaxies with tails in the HDF-N and HDF-S), we found that total volume density of galaxies is equal to 0.026 Mpc-3. Thus, 0.010.026=(2.61.3)10-4 Mpc-3.
The total angular area within which we searched tailed galaxies in two HDFs is 10.4 arcmin2 or 8.810-7 sr.
4.2 Exponent from tidal structures
Varying exponent , we can estimate the expected number of galaxies with tidal features in the HDFs. In Fig.3 we present the results of calculations for two redshift intervals: 0.5–1.5 (total sample) and 0.5–1.0 (adopted cosmology is , or and =75 km/s/Mpc). As one can see, the total sample (25 objects) leads to . But this value must be considered as a low limit only due to strong underestimation of tidal tails at (sect.3). For the galaxies with (=14) we obtain . Assuming Poisson error of (=3.7), we have . Adding 50% uncertainty in the local space density , we have obtained a final estimation of as 4.0. (Let us note also that two potential sources of errors – underestimation of value and omission of tailed galaxies in the HDFs – bias value of in opposite directions and partially compensate each other.)

The value of depends on the adopted cosmological model. For , we have (=0.5–1.0). In our calculations for the model with a cosmological constant and zero spatial curvature (=0.3, =0.7, =1) we used the analytical approximation of the luminosity distance according to Pen (1999). In the framework of that model we have obtained .
To obtain more realistic error estimation, we must take into account the possible luminosity evolution of galaxies with redshift. Unfortunately, luminosity and surface brightness evolution of peculiar and interacting galaxies is poorly constrained at present (e.g. Roche et al. 1998). Moreover, Simard et al. (1999) claim that an apparent systematic increase in disk mean surface brightness to for bright () spiral galaxies is due to selection effects. Nevertheless, assuming that interacting galaxies undergo luminosity evolution between and 1, we estimated that the value of must be decreased by : for and for .
5 Discussion and conclusions
On the basis of analysis of the HDF-N and HDF-S images we selected 25 galaxies with probable tidal tails with =0.5–1.5. Integral photometric characteristics of the suspected tails are close to that for local interacting galaxies. Considering the subsample of tailed galaxies with =0.5-1.0 (14 objects), we estimated that co-moving volume density of such galaxies changes approximately as (1+)4. (Hence the volume density of tailed galaxies at is for .) Inclusion in the sample of the galaxies with tidal bridges does not noticeably change the value of the exponent (Paper I). Therefore, we estimated the change of the rate of close encounters leading to the formation of extended tails. If this rate reflects the merger rate, we have obtained evidence of a steeply increasing merger rate at . (Our result is related to field galaxies. The evolution in clusters might even be stronger than in the field. For instance, van Dokkum et al. 1999 found for the merger fraction in rich clusters of galaxies.)

How does our estimation of agree with values obtained by other methods? The recent surveys of the evolution of galaxy pairs with are consistent with (see references in Abraham 1998). Evolution of the rate of interactions according to our data is characterized by close (within quoted errors) value of . Direct analysis of the morphology of distant galaxies at suggests a significant increase of the fraction of irregular and peculiar systems with redshift (Fig.4). If interactions and mergers are responsible for the observed asymmetries of galaxies (e.g. Conselice & Bershady 1998), this increase can reflect the increase of the interaction rate with . As one can see in Fig.4, relative fraction of Irr/Pec galaxies changes in accordance with . Naim et al.’s (1997) result (35%15% of peculiar galaxies down to ) agrees with also. Many other observational surveys and numerical works indicate a large (3) exponent (Sect.1). Comparison with predictions of analytical and numerical works shows that current observational estimates of the merger rate favor a zero curvature () universe (e.g. Carlberg 1991, Governato et al. 1997).
Our results indicate that further detailed statistics of galaxies with tidal structures will be a powerful tool to quantify the interaction and merging rates evolution.
Acknowledgements.
I would like to thank an anonymous referee for useful comments. I acknowledge support from the Russian Foundation for Basic Research (98-02-18178) and from the “Integration” programme ( 578).References
- (1) Abraham R.G., 1998, in “Galaxy interactions at low and high redshifts”, Barnes J.E., Sanders D.B. eds. 1998. Kluwer, Dordrecht, 11
- (2) Brinchmann J., Abraham R., Schade D. et al., 1998, ApJ 499, 112
- (3) Burkey J.M., Keel W.C., Windhorst R.A., Franklin B.E., 1994, ApJ 429, L13
- (4) Carlberg R.G., 1990, ApJ 359, L1
- (5) Carlberg R.G., 1991, ApJ 375, 429
- (6) Carlberg R.G., Pritchet C.J., Infante L., 1994, ApJ 435, 540
- (7) Chen H.-W., Fernandez-Soto A., Lanzetta K.M. et al., 1998, astro-ph/9812339
- (8) Combes F., 1999, in “Building galaxies: from the primordial universe to the present”, Hammer F., Thuan T.X., Cayatte V., Guiderdoni B., Tran Thanh Van J. eds. Frontieres (astro-ph/9904133)
- (9) Conselice C.J., Bershady M.A., 1998, astro-ph/9812299
- (10) Hibbard J.E., Vacca W.D., 1997, AJ 114, 1741
- (11) Im M., Griffiths R.E., Naim A. et al., 1999, ApJ 510, 82
- (12) Governato F., Garnder J.P., Stadel J. et al., 1997, ApJ, astro-ph/9710140
- (13) Karachentsev I.D., 1987, Binary galaxies. Nauka, Moscow
- (14) Keel W.C., van Soest E.T.M., 1992, A&AS 94, 553
- (15) Lacey C., Cole S., 1993, MNRAS 262, 627
- (16) Lavery R.J., Seitzer P., Suntzeff B. et al., 1996, ApJ 467, L1
- (17) Lawrence A., Rowan-Robinson M., Leech K. et al., 1989, MNRAS 240, 329
- (18) Le Fevre O., Abraham R., Lilly S.J. et al., 1999, MNRAS, astro-ph/9909211
- (19) Lilly S.J., Tresse L., Hammer F. et al., 1995, ApJ 455, 108
- (20) Lilly S., Schade D., Ellis R. et al., 1998, ApJ 500, 75
- (21) Marzke R.O., da Costa L.N., Geller M.J., 1998, ApJ 503, 617
- (22) Naim A., Ratnatunga K.U., Griffiths R.E., 1997, ApJ 476, 510
- (23) Neuschaefer L.W., Im M., Ratnatunga K.U. et al., 1997, ApJ 480, 59
- (24) Peebles P.J.E., 1993, Principles of Physical Cosmology. Princeton University Press, Princeton
- (25) Pen U.-L., 1999, ApJS 120, 49
- (26) Remijan A.J., Lavery R.J., Reed M.D., 1998, BAAS 193, 305
- (27) Reshetnikov V.P., 1997, A&A 321, 749
- (28) Reshetnikov V.P., 1998, Pis’ma v AZh 24, 189 (Engl. transl. in Astron. Letters 24, 153)
- (29) Reshetnikov V.P., 1999, Pis’ma v AZh, in press (Paper I)
- (30) Roche N., Ratnatunga K., Griffiths R.E. et al., 1998, MNRAS 293, 157
- (31) Schombert J.M., Wallin J.F., Struck-Marcell C., 1990, AJ 99, 497
- (32) Schweizer F., 1998, in “Galaxies: interactions and induced star formation”: lecture notes 1996/Saas Fee Advanced Course 26, Friedli D., Martinet L., Pfenniger D. eds. Springer, 105
- (33) Simard L., Koo D.C., Faber S.M. et al., 1999, ApJ 519, 563
- (34) Soares D.S.L., de Souza R.E., de Carvalho R.R., Couto da Silva T.C., 1995, A&AS 110, 371
- (35) Springel V., White S.D.M., 1998, MNRAS 298, 143
- (36) Toomre A., 1977, in “The evolution of galaxies and stellar populations”, Tinsley B.M., Larson R.B. eds. Yale Univ. Obs., New Haven, 401
- (37) Toomre A., Toomre J., 1972, ApJ 178, 623
- (38) Toth G., Ostriker J.P., 1992, ApJ 389, 5
- (39) van den Bergh S., Abraham R.G., Ellis R.S. et al., 1996, AJ 112, 359
- (40) van Dokkum P.G., Franx M., Fabricant D. et al., 1999, ApJL, accepted (astro-ph/9905394)
- (41) Warren S.J., Hewett P.C., Osmer P.S., 1994, ApJ 421, 412
- (42) Williams R.E., Blacker B., Dickinson M. et al., 1996, AJ 112, 1335
- (43) Williams R.E. et al., 1999, AJ, to be submitted
- (44) Wu W., Keel W.C., 1998, AJ 116, 1513
- (45) Xu C., Sulentic J.W., 1991, ApJ 374, 407
- (46) Yee H.K.C., Ellingson E., 1995, ApJ 445, 37