High Resolution Infrared Imaging of the Compact Nuclear Source in NGC4258
Abstract
We present high resolution imaging of the nucleus of NGC4258 from 1 to 18 . Our observations reveal that the previously discovered compact source of emission is unresolved even at the near-infrared resolution of 0.2 FWHM which corresponds to about 7 pc at the distance of the galaxy. This is consistent with the source of emission being the region in the neighborhood of the purported 3.5107 M☉ black hole. After correcting for about 18 mags of visual extinction, the infrared data are consistent with a F spectrum from 1.1 to 18 , implying a non-thermal origin. Based on this spectrum, the total extinction corrected infrared luminosity (120 ) of the central source is 2108 L☉. We argue that the infrared spectrum and luminosity of the central source obviates the need for a substantial contribution from a standard, thin accretion disk at these wavelengths and calculate the accretion rate through an advection dominated accretion flow to be M☉/yr. The agreement between these observations and the theoretical spectral energy distribution for advection dominated flows provides evidence for the existence of an advection dominated flow in this low luminosity AGN.
1 Introduction
NGC4258 (M106) is a weakly active Seyfert 1 (Filippenko 1996) galaxy at a distance of 7 Mpc (we adopt H0=65 km s-1 Mpc-1; at this distance 1=33.9 pc). The nucleus of the galaxy is a prototypical low luminosity AGN. Dynamical evidence for the existence of a massive black hole in the nucleus comes from high spatial resolution VLBI observations of water masers, which reveal the existence of a thin edge-on disk of inner radius 4 milliarcseconds and outer radius 8 milliarcseconds (Miyoshi et al. 1995). The high velocity features of the masers were found to be symmetrically offset from the systemic velocity by 7001000 km s-1 as would be expected in a Keplerian disk. The inferred binding mass of 3.50.1107 M☉ within a radius of 0.14 pc (Herrnstein, Greenhill, & Moran 1996) makes it the strongest supermassive black hole candidate after the nucleus of the Galaxy (Genzel et al. 1997, Ghez et al. 1998). The adopted binding mass and distance for the galaxy are consistent with the more recent measurements of Herrnstein et al. (1999). Observations by the X-ray satellite ASCA indicate the existence of a strongly obscured source with a photon index of =1.80.3 at the nucleus of the galaxy (Makishima et al. 1994). The photon index =1+ where is the spectral index. The line of sight column density of NH=1.51023 cm-2 derived from a fit to the absorbed X-ray data, corresponds to AV80 mags which would obscure the nucleus at visible wavelengths. The extinction-corrected X-ray luminosity from 210 keV is 41040 ergs s-1 and is relatively insensitive to the absorption column density. Based on arguments that the X-ray luminosity is typically about 5% to 40% of the bolometric luminosity in AGN (Mushotzky, Done, & Pounds 1993), LBol for the central engine in NGC4258 is of order 1041 ergs s-1. This is 210-5 LE, where LE is the Eddington luminosity of the massive black hole at the nucleus and corresponds to 4.41045 ergs s-1.
The low bolometric luminosity of the central engine can be
explained by an incorrect
estimation of LBol since the overall spectral energy distribution of
the central engine is not well known. Alternatively, since
LBol= where is the radiative efficiency
and is the mass accretion rate of the central engine, a low bolometric
luminosity could be attributed to:
1. a sub-Eddington mass accretion rate through a
standard, geometrically thin disk.
For the black hole in NGC4258, the Eddington mass accretion
rate 0.75 M☉/yr where has
a fiducial value of 10%.
2. a low radiative efficiency for the accretion phenomenon whereby most of the viscously
generated energy is carried through the event horizon of the black hole. This is more commonly called
an advection dominated accretion flow (ADAF; Narayan & Yi 1995).
Strong line of sight extinction to the nucleus of NGC4258, makes estimating the intrinsic spectral energy distribution difficult. Wilkes et al. (1995; hereafter W95) detected a polarized continuum with F in scattered light at visible wavelengths. The luminosity of the central source is only weakly constrained by these observations to lie in the range 10 ergs s-1 and is dependent on the scattering model. Infrared observations are less susceptible to extinction effects and are therefore a better probe of the energy spectrum and the output luminosity. Chary & Becklin (1997, hereafter CB97) detected a compact infrared source in the nucleus of the galaxy. Based on the visible light polarimetric observations of W95, CB97 concluded that the intrinsic spectrum of the infrared source is a power law (F) and that the observed JH, HK colors could be explained by about 17 mags of visual extinction along the line of sight. While the absolute extinction corrected luminosity at these wavelengths is consistent with an ADAF model (Lasota et al. 1996), the derived spectrum poses some problems because at these wavelengths, both the ADAF model and the standard thin disk model predict a Comptonized blackbody spectrum arising from a cool geometrically thin, optically thick disk (Pringle 1981). In addition, infrared emission from thermal reprocessing of the central visible/UV continuum by dust in a flared disk or ‘torus’ could not be unambiguously ruled out. The only observation at mid-infrared wavelengths which can potentially trace the dust distribution or constrain the overall spectrum of the central source is the 813 5.7 diameter data from Rieke & Lebofsky (1978; hereafter RL78). This measurement could be contaminated by extended emission from regions of nuclear star formation.
Lasota et al. (1996) applied an ADAF model to fit the X-ray spectrum of NGC4258. The model consists of an inner, optically thin flow which is geometrically thick. The ADAF exists from an inner radius of 3 RS up to a radius of 10100 RS where RS is the Schwarzschild radius of the central black hole and corresponds to 3.410-6 pc. The ions which are heated by the viscously generated energy have a temperature of 1012 K but their radiative timescale is longer than the accretion timescale resulting in most of the energy being transported into the event horizon of the black hole by radial convection or ‘advection’. The electrons (Te109 K) produce synchrotron photons which could be the seeds for self-Comptonization to produce a hard X-ray spectrum. The model also includes a cooler geometrically thin, optically thick disk which extends up to 106 RS to reproduce the blackbody bump seen at visible/UV wavelengths in most AGN. This kind of accretion flow allows a ‘normal’ accretion rate of 0.2 but requires a low radiative efficiency since most of the viscously generated energy is transported into the event horizon of the black hole by the advection process. Here, is the dimensionless viscosity parameter defined by Shakura & Sunyaev (1973), while is the accretion rate in units of the Eddington rate. Mahadevan (1997; hereafter M97) has investigated the spectral energy distribution from an ADAF in detail and shown that the Comptonization of soft cyclosynchrotron photons results in a power law spectrum between 1012 and 1017 Hz. The spectral index of the power law is essentially constrained by the mass accretion rate through the ADAF.
In this paper, we present high resolution imaging of the nucleus of NGC4258 at mid-infrared and near-infrared wavelengths. The observations place a better handle on the spectrum and bolometric luminosity of the central engine. This allows us to constrain the mass accretion rate of the black hole based on the different accretion models which have been proposed.
2 Observations and Results
The 1.1 to 2.2 data were obtained using the Near Infrared Camera and Multi-Object Spectrometer (NICMOS) Camera 2 on the Hubble Space Telescope (Thompson et al. 1998). The camera has a 256256 HgCdTe array with pixel scales of 0.0762 and 0.0755 per pixel in and , respectively, providing a field of view. Frames were taken in three filters: F110W, F160W and F222M, which correspond to 1.1 m, 1.6 m, and 2.2 m respectively. Observations of the galaxy were made using a four-point spiral dither in each filter setting; the offset per dither position was 25.5 pixels (1.9). Non-destructive reads (MULTIACCUM) were obtained at each dither position, with integration times of 40 (F110W, F160W) and 56 (F222M) seconds per position. The total integration times were thus 160 (F110W, F160W) and 224 (F222M) seconds. In addition to the galaxy observations, blank-sky observations were done with the F222M filter to determine the background level at 2.2 m, and dark frames were taken using the same MULTIACCUM sequences as the galaxy observations.
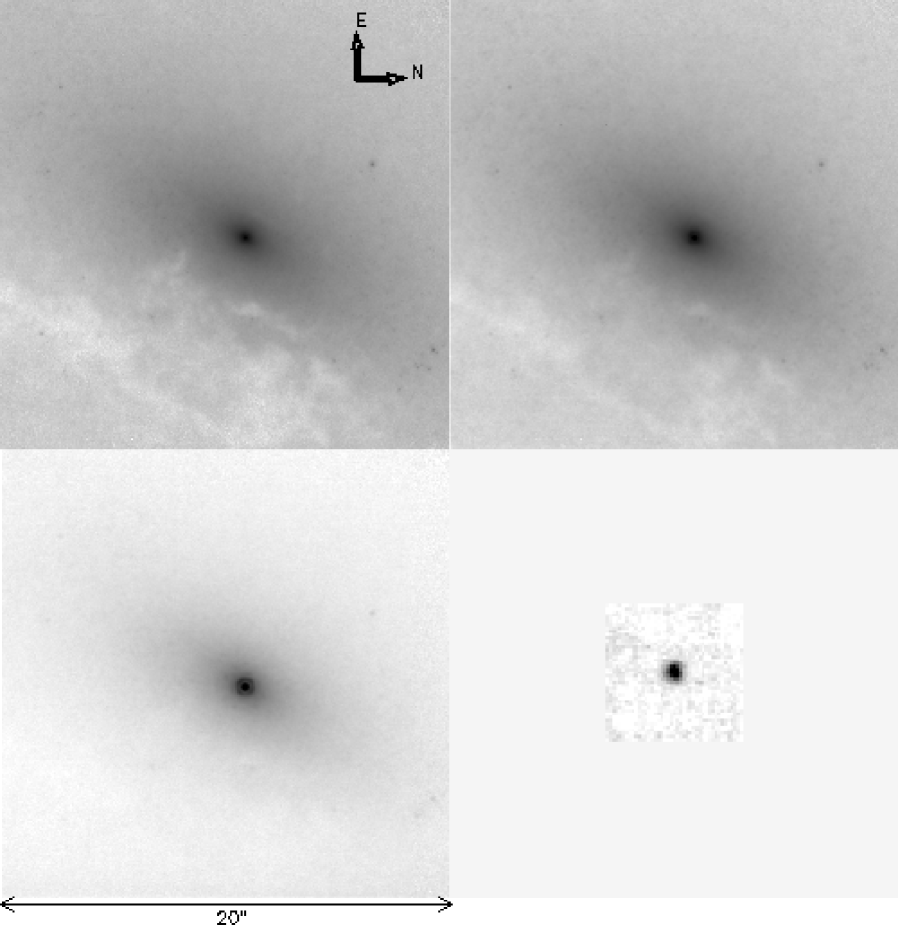
The data were reduced with IRAF. The dark was first created, then the NICMOS data were dark subtracted, flatfielded and corrected for cosmic rays using the IRAF pipeline reduction routine CALNICA (Bushouse 1997; See Scoville et al. 1999 for details about the reduction procedure). The calibrated images contained pixels with reduced quantum efficiency due to contaminants on the array surface, thus a mask was created to minimized their effect. The coronographic hole and column 128 were also masked on all images, the latter feature was masked due to its sensitivity to minute discrepancies in dark subtraction (i.e., the dark current rises sharply toward the center column of the array). The dithered images were then shifted and averaged using the DRIZZLE routine in IRAF (Fruchter & Hook 1997). Finally, a background level of 0.45 ADU/s was measured from the blank-sky data, and this amount was subtracted from the 2.2 m image of NGC 4258. The background level at 1.1 m and 1.6 m was ignored since it is typically less than 0.01 ADU/s. The plate scales of the final ‘drizzled’ images, shown in Figure 1, are 0.0381 and 0.0378 per pixel in and .
Flux calibration of the images were done using scaling factors of 2.195, 2.207, and 5.583 Jy (ADU/sec)-1 at 1.1, 1.6, and 2.2 m (Rieke et al. 1999). The corresponding magnitudes were calculated using the zero-points 1909, 1087 and 665 Jy at 0 mag for 1.1, 1.6 and 2.2 m respectively. The 1.1 , 1.6 and 2.2 images were aligned to within 0.2 pixel using centroids and elliptical isophotes generated. Synthetic NICMOS point spread functions (PSFs) were generated using the TINYTIM routine (Krist & Hook 1997) since no observed PSFs were available.
As shown by CB97, the nucleus of the galaxy is clearly redder than the surrounding starlight. The colors of the nuclear regions (0.12 radius from the center) are [1.6][2.2]=0.90.1 mag and [1.1][1.6]=1.10.1 mag. In comparison, the colors of the galaxy in an annulus of radius 0.5 to 1.0 are [1.6][2.2]=0.520.05 mag and [1.1][1.6]=0.910.05 mag. The reddening can be attributed to either a red central source or dust extinction of starlight. CB97 argued for the former and we provide additional evidence in this paper that this is true. To estimate the contribution of the putative source seen by CB97 at the nucleus of the galaxy, it was necessary to subtract a stellar background from the galaxy frames. The 1.1 surface brightness profile was fitted with an exponential and subtracted off such that the residual consisted of a central core with a FWHM corresponding to the FWHM of the 1.1 PSF (0.1). There is no evidence of an Airy ring in the residual and hence we conclude that we do not detect a compact component of emission at 1.1 . The residual has a flux density of 0.5 mJy and we consider it as an upper limit to a point source.
Since the 1.1 data do not show a compact source, it is reasonable to assume that it traces the distribution of starlight in the central regions of the galaxy. Furthermore, the contribution from the polarized component observed by W95, based on it’s flux density and spectrum, is found to be less than 0.1 mJy at 1.1 . A scaled 1.1 surface brightness image was subtracted from the 1.6 and 2.2 surface brightness images. The scale factor was derived by performing an intensity-weighted least squares fit within the central arcsecond of the form: =a1 + b1 P[2.2] where is the surface brightness, a1 and b1 are constants and P is the TINYTIM generated PSF. For the 2.2 image, we obtain a1=1.250.05 and for the 1.6 image, we get a1=1.290.05. This corresponds to [1.1][2.2] and [1.1][1.6] colors of 1.390.05 mag and 0.890.05 mag respectively.
The Airy ring is clearly visible in the starlight subtracted 1.6 and 2.2 images which were obtained as described above. The FWHM of the residual is also very similar to the FWHM of the synthetic PSFs at the respective wavelengths. We thereby conclude that the compact component of emission at 1.6 and 2.2 is unresolved at our resolution of 0.2. This implies that the size of the emitting region has a radius 3.5 pc at the distance of the galaxy and is consistent with the emission originating from the vicinity of the black hole at the nucleus. The profile of the central source is shown in Figure 2. The brightness of the central source was measured by standard circular aperture photometry. The observed flux density of the compact source is 4.00.7 mJy at 2.2 and 0.90.3 mJy at 1.6 . This agrees well with the values of 4.5 mJy and 1.1 mJy obtained by CB97 at K and H respectively.
Rieke (1999) has suggested that using the standard NICMOS calibration numbers for red objects as above, could result in an error of as much as 0.7 mags in the intrinsic NICMOS magnitude especially at [1.1]. The effect is smaller at [1.6] and negligible at [2.2]. This is because red objects would shift the effective wavelength and the zero point of the F110W and F160W filters, both of which have passbands much wider than the ground-based and filters. We estimate the amount of this error for NGC4258 by applying a conversion from instrumental NICMOS magnitudes to ground-based magnitudes (Appendix A). This also serves a secondary purpose which is to compare the colors of the starlight in NGC4258, derived from the NICMOS data, with ground-based colors.
We have converted the NICMOS [1.1] and [1.6] images to ground-based and magnitudes and rederived the compact source flux density using the procedure described earlier. We find that the starlight in the galaxy has a JK color of 1.0 mag and a JH color of 0.6 mag. This is in excellent agreement with the ground-based colors of JK0.9 mag and JH0.6 mag obtained by CB97 at a distance of 6 from the center. These colors are consistent with the colors of late type stars expected to dominate the surface brightness in the central regions of the galaxy. The resultant flux density of the central source is 1.1 mJy at 1.6 and 3.6 mJy at 2.2 . This is within the photometric errors assigned to the compact component above and hence we conclude that the wide bandpass of the filters doesn’t significantly affect our determination of the compact source flux density.
Near infrared data were also obtained in the Ls (, ) and Ks (, ) bands using the Cassegrain IR Camera on the 5.1 m Hale telescope. A Ks PSF source was scaled to the flux density of the compact 2.2 source in NGC4258 and subtracted from the Ks image of the galaxy after aligning. The residual image corresponds to the surface brightness profile of the starlight in the galaxy. This was then normalized to the Ls surface brightness at a radius of 2.25 and subtracted. The normalization factor of =1.98 corresponds to a KsLs color of 0.16 mag, which is reasonable considering the JH and HK colors of the starlight. Photometry was performed on the Ls residual image which is dominated by the compact component. We measure a flux density of 203 mJy for this source.
The mid infrared data were obtained using the MIRLIN camera on the 10 meter Keck II telescope in March 1998 (Ressler et al. 1994). The array is a 128128 array with a pixel scale of 0.14/pixel at the f/40 bent Cassegrain focus of Keck II. The instrument has a square wave chopper which chops at 5 Hz. The chopper throw was set at 6 which allowed the source to be on the array at both chop positions. Observations were made with a filter which is centered at 12.5 with a passband of 1.2 and a filter which is centered at 17.9 with a passband of 2 . We chopped 300 times per position and nodded by 6 after a minute. The total integration time was 300 s at 12.5 and 450 s at 17.9 . The resultant 1 sensitivity at 12.5 and 17.9 was 20 mJy and 50 mJy in a 2.8 diameter beam respectively.
The mid infrared data were reduced in a standard manner (Bock et al. 1998). Airmass corrections were performed which were less than 5 since the standards and source were at similar elevation angles. The final image at these wavelengths is dominated by a single unresolved source (FWHM0.5) with no evidence of extended emission on scales of diameter up to 6. The observed flux density of the unresolved central source is 16520 mJy at 12.5 and 30030 mJy at 17.9 .
3 Emission from a Compact Extincted Continuum Source
CB97 showed that the red near-infrared colors of the nucleus of the galaxy could not be explained by uniform foreground extinction of starlight or by stars mixed with dust. In addition, starlight cannot explain the observed spectrum of the enhanced nuclear emission at (Table 1).
If the enhanced infrared emission in the nucleus arises in a compact nuclear continuum source associated with the 3.5107 M☉ black hole as argued by CB97, it implies that the extinction observed in the X-ray data occurs in a foreground screen such as a dust lane, attenuating both the near and mid infrared intensities111For the rest of this paper, we assume A[1.1]=0.282 AV, A[1.6]=0.624 A[1.1], A[2.2]=0.382 A[1.1], A[3.5]=0.182 A[1.1], A[10]=0.192 A[1.1], A[12.5]=0.098 A[1.1], A[17.9]=0.083 A[1.1] (Mathis 1990).. The visible/UV polarimetry data on the central source shows a F spectrum in scattered light (W95) similar to our observed mid-infrared spectrum. Therefore, it is reasonable to assume that the intrinsic near-infrared spectrum of the compact source follows a similar trend and that the observed [1.6][2.2] color of the compact source is due to extinction. We calculate that the amount of extinction required to fit the near and mid infrared data by a single power law corresponds to A18 mag. This is smaller than the extinction derived from the X-ray column density. However, as pointed out by Gammie, Narayan, & Blandford (1999), the column density NH derived by Makishima et al. (1994) is unreliable since it is sensitive to the relative contributions of the components used to fit the X-ray data. In addition, the conversions from the X-ray opacity, to NH and from NH to AV is not well established. The resultant extinction corrected infrared spectrum follows a power law, suggesting a non-thermal origin. The extinction corrected flux densities are shown in Figure 3 and Table 1.
The extrapolated flux density of the central source at 1.1 based on our fitted spectrum is calculated to be 10 mJy. If we extinct this 1.1 source by AV=18 mag, we obtain a flux density of 0.1 mJy, consistent with our derived upper limit. The 0.620 luminosity of the central source derived from our fitted F spectrum is 8.51041 ergs s-1. This is a factor of 20 greater than the X-ray luminosity.
RL78 measured a flux density of 10012 mJy in a 5.7 diameter beam with a 813 filter. Since our mid-infrared images do not show any evidence of extended emission from the nucleus of the galaxy at scales of 6, this measurement must be dominated by the central source. If our extinction corrected measurements are interpolated to 10 assuming a spectrum, we obtain an unextincted flux density in the 813 filter of 190 mJy. After putting in the extinction in the 813 window including the 9.7 silicate feature, corresponding to AV=18 mag, we derive an extincted 10 flux density of 98 mJy for the central source, in excellent agreement with the large beam measurements.
The VLA observations of Turner & Ho (1994) had detected the existence of a non-thermal source in the nucleus of the galaxy at 2 cm and 6 cm. Milli-arcsecond resolution VLBI continuum observations indicate that most of the non-thermal radio emission arises in a sub-parsec-scale jet which is aligned with the rotation axis of the masing disk (Herrnstein et al. 1997). The black hole region itself is undetected and Herrnstein et al. (1998) obtain a 3 upper limit of 220 Jy at 22 GHz. When compared to the extinction corrected infrared spectrum, this seems to suggest that the spectrum has a turnover probably due to synchrotron self-absorption between 20 and 0.2 mm. The total luminosity of the central source longward of 1 is relatively insensitive to the turnover frequency and is constrained to lie between 81041 ergs s-1 and 31042 ergs s-1 for turnover wavelengths of 20 and 0.2 mm respectively. Spinoglio & Malkan (1989) suggested that the 12 luminosity is typically about 1/5 of the bolometric luminosity of active galaxies, independent of whether the emission is thermal or non-thermal in origin. We find by this argument, the bolometric luminosity of NGC4258 to be 1042 ergs s-1, which is in between our independently derived luminosity range.
As indicated by the extinction correction to our measurements, the nucleus of NGC4258 clearly has dust associated with it. The extinction corrected infrared emission from 1 to 20 has a power law spectrum which appears to extend up to visible wavelengths as seen in the polarimetric observations of W95. This makes thermal dust emission at these wavelengths unlikely and we infer the infrared emission is non-thermal in origin. Many previous authors have concluded that the source of both the near and mid infrared emission in the nucleus of Seyferts is thermal emission from dust reprocessing of a blue, nuclear continuum (e.g. Giuricin, Mardirossian, & Mezzetti 1995). This was based on a weak correlation between the X-ray and mid-infrared emission in a large sample of Seyferts. Our derived spectrum suggests that it is more likely that the dust in the nucleus of NGC4258 is cool and contributes substantially only at far-infrared/submillimeter wavelengths.
4 The Accretion Flow in NGC4258
4.1 Implications for an Advection Dominated Flow
M97 has derived the 108 to 1020 Hz spectrum of systems dominated by an ADAF (Figure 4). The spectrum consists of three components; a synchrotron component at Hz, a power law component for 10 Hz from the inverse Compton scattering of the cyclosynchrotron photons and a bremsstrahlung component at higher frequencies.
From M97, the spectral index of the power law (L) is given by
| (1) |
| (2) |
| (3) |
where is the optical depth to electron scattering, A is the mean photon energy amplification factor in a single scattering, , is a term relating the radial velocity of the accretion flow to the Keplerian velocity and is the inner radius of the ADAF which we assume to be 3 RS. is the electron temperature which is constant over the ADAF region. Based on the figures from M97, we adopt a =4.4109 K, =0.3, and derive from the above equations, an accretion rate of in Eddington units, which corresponds to M☉/yr.
It is also possible to estimate from the bolometric luminosity as shown by M97. For =0.3, =0.5, we find that our L ergs s-1 corresponds to in Eddington units which is again reasonable considering the factor of 3 uncertainty in the bolometric luminosity. is the ratio of gas pressure to total pressure.
In comparison, Lasota et al. (1996) derived a rate of through an ADAF. However, at that time the infrared data which better constrain the bolometric luminosity of the central engine was not available and the ADAF models were fit to the slope of the X-ray data. More recently, Gammie et al. (1999) derive an accretion rate of 0.01 M☉/yr through an ADAF using the infrared data of CB97 as a constraint. Again, this analysis assumed that most of the visible/IR emission has a Comptonized blackbody spectrum and arises in the cool, thin disk rather than in the ADAF itself. Our recent data suggests that the visible/IR emission has a common origin and has an intrinsic spectrum that can be well represented by a power law.
Herrnstein et al. (1998) have shown based on their 22 GHz upper limit, that the ADAF cannot extend significantly beyond 102 RS. We find that the 22 GHz limit in conjunction with the spectrum of M97 in the self-absorbed radio regime is inconsistent with our measurements (Figure 4). We predict that the radio synchrotron spectrum must have a spectral index of 2.5 where F rather than the derived for a thermal distribution of electrons by M97. This could arise if the distribution of electrons has a power law tail at higher energies. Maintaining a power law distribution of relativistic particles without resorting to an independent injection mechanism such as magnetic reconnection has been an unsolved problem for some time now (McCray 1969). All previous work has assumed that the particle distribution in an ADAF is thermal. However, Mahadevan & Quataert (1997) investigated the emission spectrum for different accretion rates through an ADAF. They found that for low accretion rates, the thermalization of the electron distribution through Coulomb collisions with the protons and through self absorption of synchrotron photons, is inefficient. Adiabatic compression of the electron gas acts as the primary heating mechanism which results in the high energy tail of the electron distribution function having a non-thermal Gaussian profile rather than a Maxwellian profile. Alternatively, Mahadevan et al. (1997) has suggested that if the weak Galactic center source Sgr A∗ is associated with the EGRET source 2EG J1746-2852, the gamma ray spectrum could be explained by an E-2.75 distribution of protons in an ADAF. A similar power law distribution of electrons would indicate that the electron distribution function is generated by the same viscous heating mechanism responsible for generating the proton distribution function.
4.2 Implications for a Standard Thin Disk
We find that the excellent agreement between the fit F spectrum and data obviates the need for a significant Comptonized blackbody continuum from a standard optically thick, geometrically thin disk. However, 22 GHz observations show the existence of a thin disk with inner radius 0.14 pc which sustains the water masers (Miyoshi et al. 1995). From standard disk theory (Frank, King & Raine 1992),
| (4) |
where is the central mass in units of M☉ and is the radius of the disk in units of RS. For a geometrically thin, optically thick disk to be capable of emitting blackbody near-infrared photons, it should be at least 1500 K. Based on the derived accretion rate, this implies a conservative lower limit of 200 RS for the inner radius of the thin disk.
5 Conclusions
NGC4258 has associated with it a compact nuclear source at near and mid infrared wavelengths which is unresolved even at a near-infrared resolution of 0.2 FWHM. This implies the emitting region is 3.5 pc in radius at the distance of the galaxy. The observed infrared flux densities can be fit by a single power law of the form F from 1 to 18 after correcting for about 18 mags of visual extinction. The total extinction corrected infrared luminosity (120 ) of the central source is 8 ergs s-1. At shorter wavelengths, the power law spectrum seems to extend upto visible wavelengths as shown by the polarimetric observations of W95. At longer wavelengths, the infrared spectrum along with the 22 GHz upper limit points towards a synchrotron self-absorption turnover wavelength between 20 and 0.2 mm. From this spectrum, we derive the bolometric luminosity of the nuclear source to be 21042 ergs s-1. The low bolometric luminosity and power law spectrum extending from visible to mid-infrared wavelengths indicates that self-Comptonized synchrotron emission arising in an ADAF is responsible for the enhanced infrared emission. The spectrum obviates the need for a “big blue bump” at these wavelengths from a cool, optically thick, geometrically thin disk extending beyond the advection dominated flow. Such a disk is predicted to have a F spectrum which appears unlikely from our data. Based on the spectrum of the source and the derived bolometric luminosity, we infer the accretion rate through an ADAF in NGC4258 to be 10-3 M☉/yr.
Appendix A Conversion of NICMOS magnitudes to Ground-based magnitudes
In this section, we describe the color correction applied to convert
the NICMOS [1.1], [1.6] and [2.2] magnitudes to ground-based , ,
magnitudes. The color correction
is applied for two reasons:
1. To compare the results from this NICMOS data set with previous
ground-based observations,
2. To correct for calibration errors which arise due to the wider
bandpass of the NICMOS F110W and F160W filters.
It has been suggested that since the NICMOS filters were
calibrated off solar analog stars,
using the standard NICMOS calibration numbers could result in an
error of as much as 0.7 mags in the intrinsic NICMOS
magnitude for red ( mag) objects (Rieke 1999). This error is not significant in the
ground-based , filters because of their much narrower bandpass.
NICMOS has observed a sample of standards of different colors for which the ground-based magnitudes are known (Table 2). Thus, by converting instrumental magnitudes to ground-based magnitudes on the basis of these observations, we can eliminate calibration errors. Figure 5 shows the color correction with the best corresponding linear fit listed below. The color correction at [2.2] is small enough that we take it to be 0.
| (A1) | |||||
| (A2) |
References
- (1) Bock, J. J., Marsh, K. A., Ressler, M. E., & Werner, M. W., 1998, ApJ, 504, L5
- (2) Bushouse, H., 1997, The 1997 HST Calibration Workshop with a New Generation of Instruments, 223
- (3) Chary, R. & Becklin, E. E., 1997, ApJ, 485, L75 (CB97)
- (4) Frank, J., King, A. R., & Raine, D., 1992, Accretion Power in Astrophysics (Cambridge: Cambridge University Press)
- (5) Filippenko, A. V., 1996, in The Physics of LINERs in View of Recent Observations, ed. M. Eracleous et al., ASP Conference Series 103, 17
- (6) Fruchter, A., & Hook, R. N., 1997, ST-ECF Newsletter No. 24, Pg. 9
- (7) Gammie, C. F., Narayan, R., & Blandford, R. D., 1999, ApJ, 516, 177
- (8) Genzel, R., Eckart, A., Ott, T., Eisenhauer, F., 1997, MNRAS, 291, 219
- (9) Ghez, A. M., Klein, B. L., Morris, M., Becklin, E. E., 1998, ApJ, 509, 678
- (10) Giuricin, G., Mardirossian, F., & Mezzetti, M., 1995, ApJ, 446, 550
- (11) Herrnstein, J. R., Greenhill, L. J., & Moran, J. M., 1996, ApJ, 468, L17
- (12) Herrnstein, J. R., Moran, J. M., Greenhill, L. J., Diamond, P. J., Miyoshi, M., Nakai, N., & Inoue, M., 1997, ApJ, 475, L17
- (13) Herrnstein, J. R., Greenhill, L. J., Moran, J. M., Diamond, P. J., Inoue, M., Nakai, N., & Miyoshi, M., 1998, ApJ, 497, L69
- (14) Herrnstein, J. R., Moran, J. M., Greenhill, L. J., Diamond, P. J., et al., 1999, Nature, in press
- (15) Krist, J. & Hook, R. N. 1997, ST-ECF Newsletter No. 24, Pg. 10
- (16) Lasota, J. P., Abramowicz, M. A., Chen, X., Krolik, J., Narayan, R., & Yi, I., 1996, ApJ, 462, 142
- (17) Mahadevan, R., & Quataert, E., 1997, ApJ, 490, 605
- (18) Mahadevan, R., 1997, ApJ, 477, 585 (M97)
- (19) Makishima, K., et al. 1994, PASJ, 46, L77
- (20) Mathis, J. S., 1990, ARA&A, 28, 37
- (21) McCray, R., 1969, ApJ, 156, 329
- (22) Miyoshi, M., Moran, J. M., Herrnstein, J. R., Greenhill, L. J., Nakai, N., Diamond, P. J., & Inoue, M., 1995, Nature, 373, 127
- (23) Mushotzky, R. F., Done, C., & Pounds, K. A., 1993, ARA&A, 31, 717
- (24) Narayan, R. & Yi, I., 1995, ApJ, 452, 710
- (25) Pringle, J. E., 1981, ARA&A, 19, 137
- (26) Rieke, M. J., et al., 1999, private communication
- (27) Rieke, G. H. & Lebofsky, M. J., 1978, ApJ, 220, L37 (RL78)
- (28) Scoville, N. Z., et al., 1999, AJ, in press
- (29) Shakura, N. I., & Sunyaev, R. A., 1973, A&A, 24, 337
- (30) Spinoglio, L. & Malkan, M. A., 1989, ApJ, 342, 83
- (31) Thompson, R., Rieke, M., Schneider, G., Hines, D. C., Corbin, M. R., 1998, ApJ, 492, L95
- (32) Turner, J. L. & Ho, P. T. P., 1994, ApJ, 421, 122
- (33) Ressler, M. E., Werner, M. W., Van Cleve, J., & Chou, H. A., 1994, in Infrared Astronomy with Arrays: The Next Generation, ed. I. S. McLean (Dordrecht: Kluwer), 429
- (34) Wilkes, B. J., Schmidt, G. D., Smith, P. S., Mathur, S., & McLeod, K. K., 1995, ApJ, 455, L13 (W95)
- (35)


| Observed Fν | Extinction Corrected Fν | Reference | ||
|---|---|---|---|---|
| Hz | mJy | mJy | ||
| 210 keV | 1.45 | … | 4.7 | Makishima et al. (1994) |
| 0.55 | 5.45 | … | 1.7170 | W95 |
| 1.1 | 2.73 | 0.5 | 10 | |
| 1.6 | 1.88 | 0.90.3 | 16 | |
| 2.2 | 1.36 | 4.00.7 | 25 | |
| 3.45 | 8.70 | 203 | 46 | |
| 10.5aa813 filter. | 2.86 | 10012 | 195 | RL78 |
| 12.5 | 2.40 | 16520 | 270 | |
| 17.9 | 1.68 | 30030 | 435 | |
| 1.4 cm | 22 | … | 0.22 | Herrnstein et al. (1998) |
| Object | [1.1] | [1.6] | [2.2] | |||
|---|---|---|---|---|---|---|
| G191-B2B (WD) | 12.490.02 | 12.680.02 | 12.710.02 | 12.720.03 | 12.830.02 | … |
| P330E (G star) | 12.010.02 | 11.960.02 | 11.570.02 | 11.590.02 | 11.490.02 | 11.510.02 |
| BRI0021 (red) | 12.450.02 | 11.840.01 | 11.280.02 | 11.090.01 | 10.480.02 | 10.550.01 |