Galaxies of Redshift : The View from Stony Brook
Abstract
We report on some aspects of our efforts to establish properties of the extremely faint galaxy population by applying our photometric redshift technique to the HDF and HDF–S WFPC2 and NICMOS fields. We find that cosmological surface brightness dimming effects play a dominant role in setting what is observed at redshifts , that the comoving number density of high intrinsic surface brightness regions increases monotonically with increasing redshift, and that previous estimates neglect a significant or dominant fraction of the ultraviolet luminosity density of the universe due to surface brightness effects. The ultraviolet luminosity density of the universe plausibly increases monotonically with increasing redshift to redshifts beyond .
1. Introduction
We have over the past few years applied our photometric redshift technique to the Hubble Deep Field (HDF) and Hubble Deep Field South (HDF–S) WFPC2 and NICMOS fields (e.g. Lanzetta, Yahil, & Fernández-Soto 1996, 1998; Fernández-Soto, Lanzetta, & Yahil 1999; Yahata et al. 2000). Our objective is to establish properties of the extremely faint galaxy population by identifying galaxies that are too faint to be spectroscopically identified by even the largest ground-based telescopes. Our experiences indicate that photometric redshift measurements are at least as robust and reliable as spectroscopic redshift measurements (and probably significantly more so). Specifically, comparison of photometric and reliable spectroscopic measurements in the HDF and HDF–S fields demonstrates that the photometric redshift measurements are accurate to within an RMS relative uncertainty of and that there are no known examples of photometric redshift measurements that are in error by more than a few times the RMS uncertainty. These results apply at all redshifts that have yet been examined. It thus appears that the photometric redshift technique provides a means of obtaining redshift identifications of large samples of the faintest galaxies to the largest redshifts.
Here we report on some aspects of our efforts. Highlights of the results include the following:
1. We have identified nearly 3000 faint galaxies, of which nearly 1000 galaxies are of redshift and more than 50 galaxies are of redshift (ranging up to and beyond ). Further, we have fully characterized the survey area versus depth relationships, in terms of both energy flux density and surface brightness, in order to measure statistical properties of the very high redshift galaxy population.
2. We find that cosmological surface brightness dimming effects play a dominant role in setting what is observed at redshifts . Most importantly, we find that it is more or less meaningless to interpret the galaxy luminosity function (or its moments) at high redshifts without explicitly taking account of surface brightness effects.
3. We find that the comoving number density of high intrinsic surface brightness regions (or in other words of high star formation rate density regions) increases monotonically with increasing redshift.
4. We find that previous estimates neglect a significant of dominant fraction of the ultraviolet luminosity density of the universe due to surface brightness effects and that the rest-frame ultraviolet luminosity density (or equivalently the cosmic star formation rate density) has not yet been measured at redshifts . The ultraviolet luminosity density of the universe plausibly increases monotonically with increasing redshift to redshifts beyond .
The most recent versions of our photometry and redshift catalogs of faint galaxies in the HDF and HDF–S fields can be found on our web site at:
http://www.ess.sunysb.edu/astro/hdfs/.
Here and throughout we adopt a standard Friedmann cosmological model of dimensionless Hubble constant and deceleration parameter .
2. Observations and Analysis
Our current observations and analysis differ from our previous observations and analysis in three important ways:
First, we have included all available public ground- and space-based imaging observations of the HDF, HDF–S WFPC2, and HDF–S NICMOS fields. Details of the current observations are summarized in Table 1.
| Table 1 | |
|---|---|
| Field | Filters |
| HDF | F300W, F450W, F606W, F814W, |
| F110W, F160W, , , | |
| HDF–S WFPC2 | F300W, F450W, F606W, F814W, |
| , , , , , , , | |
| HDF–S NICMOS | F110W, F160W, F222M, STIS, |
| , , , , | |
Second, we have developed and applied a new quasi-optimal photometry technique based on fitting models of the spatial profiles of the objects (which are obtained using a non-negative least squares image reconstruction method) to the ground- and space-based images, according to the spatial profile fitting technique described previously by Fernández-Soto, Lanzetta, & Yahil (1999). For faint objects, the signal-to-noise ratios obtained by this technique are larger than the signal-to-noise ratios obtained by aperture photometry techniques by typically a factor of two.
Third, we have measured photometric redshifts using a sequence of six spectrophotometric templates, including the four templates of our previous analysis (of E/S0, Sbc, Scd, and Irr galaxies) and two new templates (of star-forming galaxies). Inclusion of the two new templates eliminates the tendency of our previous analysis to systematically underestimate the redshifts of galaxies of redshift (by a redshift offset of roughly 0.3), in agreement with results found previously by Benítez et al. (1999).
The accuracy and reliability of the photometric redshift technique is illustrated in Figure 1, which shows the comparison of 108 photometric and reliable spectroscopic redshifts in HDF and HDF–S. (Note that a non-negligible fraction of published spectroscopic redshift measurements of galaxies in HDF and HDF–S have been shown to be in error and so must be excluded from consideration.) With the sequence of six spectrophotometric templates, the photometric redshifts are accurate to within an RMS relative uncertainty of and there are no known examples of photometric redshift measurements that are in error by more than a few times the RMS uncertainty. These results apply at all redshifts that have yet been examined. Details of some of our current observations and analysis are described by Yahata et al. (2000).

3. Stony Brook Faint Galaxy Redshift Survey
Our analysis of the HDF and HDF–S WFPC2 and NICMOS fields constitutes a survey of galaxies to the faintest energy flux density and surface brightness limits currently accessible. Properties of the redshift survey are as follows:
First, we have determined nine- or 12-band photometric redshifts of faint galaxies in three deep fields.
Second, we have selected galaxies at both optical and infrared wavelengths, in two or more of the F814W, F160W, , and bands (depending on field). (We have related selection in different bands by adopting the spectral energy distribution of a star-forming galaxy).
Third, we have fully characterized the survey area versus depth relations, as functions of both energy flux density and surface brightness.
Fourth, we have established properties of the extremely faint galaxy population by using a maximum-likelihood parameter estimation technique and a bootstrap resampling parameter uncertainty estimation technique. The derived parameter uncertainties explicitly account for the effects of photometric error, sampling error, and cosmic dispersion with respect to the spectrophotometric templates.
The Stony Brook faint galaxy redshift survey includes nearly 3000 faint galaxies, of which nearly 1000 galaxies are of redshift and more than 50 galaxies are of redshift (ranging up to and beyond ). The depth and scope of the survey is summarized in Figure 2, which shows redshift distributions of all galaxies identified in the HDF and HDF–S WFPC2 and NICMOS fields. The redshift distributions of galaxies identified in the HDF and HDF–S WFPC2 field are characterized by broad peaks at redshift and long tails extending to redshifts . Further, the distributions are statistically different from one another (with the HDF–S WFPC2 field exhibiting a statistically significant excess of galaxies of redshift compared with the HDF), and both exhibit statistically significant large-scale fluctuations. The redshift distribution of galaxies identified in the HDF–S NICMOS field is characterized by a broad peak at redshift and a long tail extending to redshifts .

4. Some High-Redshift Galaxies
Examples of some high-redshift galaxies are shown in Figure 3, which plots observed and modeled spectral energy distributions and redshift likelihood functions of galaxies identified in the HDF–S WFPC2 and NICMOS fields.

The top group of panels of Figure 3 shows four galaxies of redshift and near-infrared continuum magnitude , and the middle group of panels of Figure 3 shows four galaxies of redshift and near-infrared continuum magnitude . In each case, the spectral enery distribution shows unambiguous evidence of the -forest and Lyman-limit decrements, and the redshift likelihood function is very sharply peaked, indicating that, of all the spectrophotometric models considered, the appropriately redshifted spectrophotometric template provides the only plausible fit to the observations. We believe that the redshifts indicated in the top and middle groups of panels of Figure 3 are established with essentially complete certainty—and with substantially greater certainty than has been or could be achieved by means of spectroscopic observations of galaxies of the same redshifts and continuum magnitudes. The galaxies shown in the top and middle groups of panels of Figure 3 are unexceptional, and results shown for these galaxies are completely representative of results obtained for other similar galaxies.
Results of Figure 1 indicate that at redshifts , the RMS measurement uncertainty of the photometric redshift technique is or , which we believe results primarily due to stochastic variations in the density of the forest among different lines of sight. Results of Figure 1 indicate (albeit with limited statistical certainty) that at redshifts the RMS measurement uncertainty of the photometric redshift technique is or , which we believe is superior to results at redshifts because almost complete absorption in the forest allows for less stochastic variations in the density of the forest among different lines of sight.
The bottom group of panels of Figure 3 shows four galaxies of best-fit photometric redshift measurement and near-infrared continuum magnitude , including two galaxies (galaxies B and C) that we identified previously as candidate extremely high redshift galaxies on the basis of ground-based near-infrared measurements (Lanzetta, Yahil, & Fernández-Soto 1998). At these redshifts and continuum magnitudes, the redshift determinations are not unambiguous, and the high-redshift solutions are typically accompanied by lower-redshift solutions, of early-type galaxies of redshift . Additional deep imaging observations of these galaxies are needed to establish their redshifts with certainty.
5. The Galaxy Luminosity Function at Redshifts
We have modeled the rest-frame 1500 Å luminosity function of galaxies of redshift by adopting an evolving Schechter luminosity function
| (1) |
with
| (2) |
The best-fit parameters for a simultaneous fit to the HDF and HDF–S WFPC2 and NICMOS fields (where we have related selection in different bands by adopting the spectral energy distribution of a star-forming galaxy) are Mpc-3, erg s-1 Hz-1, , and . The best-fit model is compared with the observations in Figure 4, which shows the cumulative galaxy surface density versus redshift and magnitude for galaxies selected in the F814W and F160W bands.
From a practical point of view, Figure 4 presents our best measurements and models of the empirical galaxy surface density versus redshift and near-infrared magnitude. The most striking result of Figure 4 is that galaxies identified by our analysis at the highest redshifts (which are detected only at the faintest F160W magnitudes ) are predicted by a straightforward extrapolation of a plausible model of the high-redshift galaxy luminosity function. For our analysis to have uncovered no galaxies of redshift would have implied rapid evolution of the galaxy luminosity function at redshifts .

6. Effects of Cosmological Surface Brightness Dimming
Results of the previous section indicate that the galaxy luminosity function evolves only mildly at redshifts , i.e. as with . But due to cosmological surface brightness dimming, the measured luminosities of extended objects decrease rapidly with increasing redshift, even if the actual luminosities of the objects remain constant. For this reason, we consider it more or less meaningless to interpret the galaxy luminosity function (or its moments) over a redshift interval spanning through without explicitly taking account of surface brightness effects.
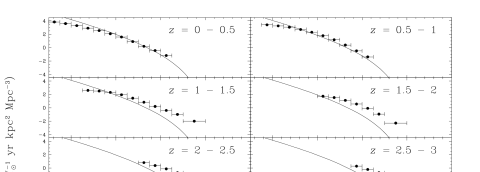
To make explicit the effects of cosmological surface brightness dimming on observations of high-redshift galaxies, we have constructed the “star formation rate intensity distribution function” . Specifically, we consider all pixels contained within galaxies on an individual pixel-by-pixel basis. Given the redshift of a pixel (which is set by the photometric redshift of the host galaxy), an empirical correction (which is set by the model spectral energy distribution of the host galaxy) and a cosmological model determine the rest-frame 1500 Å luminosity of the pixel, and an angular plate scale and a cosmological model determine the proper area of the pixel. Adopting a Salpeter initial mass function to convert the rest-frame 1500 Å luminosity to the star formation rate and dividing the star formation rate by the proper area yields the “star formation rate intensity” of the pixel. Summing the proper areas of all pixels within given star formation rate intensity and redshift intervals, dividing by the star formation rate intensity interval, and dividing by the comoving volume then yields the “star formation rate intensity distribution function,” which we designate as . The star formation rate intensity distribution function is exactly analogous to the QSO absorption line systems column density distribution function (as a function of neutral hydrogen column density ). In terms of the star formation rate intensity distribution function, the unobscured cosmic star formation rate density (or equivalently the rest-frame ultraviolet luminosity density) is given by
| (3) |
Results are shown in Figure 5, which plots the star formation rate intensity distribution function versus star formation rate intensity determined from galaxies identified in the HDF and HDF–S NICMOS field. Several results are apparent on the basis of Figure 5: First, the star formation rate intensity threshold of the survey is an extremely strong function of redshift, ranging from yr-1 kpc-2 at to yr-1 kpc-2 at . We conclude that cosmological surface brightness dimming effects play a dominant role in setting what is observed at redshifts . Second, the comoving number density of high intrinsic surface brightness regions increases monotonically with increasing redshift. We conclude that the comoving number density of high intrinsic surface brightness regions (or equivalently of high star formation rate density regions) increases monotonically with increasing redshift. (See also Pascarelle, Lanzetta, & Fernández-Soto 1998). Third, at redshifts [at which is measured over a wide range in ], the distribution is characterized by a relatively shallow slope at yr-1 kpc-2 and by a relatively steep slope at yr-1 kpc-2. These slopes are such that the bulk of the cosmic star formation rate density occurs at yr-1 kpc-2, which is measured only at redshifts . We conclude that previous estimates neglect a significant or dominant fraction of the ultraviolet luminosity density of the universe due to surface brightness effects and that the rest-frame ultraviolet luminosity density (or equivalently the cosmic star formation rate density) has not yet been measured at redshifts .
This last point is illustrated in Figure 6, which shows the ultraviolet luminosity density of the universe versus redshift measured to various intrinsic surface brightness thresholds. Specifically, Figure 6 shows the ultraviolet luminosity density of the universe versus redshift measured to intrinsic surface brightness thresholds that could be detected in the HDF at all redshifts to , to , to , to , and to . (Higher intrinsic surface brightness thresholds can be seen to higher redshifts, whereas lower intrinsic surface brightness thresholds can be seen only to lower redshifts.) Results of Figure 6 indicate that to any fixed intrinsic surface brightness threshold, the ultraviolet luminosity density of the universe increases monotonically with increasing redshift. Apparently, the ultraviolet luminosity density of the universe plausibly increases monotonically with increasing redshift to redshifts beyond .

Acknowledgments.
We thank Hy Spinrad and Daniel Stern for providing spectroscopic redshift measurements in advance of publication and acknowledge Mark Dickinson and Roger Thompson for obtaining NICMOS observations of HDF. This research was supported by NASA grant NACW–4422 and NSF grant AST–9624216 and is based on observations with the NASA/ESA Hubble Space Telescope and on observations collected at the European Southern Observatory.
References
Benìtez, N, Broadhurst, T., Bouwens, R., Silk, J., & Rosati, P., 1999, ApJ, 515, L65
Fernández-Soto, A., Lanzetta, & Yahil, A. 1999, ApJ, 513, 34
Lanzetta, K. M., Yahil, A., & Fernández-Soto, A. 1996, Nature, 381, 759
. 1998, AJ, 116, 1066
Pascarelle, S., Lanzetta, K. M., & Fernández-Soto, A. 1998, ApJ, 508, L1
Yahata, N., Lanzetta, K. M., Chen, H.-W., Fernández-Soto, A., Pascarelle, S., Puetter, R., & Yahil, A. 2000, ApJ, submitted