Sodium production in asymptotic giant branch stars
Abstract
A new scenario is presented for the production of in asymptotic giant branch (AGB) stars. The scenario takes advantage of the periodic third dredge-up episodes characterizing those stars, which mix primary from their intershell layers to their surface. Two successive interpulse/pulse/dredge-up sequences are then required to produce . During the first sequence carbon and oxygen are converted into by the hydrogen burning shell, and subsequently transformed into by the helium burning shell. During the second sequence, is converted into by the hydrogen burning shell, which is brought to the surface by the subsequent dredge-up episode. The produced by this scenario is thus primary.
The efficiency of this scenario is analyzed through standard evolutionary AGB model predictions combined with synthetic calculations for the surface chemical evolution. It is shown that primary can efficiently be produced as soon as the surface C+N+O abundance enhancement reaches a certain level depending on the stellar metallicity. The required surface C+N+O abundance enhancement amounts to 0.4 dex in solar metallicity stars, and to 0.8 dex at a metallicity five times less than solar.
An analytical study of Na production further reveals that the surface abundance asymptotically evolves to a ‘line of primary sodium enrichment’ (LOPSE) in the [C+N+O][] diagram. That LOPSE represents the abundance evolution predicted in zero metallicity AGB stars experiencing third dredge-up episodes. An analytical relation for the surface abundance evolution as a function of the surface C+N+O abundance is provided.
The predicted surface enhancements can exceed 0.5 dex depending on the level of surface enrichment, and increases with decreasing stellar metallicity. The quantitative prediction of surface abundances, however, is presently subject to a high level of uncertainty, partly due to the still poor quantitative prediction of the structural evolution of AGB stars (dredge-up episodes in particular), and partly due to the uncertainties still affecting some nuclear reaction rates (such as destruction by proton capture).
The case of massive AGB stars in which hot bottom burning occurs is also discussed. The production of secondary sodium in those stars is a natural consequence of burning in their envelope, if the temperature at the base of the envelope exceeds 70 million K. It requires, however, many interpulses to be significant. The production of primary sodium from the dredge-up of primary and its subsequent burning in the envelope, on the other hand, is estimated not to be very efficient, expect maybe in low-metallicity stars.
An eventual detection of high Na overabundances in carbon stars or related objects would support the scenario of primary sodium production in AGB stars. Such an observational evidence may have been found in at least one post-AGB star. Further observations of those objects are called for. Observations of in planetary nebulae are also encouraged. Finally, the production of primary by AGB stars, if confirmed observationally, may have played a non-negligible role in the chemical evolution of our Galaxy.
Key Words.:
stars: AGB and post-AGB - stars: carbon - stars: evolution - stars: interiors - stars: abundances1 Introduction
Sodium overabundances have been observed in A-F supergiants, with 0.0[Na/H]0.5 for the F supergiants () and 0.7[Na/H]0.8 for the A-type supergiants (Takeda & Takada-Hidai Takeda_Takada-Hidai94 (1994) and references therein). The presence of enhanced sodium abundances at the surface of those stars is explained by the operation of the Ne-Na mode of H-burning during the main sequence phase, which leads to an increase of in the deep stellar layers by a factor up to ten. The penetration in those layers of the convective envelope when the star becomes a red giant, process called ‘first dredge-up’, then brings the synthesized sodium to the surface. First dredge-up predictions indeed confirm the production of to the level observed in A-F supergiants (El Eid & Champagne ElEid_Champagne95 (1995)).
High overabundances have also been measured at the surface of red giants in globular clusters as early as in the late 70’s (see Mowlavi Mowlavi98 (1998) for references). Again, the Ne-Na chain of H-burning and the operation of first dredge-up are made responsible for those surface overabundances. The observed overabundances, however, are higher than those predicted by standard111Standard models refer, in this paper, to models using the Schwarzschild criterion to delimit convective zones without applying any extra-mixing procedure such as overshooting or diffusive mixing induced by rotation model predictions, but can be explained if extra-mixing is assumed to operate below the convective envelope, probably due to rotationally induced meridional circulation. In both globular clusters’ red giants and near solar metallicity supergiants, the production of results from the transformation of the initial . The sodium produced in those stars is thus secondary222 An element is said to be secondary if its synthesis requires the presence of some elements heavier than helium in the initial stellar composition. In contrast, an element is said to be primary if it can be synthesized in a star of the first generation with zero metallicity (the metallicity being the mass fraction of all elements heavier than helium)..
In this paper, a new scenario is proposed to produce primary sodium in asymptotic giant branch (AGB) stars. The scenario, explained in more details in Sect. 2, takes advantage of the and production in the helium burning shell (HeBS) of those stars, and of the periodic mixing of those nuclei to the stellar surface. Part of the may then subsequently transform into in the hydrogen burning shell (HBS) of those stars. Such a scenario is expected to operate in carbon stars.
Several standard model stars are computed from their pre-main sequence up to the AGB phase. The stellar masses and metallicities covered in those calculations range from to and from to 0.02, respectively. The properties of those standard models are presented in Sect. 3. In particular, the surface abundance evolution prior to the AGB phase, and the abundances of , and predicted in the intershell layers during the AGB phase are discussed. Primary sodium production is then studied in detail in Sect. 4 using synthetic AGB calculations. The case of the star, which undergoes hot bottom burning (HBB), is considered separately in Sect. 5. Finally, the observational implications/confirmations of the scenario are briefly discussed in Sect. 6. Conclusions are drawn in Sect. 7.
Two Appendixes are further presented at the end of the paper. Appendix A describes briefly the CNO and Ne-Na modes of hydrogen burning, and presents the yields of those elements at hydrogen exhaustion as a function of the H-burning temperature. In particular, the impact of the new NACRE reaction rates on the production is discussed. Appendix B, on the other hand, presents an analytical study of production in AGB stars.

2 AGB stars and production
2.1 AGB stars
An AGB star is characterized by an electron degenerate C–O core of 0.5 to , by a thin HeBS of about capped by a thin HBS of a few , and by a deep convective envelope extending from above the HBS up to the surface. The HeBS is known from numerical simulations to be thermally unstable and to liberate, periodically and on a short time-scale (of several tens of years), to times the energy provided by the H-burning shell. These outbursts lead to the development of a pulse convective tongue in the HeBS. Figure 1, for example, displays the structural evolution of the intershell layers of a , model star between its 15th and 16th pulse.
A thermal instability cycle is divided, for our purposes, into three phases (illustrated in Fig. 1): the interpulse, the pulse and the afterpulse phases. The main characteristics of each of these phases in relation with sodium production are described as follow (a more detailed description can be found in Mowlavi & Meynet, in preparation, hereafter called MM99):
Interpulse phase:
During the interpulse phase, hydrogen burns in a thin layer located at mass fractions increasing with time, while the HeBS is almost extinct. The ashes left over by that HBS accumulate in the underlying He-rich zone (called zone B, see Fig. 1). Among them, is the main product emerging from the CNO mode of hydrogen burning, while is produced in the NeNa chain (see Appendix A).
Pulse phase:
As the mass of the He-rich zone increases, a thermal instability is triggered in the HeBS, and a pulse convective tongue develops. The pulse starts at the location of maximum energy production in the HeBS, and extends outward up to close the HBS. As it grows, it engulfs the ashes of H-burning available in zone B. , in particular, is mixed down to the high temperatures characterizing the pulse, and burns through -capture into . This nuclide, in turn, may burn and synthesize through . Those products are left over by the pulse in zone D, together with primary synthesized by the 3- reaction.
Afterpulse phase:
During the afterpulse phase, the structural evolution of the intershell layers is dominated by thermal relaxations. The temperature in those intershell layers drop, and the convective envelope deepens into the H-depleted and, eventually, into the C-rich layers. The ashes of H-burning which escape the ingestion by the pulse convective tongue (zone A in Fig. 1), and part of the material of zone D processed by the pulse (containing in particular , and ) are mixed to the surface. This process of mixing C-rich material into the envelope is called ’third dredge-up’ (3DUP).
2.2 Sodium production
Sodium is produced in the HBS through . This reaction essentially transforms into all the supplied by the envelope to the HBS. For solar initial composition (displayed in Table 1), it would lead to an intershell mass fraction of . At temperatures exceeding K, the slight burning of the more abundant nuclei contributes to an extra-production of (maximum 60% at 55- K, see Fig. 12 of Appendix A). Above K, however, may be destroyed by p-capture through and/or . A more detailed description of the NeNa chain is provided in Appendix A. The actual predictions from standard AGB model calculations are discussed in Sect. 3.3.
| nuclei | solar mass fraction |
|---|---|
It must be noted that the impact of that intershell secondary on the surface sodium abundance is negligible, though. This is due to the fact that the mass of intershell material dredged-up to the surface is small (, see Fig. 1) compared to the mass contained in the envelope ().
If we consider, however, the and dredged-up from the HeBS into the envelope, and the resulting nucleosynthesis during the interpulse and pulse phases, then a much larger amount of may be synthesized. The chain of events is summarized as follow:
1) 3DUP mixes into the envelope some primary produced in the intershell layers by the 3- reaction;
2) during the following interpulse, the (and ) provided by the envelope to the HBS is burned into through the CNO cycle, which accumulates in zone of the intershell layers;
3) the left over in zone B is engulfed in the next pulse, and contributes to the nucleosynthesis occurring in that pulse. In particular, is synthesized through ();
4) part of that emerging from the pulse is dredged-up in the envelope during the afterpulse phase;
5) the provided by the envelope to the HBS during the next interpulse is transformed into by the NeNa chain. The fraction of that which survives destruction by p-capture accumulates in zone of the intershell layers;
6) the left over in zone B is engulfed in the next pulse, but is unaffected by He-burning nucleosynthesis. It thus emerges from the pulse unburned but diluted over zone D, and is partly mixed to the surface by the following 3DUP.
In summary, the sodium produced in this chain of events essentially results from the conversion of the envelope’s CNO into during an interpulse/pulse/3DUP chain of events, followed by the conversion of into during a second interpulse/pulse/3DUP chain of events. Two dilution processes are thus necessary. Assuming a solar repartition of the elements heavier than helium, it can be shown (Sect. 4.2) that the initial CNO abundances are insufficient to produce in excess of its initial abundance. The dredge-up of primary from the HeBS is thus essential to increase the envelope’s C+N+O abundance, and to lead to significant production. The sodium produced in this way is thus primary.
3 Standard models
3.1 The models
| model star | |||||||
|---|---|---|---|---|---|---|---|
| ratio | dex | ||||||
| 6.0, 0.020 | 3.52 | 5.38 | 6.32 | 1.80 | 0.25 | ||
| 4.0, 0.018 | 3.17 | 4.82 | 4.88 | 1.54 | 0.19 | ||
| 3.0, 0.020 | 3.52 | 5.20 | 5.20 | 1.48 | 0.17 | ||
| 2.5, 0.018 | 3.17 | 4.54 | 4.54 | 1.43 | 0.16 | ||
| 1.5, 0.018 | 3.17 | 3.37 | 3.37 | 1.06 | 0.03 | ||
| 2.5, 0.008 | 1.41 | 2.17 | 2.17 | 1.54 | 0.19 | ||
| 2.5, 0.004 | 0.70 | 1.15 | 1.16 | 1.66 | 0.22 | ||
Seven model stars are evolved from the pre-main sequence phase up to the 15-30th pulse in the AGB phase. The initial masses and metallicities are (/, )(1.5, 0.018), (2.5, 0.018), (3, 0.020), (4, 0.018), (6, 0.020), (2.5, 0.008) and (2.5, 0.004).
The stellar evolution code originates from Mowlavi (Mowlavi95 (1995), see also MM99 for more details about the models). It was designed to follow as accurately as possible the structural and chemical evolution of AGB stars. The abundance profiles of 47 nuclei from H to S, linked by a nuclear reaction network of 160 reactions, are followed consistently with the stellar structure all along the stars evolution. The initial mass fractions of hydrogen and helium are taken to be and , respectively. The abundances of the other elements are taken from Anders & Grevesse (Anders_Grevesse89 (1989)) scaled to the required metallicity. In particular, the solar abundances, taken at , of those nuclei involved in the synthesis of are listed in Table 1. The rates of the nuclear reactions involved in the Ne-Na chain are given in Appendix A. Recently, a new compilation of reaction rates has been made available by the NACRE project. Their impact on the production of in AGB stars is also discussed in that Appendix.
The convective zones are delimited by the standard Schwarzschild criterion, with no extra-mixing beyond the convective borders so defined. Such standard models have been shown to fail to consistently reproduce the 3DUP phenomenon (see Mowlavi Mowlavi99 (1999) and references therein). The use of some sort of extra-mixing is required to model the 3DUP episodes. Such procedures, however, are very computer time consuming. For that reason, and in order to analyze the sodium production in a variety of AGB models of different masses and metallicities, the models presented in this section are performed without extra-mixing. The surface abundances are then computed a posteriori using synthetic AGB calculations. This is done in Sect. 4.
3.2 Surface abundances prior to the thermally pulsing AGB phase
In standard models not experiencing 3DUP episodes during the AGB phase, the surface abundance of red giants can only be affected by the first and, possibly, second333 The second dredge-up occurs at the end of the early AGB phase (i.e. before the thermally pulsing AGB phase) and only for stars more massive than at ( at ). dredge-ups. The surface sodium abundances predicted after those dredge-up episodes are shown in Table 2 for all our stars. The abundance enhancements reach 40 to 80% (0.15-0.25 dex) relative to its initial abundance in all the intermediate-mass stars considered in this paper, and less than 10 % in the star. Those predictions agree with the ones available in the literature.


3.3 Intershell abundances during the AGB phase
As recalled in the preceding section, no surface abundance alteration is predicted by our standard TP-AGB models444The eventual dredge-up of the He-rich (but not C-rich) material from zone (Fig. 1) leads to a negligible alteration of the surface Na abundance.. It is, however, instructive to analyze the abundance profile of the secondary in the intershell layers of the standard models. The question of destruction by p-capture, in particular, is of relevance for our study.
The intershell temperature and Ne-Na abundance profiles at the end of the 6th interpulse of the , model star are shown in Fig. 2. Secondary is produced at the level expected from the operation of the NeNa chain (Sect. 2.2). The temperatures characterizing the HBS are lower than K, and no destruction by p-capture is obtained, as expected. The intershell abundance is 5 times higher than its surface abundance.
The same profiles are presented in Fig. 3, but for the 22nd interpulse of the , model star. The HBS of those models is characterized by temperatures reaching K, leading to the activation of burning by p-capture. Indeed, a slight destruction of is observed in the ashes left over by the HBS (Fig. 3). However, the intershell abundance is found to still be 2.3 times higher than its surface abundance. Compared to the intershell abundance in the 6th interpulse of the , star, the destruction amounts to a factor of about 2. This Na destruction factor agrees with the yields of the parametric H-burning calculations presented in Appendix A.
Recently, a new compilation of nuclear reaction rates has been provided by the NACRE project (Arnould et al. Arnould_etal99 (1999)), which predicts much higher p-capture rates than estimated before. In order to evaluate the impact of those new reaction rates on Na production in AGB stars, the 22nd interpulse of the , is recomputed with those new rates. The resulting intershell abundance amounts now to only 70% of its surface abundance. The destruction factor is thus 7, which is much higher than with the old reaction rates. It must be noted, however, that the high uncertainties still affecting the p-capture rates do not, at present time, enable to lead to a definite conclusion. Arnould et al. (Arnould_etal99 (1999)) show, for example, that can still be produced to an abundance 3 times higher than its initial abundance, even at K, within the uncertainties of the new nuclear reaction rates.
3.4 Intershell and abundances

The mass fraction of emerging from the pulses is shown in Fig. 4 for all our model stars as a function of the H-depleted core mass. It reaches up to 30% in the , star, and evolves after a sufficient number of pulses to an asymptotic value of % independent of the stellar mass and metallicity. The abundance of emerging from the pulses, on the other hand, is shown in Fig. 5a as a function of the temperature of the HBS at the onset of each pulse.
Let us consider the production in the intershell layers. If we assume that all the available and in the HBS are transformed into , then mass fractions of are expected in the intershell layers for solar initial chemical composition (cf. Table 1). Converted into , this would lead to a abundance emerging from each pulse, , 157 times higher than its initial abundance . For solar initial composition, this corresponds to mass fractions.
In reality, and are present at the level of few percents in the ashes of H-burning, reducing accordingly the amount of available for the synthesis of . Though the reduction is very small (few percents), it is instructive to pursue further the discussion. Parametric nucleosynthesis calculations, presented in Appendix A, show that the abundance of emerging from H-burning actually depends slightly on the temperature at which hydrogen burns. Taking those temperature-dependent yields, the expected ratio ranges between 149 and 151 (dotted line in Fig. 5a). Comparing that value with the intershell abundance predicted by the stellar models (filled and open symbols in Fig. 5), we see that essentially all transforms into at pulse temperatures (given in Fig. 5b) exceeding K. Such temperatures are already reached in the very first pulses of most of our model stars. The assumption of a complete conversion of into in the intershell layers is thus very good.

At exceeding K, on the other hand, Fig. 5 shows that the abundances predicted by the standard models are lower than that expected from the total conversion of the left over by the HBS. This is explained by the partial destruction of , which begins to burn by capture. The destruction factor, however, is less than 5% in all our stars, except in the 4 and stars where it respectively reaches 10 and 20% in the 24th pulse (with and K, respectively). Such a destruction does not have significant implication on the predictions for the star, though, and is neglected in the synthetic and analytical calculations presented in Sect. 4. The case of the star, on the other hand, is discussed in Sect. 5.
4 Sodium abundance predictions in models with dredge-up
In this section, the production of sodium is analyzed in those AGB stars which do not experience HBB. The case of stars experiencing HBB is considered in Sect. 5.
4.1 Synthetic calculations: the method
| =0.018 | =0.020 | =0.018 | =0.018 | =0.008 | =0.004 | |
|---|---|---|---|---|---|---|
| 1.785e-3 (0.21) | 2.013e-3 (0.20) | 1.820e-3 (0.20) | 2.052e-3 (0.15) | 7.714e-4 (0.22) | 3.660e-4 (0.24) | |
| 2.661e-3 (0.40) | 2.823e-3 (0.38) | 2.421e-3 (0.36) | 1.947e-3 (0.27) | 1.166e-3 (0.40) | 6.181e-4 (0.42) | |
| 8.632e-3 (0.02) | 9.699e-3 (0.02) | 8.849e-3 (0.01) | 9.100e-3 (0.00) | 3.882e-3 (0.02) | 1.926e-3 (0.02) | |
| CNO | 1.308e-2 (0.00) | 1.454e-2 (0.00) | 1.309e-2 (0.00) | 1.310e-2 (0.00) | 5.819e-3 (0.00) | 2.910e-3 (0.00) |
| 1.071e-4 (0.06) | 1.212e-4 (0.05) | 1.105e-4 (0.05) | 1.216e-4 (0.01) | 4.760e-5 (0.06) | 2.311e-5 (0.08) | |
| 4.883e-5 (0.19) | 5.200e-5 (0.17) | 4.536e-5 (0.16) | 3.370e-5 (0.03) | 2.171e-5 (0.19) | 1.156e-5 (0.22) |
In order to predict the surface abundance evolution of , and in our model stars, we have to use ‘synthetic’ calculations since standard models cannot reproduce consistently the 3DUP phenomenon (Sect. 3.1). In such synthetic calculations, the chemical evolution of a star is computed by estimating a posteriori the effects of successive 3DUP episodes on the intershell and surface abundances. In doing so, we assume that the overall structural evolution of the model stars is not affected by the operation of those 3DUPs. The evolution, as a function of pulse number, of the mass of the envelope (Fig. 10 of MM99), of the masses , and of zones A, B and D, respectively (Fig. 8 of MM99), and of the mass fraction of emerging from each pulse (Fig. 4), are thus taken from the standard stellar model predictions. The chemical evolution of the intershell layers and of the envelope are then computed by considering their abundance changes during each interpulse/pulse/afterpulse phases.
Let us consider pulse . The abundances of and available in zone B ( and , respectively) are determined by the nucleosynthesis occurring in the HBS during the preceding interpulse . We assume that all available and are converted in the HBS into through the CNO cycles, and that all available is burned into by the NeNa chain. The destruction of by p-captures (at K) is taken into account by a destruction factor as defined in Appendix A. Its value is determined in that Appendix as a function of temperature at which H burns, taken here to be the temperature of the HBS predicted by the standard model predictions (Fig. 5). The slight contribution from burning, on the other hand, is neglected since is not produced in the intershell layers. This assumption imposes a maximum value of . We then have
| (1) |
| (2) |
where , and are respectively the abundances of , and in the envelope during interpulse .
During pulse , we assume that all available in zone B is transformed into . In doing so, we neglect the fact that the transformation is incomplete in the coolest first pulses of some model stars. We further assume that the amount of burned in the hottest pulses of our stars is negligible (see Sect. 3.4). Knowing that sodium remains unaffected by He-burning in the pulse, the abundances of and emerging in zone D are respectively given by
| (3) |
| (4) |
The 3DUP process during afterpulse then mixes part of the material of zone D into the envelope. The mass of material dredged-up from zone D is usually expressed relative to the core mass increase during the preceding interpulse by the ‘dredge-up efficiency’ parameter . A value of , for example, means that the amount of mass dredged-up is equal to the amount of H-rich material burned during the interpulse (the core mass would then remain constant from one pulse to the next). Since , the surface abundance of, for example, after dredge-up is given by
| (5) |
Similar relations hold for the surface abundances of and .
Dredge-up is assumed to operate from the 5th pulse on in all the stars, and Eqs. (1) to (5) are solved pulse after pulse for the abundances in zones B, D and in the envelope. , , and are taken from the standard AGB model predictions. We still need to specify the surface abundances at the onset of the thermally pulsing AGB (TP-AGB) phase and the dredge-up efficiency. The abundances at the onset of the TP-AGB phase are taken from the standard model predictions as summarized in Table 3. The dredge-up efficiency, on the other hand, is a function of stellar mass, metallicity and pulse number. Its value however is still a matter of research. Fortunately, the exact value of is not crucial for our purpose, as long as the surface abundance is expressed as a function of the surface (or C+N+O) abundance (see Sect. 4.3). For simplicity, we thus take .
4.2 Sodium abundance predictions

The surface abundance evolution predicted by the synthetic calculations outlined in Sect. 4.1 are shown in Fig. 6 as a function of the surface abundance (each mark in the figure locates a pulse). The carbon abundance is seen to increase steadily with pulse number, as expected from the operation of the 3DUP episodes. The sodium abundance, on the other hand, remains unaffected during the first pulses, but steadily increases at more advanced pulses.
We can roughly estimate the increase in the surface abundance () expected to result from given CNO abundances in the envelope. As explained in Sect. 2.2, the process of surface enhancement from the envelope’s CNO abundances requires two consecutive 3DUPs, one to dredge-up synthesized in the H+HeBS from the CNO elements, and one to dredge-up synthesized from during the following interpulse. At first guess, the resulting increase in the surface sodium abundance would thus be
| (6) |
where is the dilution factor suffered by the C-rich material dredged-up in the envelope, the destruction factor (Sect. 4.1), and
| (7) |
is the equivalent mass fraction of the CNO abundances in the envelope (i.e. the mass fraction which would result from the total transformation of the CNO elements into ). , and are respectively the surface mass fractions of , and . Taking, for example, , and solar CNO abundances, one gets . This is 60 times lower than the solar sodium abundance, so that no significant enhancement in the surface abundance would be predicted. This conclusion holds true at all metallicities if we assume an initial solar distribution of the elements heavier than helium.
The process of production in the envelope is, however, non linear, and Eq. (6) becomes invalid after the operation of few 3DUPs. This results from the fact that builds up in the envelope dredge-up after dredge-up. Since is the seed nucleus for the production of , the surface abundance would depend quadratically on the surface abundance (a constant would lead to a linear increase of with pulse number). If we further take into account the increase in the envelope’s carbon mass fraction pulse after pulse due to the dredge-up of primary , then becomes roughly proportional to (see Appendix B). This explains the rapid increase of the surface abundance as the surface carbon abundance increases.
Figure 6 further reveals that the surface sodium abundance enhancements are higher in stars with lower metallicities. This is due to the primary nature of dredged-up to the surface. Actually, the [][] predictions become independent of metallicity after the operation of a sufficient number of 3DUPs. For example, the surface mass fraction of reaches after about 25 3DUPs in the stars regardless of their metallicity (Fig. 6).
4.3 Discussion

It is possible to further study the production of in AGB stars analytically if we assume the constancy of the following four parameters: the intershell mass fraction dredged-up to the surface during each 3DUP episode, the dilution fraction suffered by the C-rich material when dredged-up from the intershell layers into the envelope, the dilution factor suffered by the ashes of HBS ( in particular) when mixed from zone of the intershell layers into the pulse, and the destruction factor of by p-captures. The analytical derivation is performed in Appendix B. It enables, in particular, to disentangle the effects of each of the four parameters, to analyze the influence of metallicity (Sect. 4.4) and stellar mass (Sect. 4.5) on the sodium predictions, and to estimate the uncertainties affecting those predictions (Sect. 4.6).
The two main conclusions of the analytical study performed in Appendix B are:
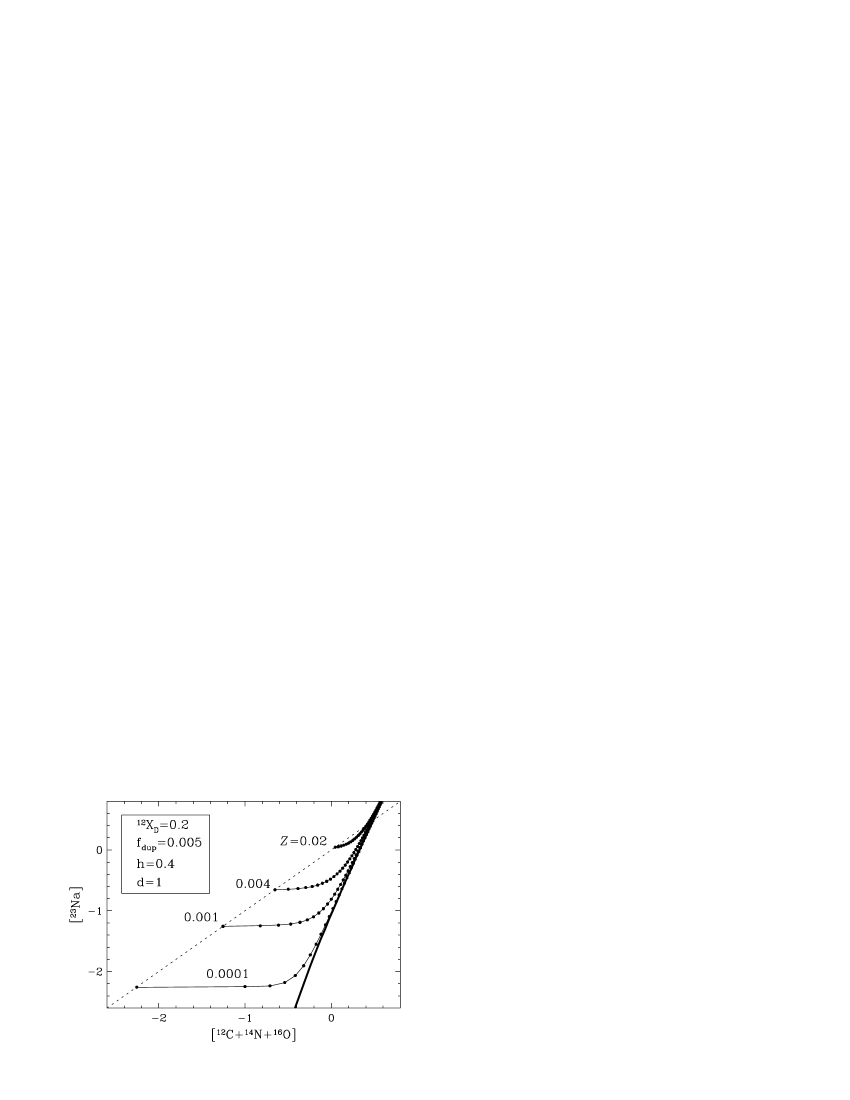
a) primary production in zero metallicity stars555 The evolution of stars might qualitatively be quite different than that of stars. However, the only requirement for our sodium production scenario to work is the occurrence of 3DUPs which bring primary carbon into the envelope. And model predictions confirm the existence of thermal instabilities in the He-burning shell of AGB stars – and thus most probably of 3DUP events – at metallicities down to =0 for (Fujimoto et al. Fujimoto_etal84 (1984)). In any case, the LOPSE could very well be defined by the asymptotic evolution of in a very low (non zero) metallicity star. follows a specific track in the [C+N+O][] diagram (with [C+N+O]=[]), given by Eq. (18) in the Appendix and represented by a long-dashed line in Fig. 7. It is called the line of primary sodium enrichment (LOPSE), and is, to first order, a straight line of slope 3 [cf. Eq. (19) in the Appendix];
b) in non-zero metallicity stars, the surface abundance is given by Eq. (Appendix B: Analytical study of the surface abundance evolution in AGB stars) in the Appendix. is predicted to keep constant during the first 3DUPs until the abundance of primary produced by the star (and given by the LOPSE) reaches a level comparable to the initial surface abundance. It then increases steadily, and approaches the LOPSE asymptotically.
The evolutionary tracks predicted at and in the [C+N+O][] diagram by Eq. (Appendix B: Analytical study of the surface abundance evolution in AGB stars) of the Appendix, for example, are shown by the two unmarked solid lines in Fig. 7. Those analytical predictions are in good agreement with the evolution predicted by the synthetic calculations. For comparison, the synthetic predictions for the stars at , 0.008 and 0.018 are also drawn in Fig. 7 (symbol-marked solid lines);
Appendix B further analyses the sensitivity of the analytical abundance predictions to , , and . The value of predicted by our standard models has been analyzed in Sect. 3.4. It reaches a maximum value of 25-30% (depending on the initial stellar mass) after a dozen of pulses, and asymptotically decreases thereafter to a ‘canonical’ value of (Fig. 4). This value is the one adopted in the curves at and displayed in Fig. 7. The analysis of Appendix B reveals a strong sensitivity of the LOPSE on , though. This results from a dependence of on the square of [cf. Eq. (19) in the Appendix]. Increasing by a factor of two, from 0.2 to 0.4 for example, decreases predicted by the LOPSE at a given surface C+N+O abundance by a factor of about four (0.6 dex; Fig. 14a of Appendix B). Fortunately, the value of after a dozen of pulses is rather well constraint according to standard stellar models, lying between 0.20 and 0.24. Furthermore, the value of is rather independent of metallicity (Sect. 3.4). Assuming a constant value for that parameter is thus a good enough assumption for our purposes. Future evolutionary AGB model calculations consistently reproducing the 3DUP processes should lead to more refined predictions.

The second parameter is the dredge-up dilution factor . Appendix B reveals that predictions are not very sensitive to . To first order, the LOPSE is even independent on that parameter [Eq. (19) in the Appendix]. This independence of on is welcomed since the dredge-up efficiency as a function of mass and metallicity is still a matter of research. We choose a ‘canonical’ value . This value corresponds to that predicted by the standard models if we assume a dredge-up efficiency of , as shown in Fig. 8a.
The third parameter is dilution factor of H-burning ashes into pulses. Standard AGB models predict a continuous increase of that parameter along the AGB, from 0.05 to 0.50-0.60 as reported in Fig. 8b. We use a ‘canonical’ value of . The analysis developed in Appendix B, however, reveals a linear dependence of to on the LOPSE [Eq. (19) in the Appendix]. As a result, an increase of from 0.2 to 0.4, for example, would result in an increase of by a factor of two at a given . Giving a realistic range 0.20-0.60 for in AGB models, the error on due to thus amounts to a factor of three.
The last parameter is the destruction factor . With the nuclear reaction rates used in the standard model calculations, drops below 1 only for K (cf. Appendix A). Because is predicted to be lower than that value in most of our standard model stars (Fig. 5), we adopt a ‘canonical’ value of 1. Since depends linearly on , the error introduced by using is of a factor of three (see, however, Sect. 4.6).
The analytical equation (Appendix B: Analytical study of the surface abundance evolution in AGB stars) of the Appendix thus offers a powerful tool to analyze the production of primary in AGB stars. The main qualitative difference between [C+N+O][] predictions from the analytically-derived relation (Appendix B: Analytical study of the surface abundance evolution in AGB stars in Appendix B and those from the synthetic calculations presented in Sect. 4.2 (and which take into account the full stellar characteristics as predicted by standard AGB models pulse after pulse) is the initial abundance at the onset of the TP-AGB phase (see Fig. 7). The analytical calculations begin with an initial solar abundance scaled to the metallicity (dotted line in Fig. 7), while the synthetic calculations take into account the abundance enhancements resulting from first and second dredge-ups. The increase in due to first dredge-up is, however, less than 0.3 dex in the stars of interest (cf. Table 2). Its contribution becomes meaningless when the star reaches the LOPSE, i.e. when primary dominates sodium production.
4.4 Sodium production as a function of metallicity
Figure 7 shows that the increase in the surface C+N+O abundance required to reach the LOPSE is greater in lower metallicity stars. At solar metallicity, for example, the surface C+N+O abundance must increase by less than 0.4 dex before it reaches the LOPSE, while 1.2 dex are required at , and 1.9 dex at . Yet, metal-poor stars are expected to be more efficient in producing primary than solar-metallicity stars. This results from the fact that the initial surface C+N+O abundance is proportional to the metallicity (the CNO elements represent 72% of the metallicity), while the primary mass fraction produced in the HeBS is independent of metallicity (Fig. 4). As a result, the relative increase of the surface abundance is higher in metal-poor stars. We can easily estimate the number of 3DUPs necessary to increase the surface C+N+O abundance by a factor of, let us say, . Let us assume for simplicity that the dredge-up dilution factor is constant from one pulse to the next. We then have
| (8) |
For example, the number of 3DUPs necessary to increase by a factor of three (i.e. by 0.5 dex) is, assuming and ,
This corresponds to 18 dredge-ups in a solar metallicity star, 8 at , and only one at . The efficiency of surface C enrichment thus increases very rapidly with decreasing metallicity. Low-metallicity stars should thus be good candidates for the production of primary .
At , for example, the number of 3DUPs required for to reach the LOPSE (i.e. to increase by 1.9 dex) is expected to be 4 according to Eq. (8). Of course, Eq. (8) only provides an order of estimate, and those predictions should be confirmed by future evolutionary AGB models consistently reproducing the 3DUPs. In particular, the dependence law of the dredge-up efficiency on mass, metallicity and pulse number is of crucial importance in determining the number of pulses required to reach the LOPSE. According to current estimations the dredge-up efficiency is expected to increase with decreasing metallicity. This strengthens our conclusion that low-metallicity stars should be efficient sites for the production of primary .
4.5 Sodium production as a function of stellar mass
The synthetic calculations presented in Sect. 4.2 reveal a dependence of the sodium abundances on the stellar mass. Figure 6 indeed shows that begins to increase at a lower C+N+O abundance in more massive stars. In other words, production would be favored in more massive AGB stars.
Why such a trend in the synthetic predictions? The analytical study performed in Appendix B again offers the necessary tool to answer that question. What actually happens is that in a massive AGB star, the low dilution factor ( being high) leads to a slow increase of the surface abundance with pulse number. It takes then many 3DUP episodes for the surface C+N+O abundance to reach the LOPSE. By that time, the factor has already increased to a high value according to standard model predictions (Fig. 8b), leading to higher abundances. In a low-mass AGB star, on the contrary, the high dilution factors lead to a rapid increase in the surface abundance with pulse number. As a result, is still low when the surface C+N+O abundance reaches the LOPSE, leading to lower values at a given C+N+O surface abundance.
The predictions thus also depend on the time at which 3DUP becomes efficient on the TP-AGB (thereby determining ), i.e. on the history of the 3DUP efficiency. In the synthetic calculations presented in Sect. 4.1, it is assumed that 3DUP begins to operate at the 5th pulse irrespective of the stellar mass and metallicity, and that its efficiency is equal to for all subsequent pulses. In reality, the dredge-up efficiency is expected to vary with stellar mass, metallicity, pulse number and mass loss rate. The lack of reliable predictions, at the present time, for the 3DUP efficiency as a function of pulse number thus introduces an additional source of uncertainty on the quantitative prediction of .
4.6 Uncertainties on the abundance predictions
The quantitative prediction of primary production in AGB stars has been shown in Sects. 4.3 and 4.5 to depend sensitively on the abundance produced in the HeBS, on the intershell structural parameter , and on the nuclear destruction factor .
In our standard AGB models, the intershell abundance reaches the asymptotic value of 0.20-0.24 after a sufficient number of pulses (Sect. 3.4). ‘Non standard’ input physics, however, may lead to a different conclusion. Herwig et al. (Herwig_etal97 (1997)), for example, obtain when applying extra-mixing (overshooting) at the borders of the convective pulses. Since the amount of overshooting at the convective pulse borders is certainly not yet established, we have to consider to be known to only a factor of 2.5. Moreover, an additional source of discomfort in the quantitative prediction of results from the uncertainty affecting the nuclear reaction rate of (see Arnould et al. Arnould_etal99 (1999)). The role of is all the more important since the primary abundance predicted by the LOPSE depends on the square of . If we thus take a global uncertainty factor of about three on due to convection and nuclear reaction rates, then the sodium abundance predicted at a given C+N+O surface abundance is reliable only to a factor of about 10.
The uncertainties on , on the other hand, have been shown in Sect. 4.3 to lead to an uncertainty factor on of about 3.
Finally, the uncertainty on has been shown in Sect. 4.3 to lead to an uncertainty on of a factor of 3. The new NACRE compilation, however, predict much higher destruction rates than before (Sect. 3.3). But the very large uncertainties still affecting the p-capture rates on prevent from giving a definite conclusion about their impact on predictions. A destruction factor of ‘only’ 3, for example, is still within the NACRE uncertainties. We thus adopt this optimistic value, keeping however in mind a possible higher destruction factor due to nuclear reaction rates.
All together, then, the present uncertainty affecting predictions at a given surface C+N+O abundance amounts to two orders of magnitude.
4.7 Summary
Both the predictions of synthetic AGB calculations presented in Sect. 4.2 and the analytic considerations of Sect. 4.3 do support the scenario described in Sect. 2.2 for the production of primary sodium in AGB stars. The evolution of the surface abundance obeys a well defined pattern as a function of the surface C+N+O abundance, given by Eq. (Appendix B: Analytical study of the surface abundance evolution in AGB stars) in Appendix B and shown in Fig. 7 for several metallicities.
All AGB stars are thus potential sites for the production of primary . For such a production to be efficient, a sufficient number of 3DUPs must occur in order to increase the surface C+N+O abundance to the level required by the LOPSE (dashed line in Fig. 7) at the given initial . The amount of primary sodium produced in a given AGB star thus depends on the number of 3DUP episodes experienced by that star. Since the dredge-up efficiency increases with decreasing metallicity, low-metallicity stars are expected to be more efficient in producing primary . This conclusion is furthermore strengthened by the fact that the relative increase in the surface carbon abundance during a 3DUP episode is higher in low than in high metallicity stars.
The uncertainties affecting both synthetic and analytic predictions of are, however, still very large at present time (two orders of magnitude). In particular, the uncertainties affecting the burning reaction rates is of great concern. Eventual observation of overabundance in AGB stars and related objects would provide a definite proof of the feasibility of our scenario for the production of primary . This question is briefly addressed in Sect. 6. Before doing that, however, the case of massive AGB stars experiencing HBB is discussed in the next section.
5 Sodium production by hot bottom burning
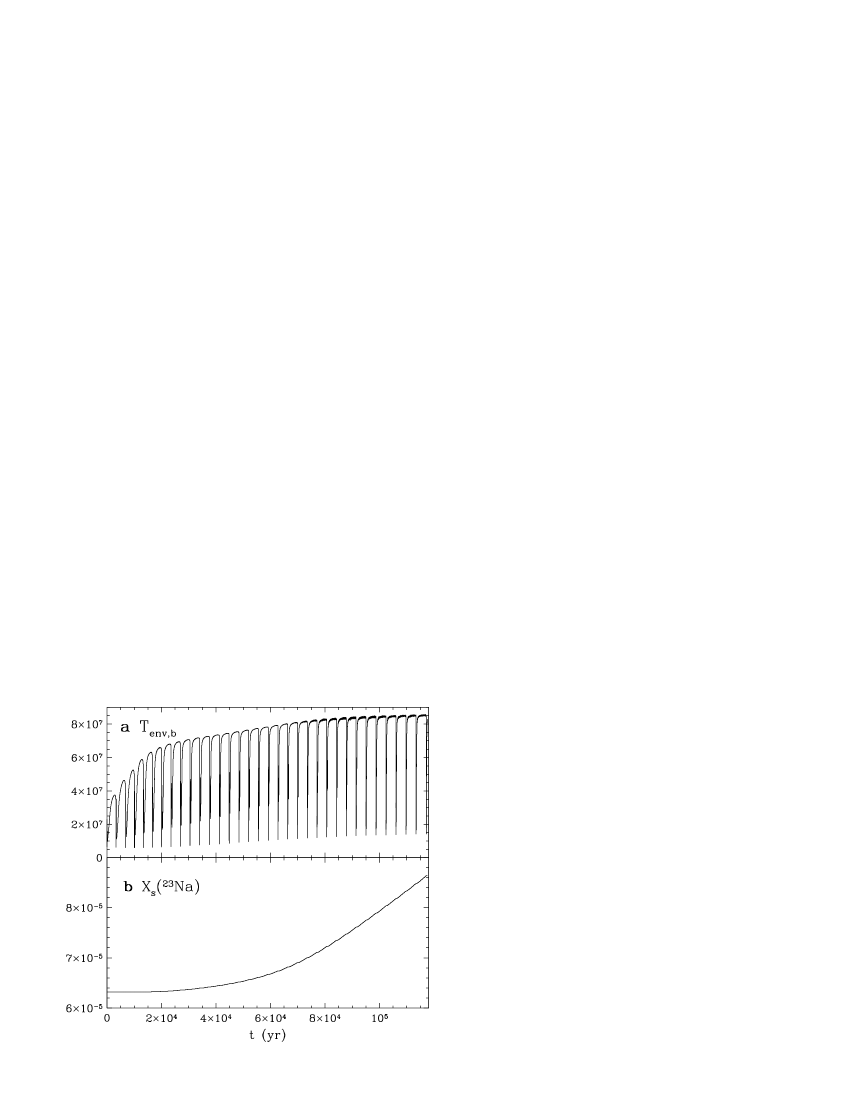
In massive AGB stars ( at =0.02), the temperature at the base of the envelope may reach high enough values for H-burning to operate in the envelope. This process, called HBB, alters the surface abundances of H-burning nuclei without the need to invoke any dredge-up process. In particular, the activation of the NeNa chain of H-burning naturally leads to the production of when the temperature at the base of the envelope exceeds K.
5.1 Secondary sodium
In the absence of any 3DUP event, secondary sodium can be synthesized by HBB from the initial present in the envelope. The evolution of the temperature at the base of the envelope of the , standard model star, for example, and of its surface abundance are shown in Fig. 9 during the first 30 pulses. The production of secondary sodium is seen to become efficient when the base temperature increases above K. The increase in the surface abundance is steady, eventhough not very rapid (30% increase over about 25 pulses).
5.2 Primary sodium
In the presence of 3DUPs, the increase in the surface abundance through HBB may be considerably higher due to the dredge-up of primary . In such a scenario, only one dredge-up/interpulse/pulse/dredge-up event is required to dredge-up and process it to , the conversion of to being subsequently performed in the envelope. The fact that the dredge-up efficiency increases with stellar mass renders this scenario very attractive. Several important points must however be considered.
First, the standard models reveal a destruction of the intershell by -capture at the He-burning shell temperatures characterizing massive AGB stars (Sect. 3.4). In the model star, the destruction factor amounts to 20% at the 24th pulse (Fig. 5). Let us, however, neglect this destruction factor for now.
Second, the dilution factor of the -rich material mixed from the intershell layers into the envelope is predicted by standard models to be only 0.0002, much smaller than in lower mass stars (, 0.003, 0.005 and 0.01 in the 4, 3, 2.5 and model stars, respectively, see Fig. 8). As a result, the surface mass fraction is not expected to increase very rapidly as a result of 3DUP episodes in massive AGB stars. For example, a synthetic calculation of the surface abundance evolution in the model star, performed with the recipe outlined in Sect. 4.1, predicts only 20% increase in the surface abundance after 24 pulses. The synthesis of primary sodium by 3DUP + HBB may thus not be very efficient. A more positive conclusion may however be obtained in low-metallicity stars, where the low initial abundance renders the relative contribution of the intershell to the envelope’s abundance more important.
Third, synthesizing primary sodium in the intershell layers of massive AGB stars by two successive dredge-up/interpulse/pulse sequences, in a similar way as in lower mass stars, is not efficient either. The temperatures in the H-burning shell of those massive AGB stars indeed exceed K according to the predictions from the model star (cf. Fig. 5), and lead to the destruction of by p-capture in the HBS. At the end of the 23rd interpulse of the model star, for example, the intershell abundance is 30% lower than its surface abundance.
Finally, we have to consider the effects of mass loss which characterizes AGB stars. It reduces the mass of the envelope, thereby decreasing the temperature at its base, and eventually switching HBB off. After how many interpulses is HBB switched off, however, depends on the still uncertain mass loss rates suffered by those stars.
The production of primary sodium by HBB seems thus not favored in massive AGB stars. There are however still too many uncertainties, such as those concerning the dredge-up efficiency or mass loss rates, to allow a definite conclusion to be drawn.
6 Observations
The primary sodium, if produced efficiently in AGB stars, should reveal its imprint in the abundances at the surface of AGB and post-AGB stars. According to the analysis of Sect. 4, sodium could be produced in AGB stars of nearly solar metallicity when their abundance has increased by at least 0.7 dex (Fig. 6). This would correspond to stars displaying C/O ratios above 2. Unfortunately, the number of known such objects is low, due to the fact that those AGB stars are usually enshrouded into a circumstellar dust which obscures the central AGB star. To my knowledge, no sodium abundance has so far been measured in those objects.
The analysis of post-AGB stars seems more promising. Those objects are expected to display the abundance patterns characterizing AGB stars at the end of their life, and in particular high C+N+O abundances if 3DUP occurred during their AGB phase. Spectroscopic analysis of some of those objects has been performed during the last decade (e.g., Parthasarathy et al. Parthasarathy_etal92 (1992), Gonzalez & Wallerstein Gonzalez_Wallerstein92 (1992), Zac̆s et al. Zacs_etal96 (1996), Van Winckel et al. VanWinckel_etal96 (1996), Decin et al. Decin_etal98 (1998)). In particular, Gonzalez & Wallerstein (Gonzalez_Wallerstein92 (1992)) analyze the chemical composition of a post-AGB star, ROA 24, belonging to the globular cluster Cen. They find significant overabundances of C, N, O, and s-process elements compared to the abundances measured in other giants in Cen. The fact that the s-process elements are enhanced is a very strong indication of the post-AGB nature of that star. Very interestingly, they also find a significant overabundance of Na in that object relative to the abundance in other giants of Cen. This would be the first observational evidence of primary production in AGB stars. A more thorough analysis of that case and of other post-AGB stars is outside the scope of this article, though, and is the object of a separate study (Mowlavi & Van Winckel, in preparation).
7 Conclusions
The main conclusion of this paper is that AGB stars are potential sites for the production of primary sodium. For the scenario presented in Sect. 2 to be efficient, however, a certain level of surface C+N+O abundance must be reached by the operation of sufficient number of 3DUP events (Sect. 4).
The surface abundance evolution can be predicted as a function of the surface C+N+O abundance by the analytical relation (Appendix B: Analytical study of the surface abundance evolution in AGB stars) presented in Appendix B, with ‘recommended’ values of , , and . The values of , and are suggested from standard AGB model predictions, while the value of is suggested after the study of Mowlavi (Mowlavi99 (1999)). The abundance predictions are sensitive to , and , but not much on as long as is expressed as a function of the C+N+O abundance.
An important result of the analytical study is the prediction of a LOPSE in the [C+N+O][] diagram, which provides the abundance evolution in zero metallicity stars as a function of their surface C+N+O abundance. The surface abundance in non-zero metallicity stars, on the other hand, is shown to evolve asymptotically towards the LOPSE.
Hot bottom burning in massive AGB stars may further help the production of by synthesizing it directly in the envelope. In that case, only one dredge-up/interpulse/pulse/dredge-up sequence is necessary to synthesize and dredge-up primary , followed by its burning into in the envelope. The analysis presented in Sect. 5, however, suggests that such primary sodium production may not be very efficient in those stars, at least at solar metallicity. Low metallicity stars may be better candidates for producing sodium through 3DUP + HBB.
The uncertainty on the primary abundance prediction at a given C+N+O abundance is presently of two orders of magnitude, even with synthetic AGB calculations. This poor prediction partly results from our still poor quantitative knowledge of the 3DUP efficiency as a function of stellar mass, metallicity and pulse number, since the values of and vary with pulse number in a given star, and partly from the uncertainties affecting the p-capture rates on . Future AGB model predictions consistently reproducing the 3DUPs, and combined with improved reaction rates, would hopefully enable to provide a better quantitative prediction of sodium production in low- and intermediate-mass stars.
Meanwhile, we can search for an observational evidence for this sodium production scenario in carbon stars and related objects. Such an evidence may already have been reported in at least one post-AGB star in the globular cluster Cen (cf. Sect. 6). Further determinations of sodium abundance in those objects and, if possible, in planetary nebulae are eagerly called for.
Finally, let me note that the efficient production of primary sodium in AGB stars, if confirmed by observations, would imply a non negligible role of those objects in the chemical evolution of galaxies in general, and of our Galaxy in particular.
Appendix A: The CNO and Ne-Na modes of hydrogen burning
The CNO cycles

The CNO modes of hydrogen burning are well known and documented in the literature (see, e.g., Arnould et al. Arnould_etal95 (1995)). We only summarize here their main features in relation with the production in AGB stars. The rates of the CNO reactions adopted in the standard model calculations are the same as in Mowlavi (Mowlavi95 (1995)), except for and whose rates are taken from Blackmon et al. (Blackmon_etal95 (1995)).
The CNO yields obtained at hydrogen exhaustion in one-zone nucleosynthesis calculations with the temperature assumed constant during the burning are displayed in Fig. 10 as a function of temperature. As is well known, essentially all CNO elements are transformed into . However, , and are still present at H exhaustion at the level of few percents of the mass fraction. At temperatures K characterizing H-burning in AGB stars, the mass fraction of (which is the most abundant of the CNO elements after , see Fig. 10) increases with temperature. Concomitantly, the mass fraction at H exhaustion decreases slightly with temperature (few percents from 40 to over K). This property is used in Sect. 3.4 to analyze the production in AGB stars.
The NeNa chain
The reactions involved in the NeNa chain of hydrogen burning are shown in Fig. 11. The rates of p captures on , , and are taken from El Eid & Champagne (ElEid_Champagne95 (1995)).
The NeNa yields at hydrogen exhaustion are displayed in Fig. 12a (solid lines). The main features concerning production are the following (see Arnould et al. Arnould_etal95 (1995) for more details):
- is entirely transformed into at temperatures as low as K. Consequently, the ratio , where designates the initial (here solar) abundance, is equal to one up to K (solid line in Fig. 12b).
- an extra production of is predicted at temperatures exceeding K, reaching % at K (Fig. 12b). This extra production results from the slight burning of the abundant ;
- begins to burn by proton capture at K, with at K.
It is interesting to further note that the El Eid & Champagne (ElEid_Champagne95 (1995)) predict reaction rates always faster than those of , which ensures that the NeNa chain is a cycle.


The impact of the new NACRE reaction rates on the NeNa yields is shown by the dotted lines in Fig. 12. The destruction by p-capture is seen to be much more important with NACRE than with the El Eid & Champagne reaction rates above K leading to about three times less abundances at temperatures above K. Yet, the abundance at hydrogen exhaustion does not decrease below its initial abundance at all temperatures of relevance for our study (i.e. for K, see Fig. 12b). Arnould et al. (Arnould_etal99 (1999)) further note that the cycling character of the NeNa chain is put into question with the new NACRE rates, but still depends on the large uncertainties affecting the p-capture rates on .
It must be stressed that the large uncertainties affecting those p-capture rates render the yields from the NeNa chain highly uncertain. Adopting the most favorable NACRE rates, Arnould et al. (Arnould_etal99 (1999)) show, for example, that the mass fraction at H exhaustion can still be at K, i.e. similar to the results obtained with the El Eid & Champagne rates.
Appendix B: Analytical study of the surface abundance evolution in AGB stars
In order to analytically derive the evolution of the surface abundance as a function of the surface C+N+O abundance, we make the following simplifying assumptions:
(a) the intershell mass fraction left over by the pulses is constant from one pulse to the next;
(b) the dilution factor suffered by the intershell nuclei when dredged-up into the envelope during a 3DUP episode is constant from one 3DUP to the next;
(c) the dilution factor suffered by the intershell when injected from zone (Fig. 1) into the next pulse is constant from one pulse to the next;
(d) all and are transformed into in the CNO cycles, and all into in the NeNa chain. The extra-production of from is neglected, and the destruction by p-capture is taken into account through the parameter , where designates the initial abundance. The parameter is assumed constant from one pulse to the next. A value of means no destruction, while a destruction of by p-captures leads to ;
(e) the intershell is assumed to be entirely transformed into in the pulses. The destruction by -capture in the hottest pulses is neglected (cf. Sect. 4.1).
The validity of assumptions (a)-(d) is discussed in Sect. 4.3, and that of (e) in Sect. 3.4. The sensitivity of the abundance predictions to , , and , on the other hand, is analyzed at the end of this Appendix.
Let us denote the surface mass fractions of , , , and by and , respectively (i.e. , … , ). Let us further denote by the total abundance of the CNO elements in the envelope (cf. Sect. 4.2). The evolution of the surface , and mass fractions, which are dictated by the 3DUP episodes, are respectively given by
| (9) | |||||
| (10) | |||||
| (11) |
where the indice () refers to the abundances during interpulse (), and and are respectively the intershell abundances of and in zone after pulse . can be evaluated by recalling that the intershell abundance results from the transformation of the CNO elements into in the HBS, followed by the mixing of into the next pulse with a dilution factor , followed by its transformation in the pulse into by two -capture reactions. We thus have
with . Equation (10) then becomes
| (12) |
We note that the evolution of is dictated by that of the surface carbon abundance, since the surface nitrogen and oxygen abundances are not affected by the 3DUP episodes666 Actually oxygen is also produced in the pulses by . However, its mass fraction in the intershell layers is predicted by our standard models to be about 20 times less than the intershell mass fraction. For this reason, we neglect in this analytical study its contribution to the surface CNO abundance evolution.. We thus have
| (13) |
with given by Eq. (9), and and being respectively the surface mass fractions of nitrogen and oxygen at the onset of the TP-AGB phase.
The intershell abundance of , on the other hand, results from the conversion of into by p-capture operating in the HBS. Since is not destroyed in the pulses, we have777In reality, of course, we have . For simplicity in the analytical derivations, however, we neglect the contribution of compared to that of . This approximation leads to a slight underestimation of .
and Eq. (11) becomes
| (14) |
Equations (9), (12), (13) and (14) constitute a system of recursive equations in the variables (or ), and . It can be solved rather simply as a function of pulse number . Knowing that
and
the solution to Eqs. (9), (12)-(14) is
where , , and are the surface abundances at the onset of the TP-AGB phase.
An analytical relation for the surface abundance as a function of that of C+N+O can now easily be obtained by eliminating the variable between Eqs. (Appendix B: Analytical study of the surface abundance evolution in AGB stars) for and . We have, however, to be cautious that two consecutive pulses are necessary before can build up from the envelope s CNO elements. We thus take the surface abundances , , and at the second pulse as initial conditions in Eqs. (Appendix B: Analytical study of the surface abundance evolution in AGB stars) instead of the surface abundances at the onset of the TP-AGB phase [replace , , , respectively by , , , in Eqs. (Appendix B: Analytical study of the surface abundance evolution in AGB stars], and eliminate between the expressions for and so obtained. This leads to a relation between and valid from the second 3DUP on, i.e. for . The surface abundance after the first 3DUP (i.e. at ), on the other hand, is immediately obtained from Eqs. (Appendix B: Analytical study of the surface abundance evolution in AGB stars) by taking . The result is, after some elementary algebraic manipulations,
with [from Eqs. (13) and (Appendix B: Analytical study of the surface abundance evolution in AGB stars)]

Zero metallicity stars
Let us first consider the production in zero metallicity stars888See footnote 5 (i.e. the production of pure primary sodium). Putting in Eqs. (Appendix B: Analytical study of the surface abundance evolution in AGB stars) and (Appendix B: Analytical study of the surface abundance evolution in AGB stars), we get
| (18) | |||||
Equation (18) is shown in thick line in Fig. 13 for ‘canonical’ values of the parameters , , and (see Sect. 4.3). It represents the abundance of primary resulting from the sole contribution of the primary produced in the HeBS. It is therefore called the line of primary sodium enrichment (LOPSE).
The sensitivity of the LOPSE to the parameters , , and can be estimated from Eq. (18). Knowing that in most circumstances, we can neglect the terms in and in the right hand side of Eq. (18), and write to first order
| (19) |
Several important conclusions can immediately be drawn from Eq. (19):
1. the surface abundance increases as the third power of the surface abundance. In other words, the LOPSE is represented, to first order, by a straight line in the [C+N+O][] plane with a slope of 3 (thick solid line in Fig. 13);
2. the LOPSE is insensitive, to first order, to [that parameter does not appear in Eq. (19)]. In other words, primary abundance prediction as a function of primary abundance is insensitive to the dredge-up efficiency;
3. the value of predicted by the LOPSE is linearly proportional to , as expected since that parameter represents the ‘destruction’ factor of by p-capture;
4. the value of is also linearly proportional to the parameter at given surface abundance. Indeed, if the dilution of the intershell into the pulse is low (i.e. the dilution factor is high) then the abundance of emerging from the pulse is high, leading to higher production during the next interpulse. Thus, high factors imply high abundances at a given abundance, as expressed by Eq. (19);
5. the most influential parameter on the LOPSE is , which appears to the second power in Eq. (19). This results from the fact that the surface abundance increases linearly pulse after pulse, the increment being proportional to , while increases to the third power of the pulse number. The relation is such that increases with decreasing at a given surface abundance999The fact that decreases with increasing seems against intuition, since is synthesized from the intershell . What actually happens is that the surface , and thus [C+N+O], increases more rapidly with , shifting the tracks in the [C+N+O]–[Na] diagram to the right.
Non-zero metallicity stars
The evolution of at is dictated by Eqs. (Appendix B: Analytical study of the surface abundance evolution in AGB stars), and shown in thin solid lines in Fig. 13 for several metallicities (the initial abundances are scaled from solar to the required metallicity as represented by the dotted line in Fig. 13). The surface abundance stays constant until the surface C+N+O abundance reaches the LOPSE. This results from the fact that the abundance of primary produced during the first pulses (i.e. when the C+N+O abundance is still far below the value required by the LOPSE) is much lower than the initial . No variation of the surface abundance is thus expected. Only when the surface C+N+O abundance approaches the LOPSE does the increasing contribution of primary become competitive with . From then on, the surface abundance is mainly provided by the primary , and increases asymptotically towards the LOPSE. Those conclusions confirm the ones obtained from the synthetic predictions presented in Sect. 4.1.
Sensitivity to parameters
Sensitivity to
The sensitivity of predictions to is illustrated in Fig. 14a. As already discussed in the analysis of zero metallicity stars (see above), has a main influence on the location of the LOPSE. As a consequence, it affects directly the evolution of at all metallicities. The lines at different values are practically parallel to each other, the ones with the lowest predicting the highest surface abundances. At a given [C+N+O] value, the increase in [] on the LOPSE is twice the decrease in expressed in dex [ is inversely proportional to the square of in Eq. (19)].
Sensitivity to
Sensitivity to
The effect of on predictions is illustrated in Fig. 14c. The importance of that parameter results directly from the linear dependence of on on the LOPSE. At a given [C+N+O] value, the increase in [] on the LOPSE is equal to that of expressed in dex [ is linearly proportional to in Eq. (19)]. We further note that the value of [C+N+O] from which begins to increase is independent of , contrary to the case of (cf. Figs. 14a and c).
Sensitivity to
The effect of on is similar to the effect of , both of those parameters influencing linearly the LOPSE. Its effect is illustrated in Fig. 14d.
Acknowledgments. I thank Dr. Hans Van Winckel for his careful reading and commenting on the manuscript and Dr. G. Meynet for many useful discussions.
References
- (1) Anders E., Grevesse N., 1989, Geochim. Cosmochim. Acta 53, 197
- (2) Arnould M., Mowlavi N., Champagne A., 1995, in: Noels A., Fraipont-Caro D., Gabriel M., et al. (eds) Stellar Evolution: What Should Be Done (Proc. 32nd Liège Intern. Astrophys. Coll.), Institut d’Astrophys., Liège, p. 17 101010 Postscript file available by anonymous ftp on obsftp.unige.ch in pub/mowlavi, or on the WWW at http://obswww.unige.ch/mowlavi/publications.
- (3) Arnould M., Goriely S., Jorissen A., 1999, A&A, in press
- (4) Blackmon J.C., Champagne A.E., Hofstee M.A., et al., 1995, Phys. Rev. Lett. 74, 2642
- (5) Decin L., Van Winckel H., Waelkens C., Bakker E.J., 1998, A&A 332, 928
- (6) El Eid M.F., Champagne A.E., 1995, ApJ 451, 298
- (7) Fujimoto M.Y., Iben I.Jr., Chieffi A., Tornambé A., 1984, ApJ 287, 749
- (8) Gonzalez G., Wallerstein G., 1992, MNRAS 254, 343
- (9) Herwig F., Blöcker T., Schoenberner D., El Eid M., 1997, A&A 324, L81
- (10) Mowlavi N., 1995, Ph. D. Thesis, Université Libre de Bruxelles
- (11) Mowlavi N., 1998, in: Chan K.L., Cheng K.S., Singh H.P. (eds) 1997 Pacific RIM Conference on Stellar Astrophysics, ASP Conf. Ser. 138, 249
- (12) Mowlavi N., 1999, A&A, 344, 617
- (13) Parthasarathy M., Garcia Lario P., Pottasch S.R., 1992, A&A 264, 159
- (14) Takeda Y., Takada-Hidai M., 1994, Publ. Astron. Soc. Japan 46, 395
- (15) Van Winckel H., Waelkens C., Waters L.B.F.M., 1996, A&A 306, L37
- (16) Zac̆s L., Klochkova V.G., Panchuk V.E., Spēlmanis R., 1996, MNRAS 282, 1171