A Keck Survey of Gravitational Lens Systems :
I. Spectroscopy of SBS 0909+532, HST 1411+5211, and CLASS B2319+051
Abstract
We present new results from a continuing Keck program to study gravitational lens systems. We have obtained redshifts for three lens systems, SBS 0909+532, HST 1411+5211, and CLASS B2319+051. For all of these systems, either the source or lens redshift (or both) has been previously unidentified. Our observations provide some of these missing redshifts. We find for SBS 0909+532; for HST 1411+5211, although the source redshift is still tentative; and for the two lensing galaxies in CLASS B2319+051. The background radio source in B2319+051 has not been detected optically; its redshift is, therefore, still unknown. We find that the spectral features of the central lensing galaxy in all three systems are typical of an early-type galaxy. The observed image splittings in SBS 0909+532 and HST 1411+5211 imply that the masses within the Einstein ring radii of the lensing galaxies are and , respectively. The resulting band mass-to-light ratio for HST 1411+5211 is , a factor of 5 times higher than the average early-type lensing galaxy. This large mass-to-light is almost certainly the result of the additional mass contribution from the cluster CL 3C295 at . For the lensing galaxy in SBS 0909+532, we measure where the large errors are the result of significant uncertainty in the galaxy luminosity. While we cannot measure directly the mass-to-light ratio of the lensing galaxy in B2319+051, we estimate that is between .
Accepted for publication in the Astronomical Journal
1 Introduction
Gravitational lensing has proven to be an invaluable astrophysical tool for constraining the cosmological parameters (Kundić et al. 1997a; Schechter et al. 1997; Lovell et al. 1998; Biggs et al. 1999; Fassnacht et al. 1999) and (Falco, Kochanek & Muñoz 1998; Helbig et al. 1999). In addition, a unique contribution of gravitational lensing to extragalactic astronomy lies in its capacity to measure directly the masses of the lensing objects. Consequently, it can be used to study galaxy structure and its evolution with redshift (e.g. Keeton, Kochanek & Falco 1998). The advent of high-spatial-resolution imaging with HST and faint-object spectroscopy with the Keck 10-m telescopes have opened new possibilities in the field (e.g. Kundić et al. 1997b,c; Fassnacht & Cohen 1998). Systems with compact configurations and faint components can now be studied, increasing the size and completeness of statistical samples of lenses. Specifically, a detailed study of a large number of gravitational lens systems can be used (1) to identify simple lens systems for the measurement of ; (2) to measure the mass-to-light of the lensing galaxies; (3) to compare the dark matter to the stellar light distribution of the lens galaxies; and (4) to probe the interstellar medium in the lensing galaxies. Nearly all of these goals depend critically on accurate redshift determinations for the background sources and the lensing galaxies.
In light of this, we have begun a coordinated program to use the Low Resolution Imaging Spectrograph (LRIS; Oke et al. 1995) on the Keck II telescope to measure spectroscopic redshifts for all lens systems where either the source or lens redshift is currently unavailable. We have drawn our sources from the sample of the CfA-Arizona Space Telescope Lens Survey of gravitational lenses (CASTLES). The CASTLES team has compiled a list of all known confirmed or candidate gravitational lens systems with angular separations smaller than . These systems were originally identified by a variety of methods and by many different groups. The specific goal of CASTLES is the construction of a complete three-band (, , and ) photometric survey of this sample. CASTLES uses existing Hubble Space Telescope (HST) images when available. Otherwise, they have supplemented the archival data with new WFPC2 and/or NICMOS imaging (see http://cfa-www.harvard.edu/castles).
In addition, we have pre-publication access to new gravitational lens candidates discovered in the Cosmic Lens All-Sky Survey (CLASS). The CLASS survey is being conducted at radio wavelengths with the VLA and consists of observations of 12,000 flat-spectrum radio sources to search for gravitational lens candidates. The first three phases of this survey have confirmed 12 new lenses and found 10 additional candidates (Myers et al. 1999). As part of the CLASS follow-up observations, many of these lenses have been imaged in two or three bands with HST (Jackson et al. 1998a,b; Koopmans et al. 1998, 1999; Sykes et al. 1998; Fassnacht et al. 1999; Xanthopoulos et al. 1999). At this time, eight of the 12 confirmed lenses from CLASS are included in CASTLES.
Earlier results from the first phases of this Keck survey have already been published (Kundić et al. 1997b,c; Fassnacht & Cohen 1998). In this paper, we present spectra of three lens systems with missing redshifts : SBS 0909+532, HST 1411+5211, and CLASS B2319+051. Unless otherwise noted, we use , , and .
2 Targets
Below we present some relevant information on the previous observations of the three lens systems which are the subject of this paper.
2.1 SBS 0909+532
SBS 0909+532 was first discovered as a quasar by Stepanyan et al. (1991) and later identified in the Hamburg-CfA Bright Quasar Survey (Engels et al. 1998). Kochanek, Falco & Schild (1995) believed that this quasar was a good candidate for gravitational lensing because of its redshift () and its bright optical magnitude (). Kochanek et al. (1997) first resolved this source into a close pair which was separated by and had a flux ratio of mag. These observations suggested that this system was indeed a gravitational lens. Oscoz et al. (1997) confirmed this hypothesis with spectra of the two components taken at the William Herschel Telescope (WHT). The spectra showed that components A and B were quasars at the same redshift and had identical spectra. Oscoz et al. (1997) also detected the Mg II doublet in absorption at the same redshift () in both components. They argued that these absorption features were associated with the photometrically unidentified lensing galaxy. Optical and infrared HST imaging indicate that the lensing galaxy has a large effective radius () and a correspondingly low surface brightness. It has a total magnitude of and a color of within an aperture of diameter 17 (Lehár et al. 1999). The large uncertainties are a result of the difficulty in subtracting the close pair of quasar images (see Figure 1 of Lehár et al. 1999). Our observations confirm that the lensing galaxy is at the same redshift as the Mg II absorbers.
2.2 HST 1411+5211
HST 1411+5211 is a quadruple lens that was discovered by Fischer, Schade & Barrientos (1998) in archival WFPC2 images taken of the cluster CL 3C294 (CL1409+5226) with the F702W filter. The maximum image separation is 228. The intensities of the four components are reasonably similar; the F702W AB magnitudes correspond to . The primary lensing galaxy is clearly observed in the HST images with a total magnitude of F702W(AB) . It has the appearance of a morphologically normal elliptical galaxy with a measured half-light radius of and an ellipticity of . The lensing galaxy is located only 520 (or kpc) from the center of the massive cluster CL 3C295 at (Butcher & Oemler 1978). Although this cluster was the subject of an extensive spectroscopic survey by Dressler & Gunn (1992), there is no measured redshift for the lensing galaxy (identified as galaxy #162 of Table 6 in Dressler & Gunn 1992); however, a photometric redshift of based on narrow-band imaging has been measured (Thimm et al. 1994). Fischer et al. (1998) argued that this photometric redshift was suspect. Firstly, the photometric redshift had the largest quoted uncertainty of all the observed galaxies (over two times larger than the average). Secondly, Thimm et al. (1994) classified this galaxy as an Scd based on their measurement of the spectral energy distribution. The high-angular-resolution HST imaging clearly indicates that this galaxy is an early-type, not a late-type, galaxy. In this paper, we convincingly show that the photometric redshift of Thimm et al. (1994) is incorrect.
2.3 CLASS B2319+051
B2319+051 is a doubly-imaged gravitational lens systems newly discovered by CLASS (Marlow et al. 1999). Radio images taken with the Very Large Array (VLA) and the Multiple-Element Radio-Linked Interferometer (MERLIN) show two compact components aligned in a N-S orientation with a separation of 136 and a flux density ratio of 5.7:1. High-resolution radio imaging with the Very Large Baseline Array (VLBA) resolve each component into two subcomponents with a separation of 0021 for A and 00075 for B. The orientation and morphology of this configuration is consistent with the lensing hypothesis. Images of this system taken with NICMOS do not show any infrared counterparts to the radio components; however, it does reveal two lensing galaxies (Marlow et al. 1999). G1 is a large, elliptical-like galaxy which is associated with the position of the two radio components; hence, it is the primary lensing galaxy. G2 is an extended, irregular galaxy which shows two clear emission peaks (G2a and G2b) and is separated from G1 by G1–G2b 3516 (see Figure 9 of Marlow et al. 1999). This galaxy is the source of an external shear as modeled by Marlow et al. (1999). The integrated magnitudes of G1 and G2 are F160W and 19.1, respectively.
3 Observations
All of the observations were performed with the Low Resolution Imaging Spectrograph (LRIS; Oke et al. 1995) on the Keck II telescope. For the spectroscopic observations, we have used the instrument in long-slit mode with the grating which provides a spectral resolution of . The long slit was aligned along the axis defined by the two images of the background source for both SBS 0909+532 and CLASS B2319+051. Note that the latter position covers the primary lensing galaxy G1 in the B2319+051 system but not G2. For galaxy G2, the longslit was placed along the axis defined by its two components, G2a and G2b (see §2.3). For HST 1411+5211, the long slit was aligned along the axis defined by images A and C of the background source (see Fischer et al. 1998). Except for galaxy G2 of B2319+051 where only one exposure was taken, two exposures of equal duration were taken for each object. The specific details of these observations are listed in Table 1. In addition, we have obtained images of CLASS B2319+051 using LRIS in imaging mode. These data are the only optical imaging available on this source. The total exposure time for these observations is 1200 sec.
In all cases, the data were reduced using standard IRAF111IRAF is distributed by the National Optical Astronomy Observatories, which are operated by the Association of Universities for Research in Astronomy, Inc., under cooperative agreement with the NSF. routines. The bias levels were estimated from the overscan region on each chip. For the imaging data, a flat-field was constructed from dome flats taken in the beginning of each night. For the spectroscopic observations, flat-fielding and wavelength calibration were performed using internal flat-field and arc lamp exposures which were taken after each science exposure. Observations of the Oke (1990) spectrophotometric standard stars Feige 34, G138-31, BD332642, and Feige 110 were used to remove the response function of the chip. The individual spectra for each object were weighted by the squares of their signal-to-noise ratios and combined.
4 Results
The final spectra are shown in Figures 1 – 3 and 5 – 6. The lines used to identify the redshifts of the lensing galaxies and the background sources are given in Table 2. The redshift uncertainties (see Table 3) have been estimated by taking the rms scatter in the redshifts calculated from the individual spectral lines. We present a more detailed discussion of the individual systems below.
4.1 SBS 0909+532
The spatial projection of the spectra from the SBS 0909+532 system shows a double peak, with the sub-peaks separated by approximately 5 pixels or 11. This separation matches the 1107 quasar image separation measured by Kochanek et al. (1997). The spectrum shown in Figure 1 was extracted using an aperture of 2 pixels placed in the trough between the sub-peaks of emission in order to maximize the fractional contribution of the lensing galaxy. The final spectrum is still dominated by light from the background source, a quasar at with broad C III] and Mg II emission lines (as seen in Oscoz et al. 1997). However, it is possible to see features from the lensing galaxy, including the Ca II H and K doublet, which establishes the lens redshift as . The features identified with the lensing galaxy are typical of an early-type galaxy. For a non-evolving elliptical galaxy at the lens redshift, we expect an optical–infrared color of (Poggianti 1997). Consequently, the observed value of (Lehár et al. 1999) provides additional support for an early-type classification of the lensing galaxy.
4.2 HST 1411+5211
The spectrum of lens system HST 1411+5211 shows two distinct traces, a bright central source which is separated by approximately 5 pixels or 11 from a significantly fainter one. The two traces correspond to the lensing galaxy and the background source, respectively, as the separation is exactly that expected from the high-angular-resolution HST imaging (Fischer et al. 1998). From these spectra, we have obtained the source and lens redshift of and , respectively. In the spectrum of the lensing galaxy, the strong 4000Å break, the small equivalent width Balmer absorption lines, and the lack of [O II] emission indicate that little star formation is occurring (Figure 2). The spectral features are consistent with the fact that this galaxy appears as a morphologically normal elliptical. The measured redshift proves that the lensing galaxy is a member of the cluster CL 3C295.
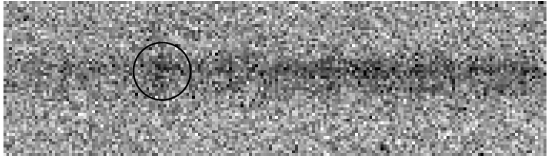
The background source shows a modest emission line at an observed wavelength of 4634Å (Figure 3). This line is much more obvious in the two-dimensional, sky-subtracted spectrum than in this one-dimensional spectrum (see Figure 4). There are only two plausible interpretations of this emission line as all other choices would require the presence of other, stronger emission lines. Firstly, the line could be [O II] 3273Å at . We would then expect to see comparably strong [O III] 5007Å, 4959Å at 6164Å, 6224Å or H 4861Å at 6042Å. None of these lines are seen in the data, although the spectrum is much weaker at these wavelengths. This identification would also imply that the emission is not coming from the background source, but rather from some unrelated foreground object. Because of the lack of other emission lines and the exact coincidence with the position of the background source, we believe the only reasonable explanation for this line is Ly 1215.7Å at . The appearance of this spectrum is similar to other known star-forming galaxies at comparable redshifts with absorption features which include e.g. Si II and C IV (Steidel et al. 1996a,b). In addition, there is a continuum break blueward of this line with a drop amplitude (Oke & Korycansky 1982) of . This decrement is due to absorption by intervening hydrogen and is consistent with that found in the spectra of other high-redshift objects (e.g. Oke & Korycansky 1982; Kennefick et al. 1995). Because of the low signal-to-noise in this spectrum, we still regard this redshift measurement as tentative. We are planning to re-observe this object during the next observing season.
In addition to the lens system, we have also obtained spectra of two galaxies which happened to lie on the long slit during the observations of the gravitational lens system. They are identified as galaxies #158 and #165 in the cluster field CL 3C295 (see Table 6 of Dressler & Gunn 1992). Dressler & Gunn (1992) list their total magnitudes as 20.13 and 22.56, respectively. The redshift of each galaxy was previously unknown. Based on our spectra, we find a redshift of for both galaxies (Figure 5), indicating that the galaxies are cluster members. Each spectrum shows the classic K star absorption features of Ca II H & K which are typical of an early-type galaxy. In addition, they show a series of strong Balmer absorption lines, including H, H, H, H, H, and H, which suggest that these galaxies are “K+A” (or more commonly known as “E+A”) galaxies (Dressler & Gunn 1983; Gunn & Dressler 1992; Zabludoff et al. 1997). These spectral features imply that these galaxies have experienced a brief starburst within the last 1–2 Gyrs.
4.3 CLASS B2319+051
We have obtained spectra of the two lensing galaxies, G1 and G2, in B2319+051. No optical emission associated with the background radio source has been detected; thus, the source redshift is still unknown. The redshifts of the two lensing galaxies are . As the redshifts indicate, G2 is not a companion galaxy to the primary lensing galaxy G1. Rather, they are just a chance superposition along the line-of-sight. The spectrum of G1 is consistent with its morphological identification as an early-type galaxy in the high-angular-resolution NICMOS image (Marlow et al. 1999). It has a strong 4000Å break and small equivalent width Balmer absorption lines. It does, however, show some indication of current star formation with a modest [O II] line (equivalent width of 9Å). Galaxy G2 is clearly more active as it has much stronger [O II] emission (equivalent width of 22Å) and a less well-defined 4000Å break. In addition, the spectrum shows a series of strong Balmer absorption features which indicates a burst of star formation within the last 1–2 Gyrs (see e.g. §4.2). Such activity is expected as the galaxy appears morphologically irregular with two distinct peaks in the surface brightness profile. This appearance suggests a merger or interaction.
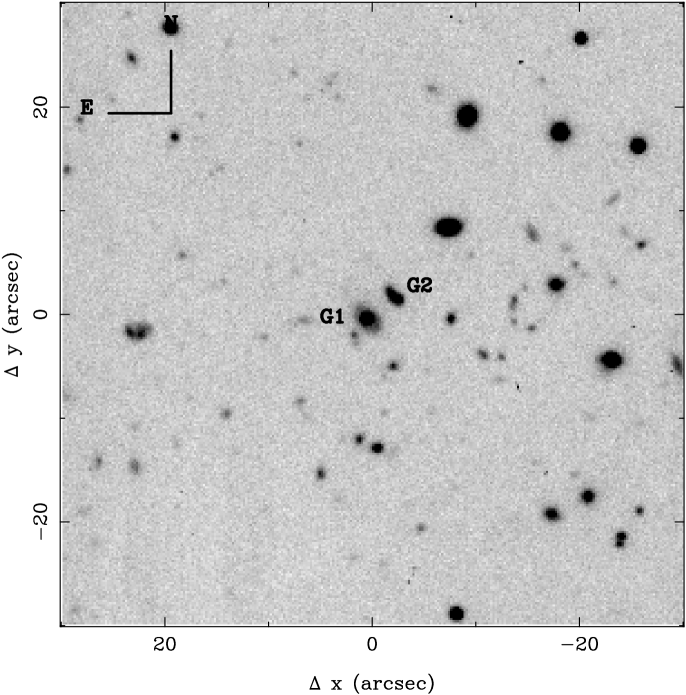
The composite band image of a field centered on B2319+051 is shown in Figure 7. Using the object detection and analysis software SExtractor (Bertin & Arnouts 1996), we have obtained the magnitude for the primary lensing galaxy G1 within an aperture the size of the Einstein ring radius (068). In addition, the total magnitudes of G1 and G2 are and , respectively. The errors are large because these data were taken in non-photometric conditions with light to moderate cirrus. The total color of G1 is consistent with a non-evolving elliptical at a redshift of (Poggianti 1997).
5 The Mass and Light
Once the source and lens redshifts of a gravitational lens system are known, the system can be used, in principle, for two distinct purposes. Firstly, it is possible to measure by combining the angular diameter distances and a model of the lensing potential to predict the time delays (see e.g. Refsdal 1964; Blandford & Narayan 1992; Blandford & Kundić 1996). The predicted time delay is proportional to the ratio of angular diameter distances, (where , , and are the angular diameter distances to the lens, to the source, and between the lens and source, respectively). As such, the predicted time delay is also inversely proportional to . Thus, if the background source is variable, and the time delays can be measured, the ratio between the observed and predicted time delays will provide a measure of . Unfortunately, a time delay measurement requires long-term radio or optical monitoring and a detection of a relatively strong event (see e.g. Kundić et al. 1997a; Schechter et al. 1997; Lovell et al. 1998; Biggs et al. 1999; Fassnacht et al. 1999). Consequently, these measurements are difficult to make.
More immediately, gravitational lens systems with measured redshifts can be used to study the properties of massive galaxies at moderate redshift. Specifically, the size of the image splitting provides a direct estimate of the mass within the Einstein ring of the lens. This mass can be expressed as :
| (1) |
where is the angular radius of the Einstein ring. For the lenses presented in this paper, we find physical Einstein ring radii of kpc and masses of (see Table 3).
The mass of the galaxy, combined with its photometric properties, can be used to compute the mass-to-light of the lens. For this calculation, we need to measure the galaxy light within the same aperture as the mass. For both SBS 0909+532 and HST 1411+5211, all of the necessary parameters for the mass-to-light () calculation have been measured. For the remaining system B2319+051, we can only provide a reasonable estimate. In the calculations presented below, all of the galaxy magnitudes are given in a Vega-based (“Johnson”) magnitude system. In addition, we have converted all observed magnitudes to the rest-frame band using no-evolution corrections and rest-frame colors calculated from the spectral energy distribution of a typical elliptical galaxy (Coleman, Wu & Weedman 1980). We have ignored the effects of extinction and evolution. While the total extinction is usually modest in early-type lenses [ mag; Falco et al. 1999], the evolutionary correction is, as expected, an increasing function of redshift, approaching 1 mag at redshifts of (Kochanek et al. 1999).
5.1 SBS 0909+532
The properties of the lensing galaxy in SBS 0909+532 have been measured by Lehár et al. (1999). They give a total magnitude of , a color of within a 17 diameter aperture, and an effective radius of . The errors on these parameters are extremely large because the subtraction of the close quasar pair leaves significant residuals in the final image (see Figure 1 of Lehár et al. 1999). However, we can try to use these values to estimate the light within the Einstein ring radius of 055. Adopting a de Vaucouleurs law for the galaxy surface brightness profile, we calculate that the magnitude within the Einstein ring radius would be . If we assume that the galaxy color is constant with radius, the magnitude corresponds to . Converting this value to an absolute magnitude, we find and . Although this measurement does not place any strong constraints on the of this lensing galaxy, it is consistent with the mass-to-light ratios of other early-type lenses at . From the review of Keeton et al. (1998), we would expect . We note that the mass-to-light ratios of high-redshift lensing galaxies are higher (by a factor of ) than the ratios of nearby elliptical galaxies within the same physical radius (e.g. Lauer 1985; van der Marel 1991); however, searches for gravitational lenses are biased toward high mass systems since these systems have a larger cross-section for lensing.
5.2 HST 1411+5211
For HST 1411+5211, we have obtained the photometry of the lensing galaxy from the processed WFPC2 image of the cluster CL 3C295 which is given in Smail et al. (1997). We adopt a zero point in the F702W bandpass of mag DN-1 s-1 (Holtzman et al. 1995) and measure an aperture magnitude of F702W within the Einstein ring radius of 114. Converting this value to an absolute magnitude, we find and . This mass-to-light ratio is considerably higher (by a factor of ) than the average lensing galaxy at (Keeton et al. 1998). The inflated value is the result of cluster–assisted galaxy lensing induced by the cluster CL 3C295; this cluster is extremely massive with a velocity dispersion of (Dressler & Gunn 1992). Such an effect is also seen in the gravitational lens system Q0957+561 where the contribution of the cluster (Angonin-Williame, Soucail & Vanderriest 1994; Fischer et al. 1997) results in an unusually high value of for the central lensing galaxy G1 (Keeton et al. 1998).
5.3 CLASS B2319+051
For B2319+051, we have calculated an aperture magnitude of for the lensing galaxy G1 (see §4.3). This magnitude corresponds to or a luminosity of . Because the redshift of the background source in this system is not known, we cannot calculate the mass-to-light ratio of the lensing galaxy. However, using the measured luminosity and equation (1), we can represent the ratio of G1 as a function of . That is,
| (2) |
For reasonable values of the source redshift i.e. , we estimate that will be between . In our chosen cosmology, all other lensing galaxies which have been morphologically classified as early-type have blue mass-to-light ratios which are greater than (Keeton et al. 1998). In order for the early-type lensing galaxy in B2319+051 to be consistent with the measurements from other lenses, we predict that the source redshift will be less than 1.5.
6 Conclusion
As part of a continuing observational program to study gravitational lens systems, we have measured previously unidentified redshifts in three lens systems, SBS 0909+532, HST 1411+5211, and CLASS B2319+051. The spectral characteristics of the central lensing galaxy in all three systems suggest that each is an early-type galaxy. High-angular-resolution HST images confirm that these lenses appear as morphologically normal early-type galaxies (Fischer et al. 1998; Marlow et al. 1999; Lehár et al. 1999). The observations suggest, as previously noted, that the majority of lensing galaxies are early-types (see Keeton et al. 1998 and references therein). For the lensing galaxy in HST 1411+5211, we measure a blue mass-to-light ratio which is a factor of larger than the average lensing galaxy at a similar redshift. The presence of the massive cluster CL 3C295 is responsible for this significantly enhanced ratio.
For the other two systems, we are only able to constrain the mass-to-light ratios. The large observational uncertainties on the luminosity of the lensing galaxy in SBS 0909+532 allow a wide range in mass-to-light ratio; however, our measurement is consistent with the observed values in other high-redshift gravitational lenses. Similarly for the primary lensing galaxy in B2319+051, we predict a mass-to-light ratio which is typical of previous lens measurements. Our imaging indicates that both lenses have a few companion galaxies within kpc which have magnitudes and/or colors typical of an early-type galaxy at the lens redshift. Consequently, the primary lensing galaxy may be associated with a group of galaxies as previously observed in the lens systems MG 0751+2716, PG 1115+080, and B1422+231 (Kundić et al. 1997b,c; Tonry 1998; Tonry & Kochanek 1999). We are currently pursuing the group hypothesis for both SBS 0909+532 and B2319+051.
Finally, the expected time delays in all three lens systems are approximately days or less (Oscoz et al. 1997; Fischer et al. 1998; Marlow et al. 1999), and at least one source (B2319+051) shows evidence of variability (Marlow et al. 1999). Therefore, some of these systems may be suitable for measuring .
References
- (1) Angonin-Williame, M.-C., Soucail, G., & Vanderriest, C. 1994, A&A, 291, 411
- (2) Bertin, E. & Arnouts, S. 1996, A&A, 117, 393
- (3) Biggs, A.D., Browne, I.W.A., Helbig, P., Koopmans, L.V.E., Wilkinson, P.N., & Perley, R.A. 1999, MNRAS, 304, 349
- (4) Blandford, R.D. & Narayan, R. 1992, ARA&A, 30, 311
- (5) Blandford, R.D. & Kundić, T. 1996, in Livio M., ed, The Extragalactic Distance Scale, Cambridge University Press, Cambridge, p. 60
- (6) Butcher, H. & Oemler, A. 1978, ApJ, 226, 559
- (7) Coleman, G.D., Wu, C.C., & Weedman, D.W. 1980, ApJS, 43, 393
- (8) Dressler, A. & Gunn, J.E. 1983, ApJ, 270, 7
- (9) Dressler, A. & Gunn, J.E. 1992, ApJS, 78, 1
- (10) Engels, D., Hagen, H.-J, Cordis, L., Koehler, S., Wisotzki, L., & Reimers, D. 1998, A&AS, 128, 507
- (11) Falco, E.E., Kochanek, C.S., & Muñoz, J.A. 1998, ApJ, 494, 47
- (12) Falco, E.E., Impey, C.D., Kochanek, C.S., Lehár, J., McLeod, B.A., Rix, H.-W., Keeton, C.R., Muñoz, J.A., & Peng, C.Y. 1999, ApJ, 523, 617
- (13) Fassnacht, C.D. & Cohen, J.G. 1998, AJ, 115, 377
- (14) Fassnacht, C.D., et al. 1999, AJ, 117, 658
- (15) Fischer, P., Bernstein, G., Rhee, G., & Tyson, J.A. 1997, AJ, 113, 521
- (16) Fischer, P., Schade, D., & Barrientos, L.F. 1998, ApJ, 503, L127
- (17) Helbig, P., Marlow, D., Quast, R., Wilkinson, P.N., Browne, I.W.A., & Koopmans, L.V.E. 1999, A&AS, 136, 297
- (18) Jackson, N., et al. 1998a, MNRAS, 296, 483
- (19) Jackson, N., Helbig, P., Browne, I.W.A., Fassnacht, C.D., Koopmans, L., Marlow, D., & Wilkinson, P.N. 1998b, A&A, 334, L33
- (20) Holtzman, J.A., Burrows, C.J., Casertano, S., Hester, J.J, Trauger, J.T., Watson, A.M., & Worthey, G. 1995, PASP, 107, 1065
- (21) Keeton, C.R., Kochanek, C.S., & Falco, E.E. 1998, ApJ, 509, 561
- (22) Kennefick, J.D., Djorgovski, S.G., & de Carvalho, R.R. 1995, AJ, 110, 2553
- (23) Kochanek, C.S., Falco, E.E., & Schild, R. 1995, ApJ, 452, 109
- (24) Kochanek, C.S., Falco, E.E., Schild, R., & Dobrzycki, A. 1997, ApJ, 479, 678
- (25) Kochanek, C.S., Falco, E.E., Impey, C.D., Lehár, J., McLeod, B.A., Rix, H.-W., Keeton, C.R., Muñoz, J.A., & Peng, C.Y. 1999, ApJ, submitted (astro-ph/9909018)
- (26) Koopmans, L.V.E., de Bruyn, A.G., & Jackson, N. 1998, MNRAS, 295, 534
- (27) Koopmans, L.V.E., et al. 1999, MNRAS, 303, 727
- (28) Kundić, T., et al. 1997a, ApJ, 482, 75
- (29) Kundić, T., Cohen, J.G., Blandford, R.G., & Lubin, L.M. 1997b, AJ, 114, 507
- (30) Kundić, T., Hogg, D.W., Blandford, R.G., Cohen, J.G., Lubin, L.M., & Larkin, J.E. 1997c, AJ, 114, 2276
- (31) Lauer, T. 1985, ApJ, 292, 104
- (32) Lehár, J., Falco, E.E., Kochanek, C.C., McLeod, B.A., Muñoz, J.A., Impey, C.D., Rix, H.-W., Keeton, C.R., & Peng, C.Y. 1999, ApJ, submitted (astro-ph/9909072)
- (33) Lovell, J.E.J., Jauncey, D.L., Reynolds, J.E., Wieringa, M.H., King, E.A., Tzioumis, A.K., McCulloch, P.M., & Edwards, P.G. 1998, ApJ, 508, L51
- (34) Marlow, D.R., et al. 1999, ApJ, in preparation
- (35) Myers, S.T., et al. 1999, in preparation
- (36) Oke, J.B. 1990, AJ, 99, 1621
- (37) Oke, J.B. & Korycansky, D.G. 1982, ApJ, 255, 11
- (38) Oke, J.B., et al. 1995, PASP, 107, 375
- (39) Oscoz, A., Serra-Ricart, M., Mediavilla, E., & Buitrago, J. 1997, ApJ, 491, L7
- (40) Poggianti, B.M. 1997, A&AS, 112, 399
- (41) Refsdal, S. 1964, MNRAS, 128, 307
- (42) Schechter, P.L., et al. 1997, ApJ, 475, 85
- (43) Smail, I., Dressler, A., Couch, W.J., Ellis, R.E., Oemler, A., Butcher, H.R., & Sharples, R.M. 1997, ApJS, 110, 213
- (44) Steidel, C.C., Giavalisco, M., Pettini, M., Dickinson, M., & Adelberger, K.L. 1996a, ApJ, 462, L17
- (45) Steidel, C.C., Giavalisco, M., Dickinson, M., & Adelberger, K.L. 1996b, AJ, 112, 352
- (46) Stephanyan, D.A., Lipovetskii, V.A., Chavushyan, V.O., Erastova, L.K., & Shapovalova, A.I. 1991, Astrofizkia, 34, 1
- (47) Sykes, C.M., et al. 1998, MNRAS, 301, 310
- (48) Tonry, J.L. 1998, AJ, 115, 1
- (49) Tonry, J.L. & Kochanek, C.S. 1999, AJ, 117, 2034
- (50) Thimm, G.J., Roser, H.J., Hippelein, H., & Meisenheimer, K. 1994, A&A, 285, 785
- (51) van der Marel, R.P. 1991, MNRAS, 253, 710
- (52) Xanthopoulos, E., et al. 1998, MNRAS, 300, 649
- (53) Zabludoff, A.I., Zaritsky, D., Lin, H., Tucker, D., Hashimoto, Y., Shectman, S.A., Oemler, A., & Kirshner, R.P. 1996, ApJ, 466, 104
| System | Date | Slit Width | P.A. | Coverage | |
|---|---|---|---|---|---|
| (sec) | (arcsec) | (deg) | Å | ||
| SBS 0909+532 | 1997 Dec 27 | 1200 | 1.0 | 115.2 | 3802 – 8783 |
| HST 1411+5211 | 1998 Jun 29 | 5400 | 0.7 | 100.6 | 3855 – 8836 |
| B2319+051 G1 | 1998 Aug 01 | 3600 | 1.0 | 0.0 | 4009 – 8991 |
| G2 | 1999 Jul 15 | 1500 | 0.7 | 45.0 | 4131 – 9132 |
| Observed Wavelength (Å) | |||||||
|---|---|---|---|---|---|---|---|
| Ion | (Å) | SBS 0909+532 | HST 1411+5211 | CLASS 2319+051 | |||
| Source | Lens | Source | Lens | Lens 1 | Lens 2 | ||
| Ly | 1216 | 4634 | |||||
| He II | 1641 | 3901 | |||||
| O III] | 1663 | 3953 | |||||
| C III] | 1909 | 4538 | |||||
| C II] | 2326 | 5529 | |||||
| Fe II | 2382 | 4359 | |||||
| 2586 | 4732 | ||||||
| 2599 | 4756 | ||||||
| Mg II | 2796 | 6646 | 5117 | ||||
| Mg I | 2853 | 5221 | |||||
| O III | 3133 | 7447 | |||||
| Ne V] | 3346 | 7953 | |||||
| 3427 | 8146 | ||||||
| O II | 3727 | 6053 | 5921 | ||||
| Ca II K | 3934 | 7199 | 5758 | 6388 | 6250 | ||
| Ca II H | 3968 | 7261 | 5814 | 6422 | 6308 | ||
| H | 4102 | 6013 | 6661 | 6511 | |||
| H | 4341 | 7046 | |||||
| H | 4841 | 7125 | 7729 | ||||
| System | |||||||
|---|---|---|---|---|---|---|---|
| ( Mpc) | ( Mpc) | ( Mpc) | () | () | |||
| SBS 0909+532 | |||||||
| HST 1411+5211 | |||||||
| B2319+051 |