Calibration of the CAT Telescope
Abstract
Due to the lack of test-beams in ground-based -ray astronomy, detector calibration has been a major challenge in this field. However, with the use of Cherenkov ring-images due to cosmic-ray muons and of strong -ray signals, the CAT telescope could be rather well monitored and understood. Here we present a few oustanding aspects of this work.
Introduction: the CAT detector
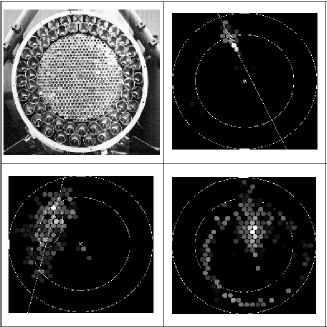
The CAT (Cherenkov Array at Thémis) telescope records Cherenkov flashes due to VHE atmospheric showers through its 17.8m2 mirror. Its camera is located 6m from the mirror and has a 4.8∘ full field of view, consisting of a central region of 546 0.12∘ angular diameter phototubes arranged in a hexagonal matrix and of 54 surrounding tubes in two “guard rings” (Fig.1a). Fast electronics allows a relatively low -ray detection threshold energy of (at Zenith), and the fine grain of the camera permits an accurate image analysis. The experiment and the analysis method are fully described elsewhere Barrau ; LeBohec . Briefly, after selecting the most significant triggers (total charge 30 photo-electrons), good discrimination between and hadron-induced showers is achieved by looking at the shape and the orientation of the images (see the events on Fig. 1a): since -ray images are rather thin and ellipsoidal while hadronic images are more irregular, a first cut is applied which selects images with a “-like” shape; it is based on a fit to a mean light distribution predicted from electromagnetic showers, and a probability 0.35 is required. Then, since -ray images are expected to point towards the source position in the focal plane whereas cosmic-ray directions are isotropic, a second cut 6∘ is used in the case of a point-like source, where the pointing angle is defined as the angle at the image barycentre between the actual source position in the focal plane and that of the image which is reconstructed by the fit 111The resolution per event is of the order of the pixel size, i.e. 0.1∘.. As a result, this procedure rejects 99.5% of hadronic events while selecting 40% of -ray events. Fig 1b is an example of the pointing angle distribution obtained on the Crab nebula: the signal is clearly seen in the first bins, while a second signal can be seen at 180∘, due to -ray images whose direction has been mis-reconstructed by the fit 222The global rise of the background distribution for large values of corresponds to large hadronic images which were cut by the edge of the camera. This effect becomes fainter for larger zenith angles, since images form closer to the center of the camera; see Mohanty for illustration..

Calibration of the detector
Hardware monitoring
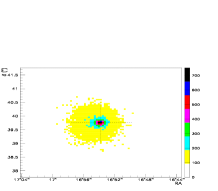

Mrk 501 exhibited a remarkable series of flares during the whole year 1997 Djannati , which have been very
useful for detector calibration. As an example, Fig. 2a illustrates the very good quality of the
mechanical monitoring for data taken with a zenith angle between 0∘ and 44∘: the signal appears
right at the actual position of the source, thus validating the angular correction which is applied on each event
to compensate for the unavoidable and zenith-dependent slight mis-alignment of the optical axis of the
camera 333This is due to the weight of the camera, which bends the arms of the telescope, and to the telescope
azimuth and altitude axis mis-alignment, especially at large zenith angles..
Cosmic-ray muons falling onto the mirror yield ring-like images in which the light distribution can be
easily predicted. The fine grain of the CAT camera allows a fine analysis of these
images IacoucciThese .
In this way, the overall conversion factor between ADC counts and incident Cherenkov photon number can be directly
checked. This factor involves optical efficiencies, as well as phototube pedestals and gains. As an example,
Fig 2b shows that the camera is correctly calibrated, except for a few channels which are not used in
the analysis. In this study, particular attention has been paid to the wavelength-dependent aspect, by
taking special runs using different UV-filters placed in front of the camera.
Validation of the simulations


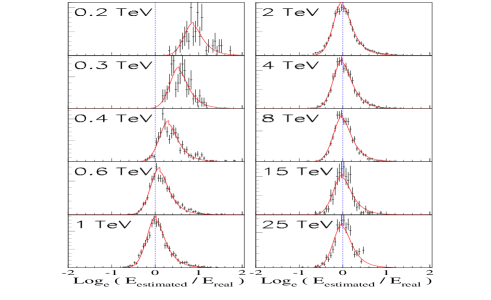
On April 16th, 1997, Mrk 501 reached 8 times the level of the Crab nebula. The signal-to-noise ratio for this night is 2.7, corresponding to a -ray beam with only 30% contamination. The good atmospheric quality of this night allows the use of this beam for calibration through comparison with simulations. Fig. 3a shows the perfect agreement on the distributions of Hillas parameters Weekes : it is shown for events selected both with the single orientation cut and with the complete selection including the fit. The distribution of the final number of pixels retained by the fit (see LeBohec ) is also well reproduced. Furthermore, the good agreement observed on the fourth-brightest-pixel’s charge validates the simulations at the trigger level, since the trigger condition requires four pixels above threshold. Finally, Fig. 3b shows the ndf and distributions 444The distribution is not flat, as would be expected if the were performed using variables with Gaussian errors. The description of Cherenkov light fluctuations in showers development is a very difficult task (see LeBohec for discussion)., as well as the previously discussed parameters, expressed as functions of the total image charge : here again the agreement is very good. This allows the simulation to be used to calculate the -ray effective detection area within the selection cuts, as well as the energy-resolution function . This is shown in Fig. 4. In particular, a clear positive bias in the energy reconstruction is visible for low values of the injected energy (Fig. 4b): it is due to a trigger effect which selects those events which benefited from a positive fluctuation of Cherenkov light during the shower development. This energy over-estimation disappears when going towards higher energies, where becomes more Gaussian, with a zero mean value and a width 20%.
Conclusion
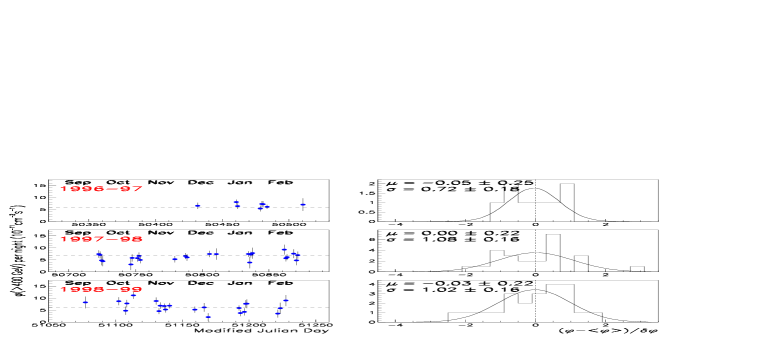
More details concerning calibration and spectrum measurement will be given in a forthcoming paper. The good stability obtained to date on the signal from the Crab nebula (Fig. 5), using the acceptances and energy-resolution function discussed above, illustrates the good quality of running conditions and the good understanding of the detector. Future effort will be devoted to the analysis of large zenith angle data (see Mohanty for a first study) and to the cross-calibration with the CELESTE experiment, operating on the same site with an energy threshold of ; the recent observation of the first common events between both detectors DeNaurois is an encouraging result in this direction.
References
- (1) Barrau, A., et al, Nucl. Instr. Meth. A 416, 278 (1998).
- (2) De Naurois, M., et al, Proc. XXVI ICRC 5, 211 (Salt-Lake City, 1999).
- (3) Djannati-Ataï, A., et al, A&A 350, 17 (1999).
- (4) Iacoucci, L., Ph.D. thesis, Ecole Polytechnique, Palaiseau, France (1998).
- (5) Le Bohec, S., et al, Nucl. Instr. Meth. A 416, 425 (1998).
- (6) Mohanty, G., et al, Proc. XXVI ICRC 3, 452 (Salt-Lake City, 1999).
- (7) Weekes, T.C., et al, ApJ 342, 379 (1989).