BeppoSAX observations of two high redshift clusters of galaxies: RXJ 0152.71357 and MS 2053.70449
Abstract
We present X-ray observations of two high redshift clusters of galaxies carried out with the BeppoSAX satellite. One cluster, RXJ 0152.71357 at , was selected from the ROSAT Deep Cluster Survey sample, as one of the most X-ray luminous systems known at . The optical and ROSAT-PSPC data show a complex morphology with at least two cores. Our SAX observations yield a gas temperature keV and a metallicity , with a prominent iron Kα line. The second cluster, MS 2053.70449 at , was selected from the EMSS sample. Given the poor statistics no constraints on the metallicity can be derived from the present data. Large uncertainties are associated to the gas temperature ( keV), which has been obtained after fixing the abundance to 0.3 solar. Combining these results with those obtained for similarly high redshift () clusters of galaxies with broad band X-ray spectra, we discuss the high redshift relationship. The data can easily be accommodated with a non-evolving (or mildly evolving) relation, a result which, when combined with the little observed evolution in the bulk of the X-ray cluster population, gives support to low cosmological models.
1 Introduction
High redshift clusters of galaxies have long served as valuable tools to test theories of cosmic structure formation (e.g. Press & Schechter 1974, Peebles et al. 1989, Eke et al. 1996, to mention just a few). Measurements of the temperature of the intra-cluster medium (ICM) in distant clusters are particularly important since cluster temperatures are closely related to their mass, as long as these systems are in virial equilibrium. Physical cluster parameters of the highest redshift clusters, measurable by means of deep X-ray observations (e.g. the Luminosity-Temperature relation), set also strong constraints on the thermodynamical evolution of their gaseous component. In addition, the measurement of the metal abundance from X-ray spectra in remote bound systems can constrain the mode and epoch of the enrichment of the intracluster gas.
Despite their importance, ICM properties at high redshift () are still largely unexplored. This is due to the limited effective area and spatial resolution of the past X-ray missions, as well as to the difficulty of finding X-ray luminous clusters at . Indeed the Extended Medium Sensitivity Survey (EMSS; Gioia et al., 1990) carried out with the Einstein Observatory has detected clusters at redshift up to (e.g. MS1137+6625 at 0.78 and MS1054-0321 at z=0.83, Gioia and Luppino, 1994; Donahue et al., 1998) but the statistics of high-z clusters in the EMSS is still low with only 6 clusters (out of a total of about 100) at . Over the last few years, however, several X-ray cluster surveys based on ROSAT-PSPC data (the RDCS: Rosati et al., 1995, 1998; the WARPS: Scharf et al., 1997; the SHARC: Burke et al., 1997; the 160∘ survey of Vikhlinin et al., 1998; the NEP: Mullis et al., 1998) have changed the observational scenario by collecting sizable samples of distant () systems, thus extending the pioneering work of the EMSS. The ROSAT Deep Cluster Survey (RDCS, Rosati et al. 1995, 1998) has pushed these studies to the faintest fluxes and highest redshifts, with 33 clusters spectroscopically identified to date at , out to (Rosati et al. 1999).
As an alternative method, several studies have tried to locate distant clusters around high redshift radio galaxies (e.g. 3C 324 at , Smail & Dickinson, 1995; 3C 184 at , Deltorn et al. 1997). ROSAT observations of distant radio galaxies (Crawford & Fabian 1996; Dickinson 1997) have provided some evidence that the observed X-ray emission might originate from hot intra-cluster gas. It remains difficult, however, to reliably measure ICM physical parameters in these objects, since one needs to discriminate an absorbed power-law component, due to the radio galaxy’s AGN, from the thermal component of the putative diffuse ICM.
Although the number of bona-fide high- clusters has significantly increased, only long ASCA observations, with a broad energy response, have allowed a few sketchy studies of their ICM properties to date. A recent compilation of cluster temperatures (Wu, Xue and Fang, 1999) reports a total of 168 clusters with good broad band X-ray spectroscopy, but only 5 (3) of these have been studied at ().
In this paper we present BeppoSAX observations of two high redshift clusters: MS 2053.70449 from the EMSS sample at and RXJ 0152.71357 from the RDCS sample at . The BeppoSAX MECS instrument (see section 2) has a slightly smaller (larger) effective area than the ASCA GIS for keV ( keV) and it is characterized by a significantly sharper PSF if compared with the ASCA GIS or ASCA SIS instruments, especially at high energy. This latter property implies a reduced background, making BeppoSAX MECS the best instrument to date for distant clusters investigations. RXJ 0152.71357 is the highest redshift cluster with good quality broad band X-ray spectroscopy to date and among the most X-ray luminous known at together with the well known MS1054.40321 (Gioia and Luppino, 1994; Donahue et al., 1998). Our data provide a rather accurate () temperature measurement for RXJ 0152.71357, which allows an interesting comparison with MS1054.40321 with very similar redshift and luminosity. In Table 1 the main properties of the two clusters, in their own discovery bands, are summarized.
| Name | RA | DEC | z | Energy Band | ||
|---|---|---|---|---|---|---|
| (J2000) | (J2000) | keV | erg cm-2 s-1 | erg s-1 | ||
| RXJ 0152.71357 | 01 52 41 | -13 57 45 | 0.831 | 0.5 2.0 | ||
| MS 2053.70449 | 20 56 22 | -04 37 52 | 0.583 | 0.3 3.5 |
We note that in the case of RXJ 0152.71357 we have reported the ROSAT PSPC flux (luminosity) measured over a circle of 3 arcmin radius, corresponding to Mpc at , while for MS 2053.70449 we have reported the total EMSS “corrected” flux (luminosity) i.e. the flux (luminosity) corrected for the effect of the finite EMSS detection cell.
This paper is organized as follows. In section 2 we present the BeppoSAX observations. The spectral analysis for RXJ 0152.71357 is presented in section 3 and for MS 2053.70449 in section 4. Section 5 contains a discussion of the results in the context of the high redshift relationship. Finally, summary and conclusions are presented in section 6. We adopt km s-1 Mpc-1 and throughout, unless otherwise noted.
2 BeppoSAX Observations and Data Preparation
| Name | Date | Seq. Numb | Exp. LECS | Rate LECS | Exp. MECS | Rate MECS |
|---|---|---|---|---|---|---|
| ksec | (10-3 cts/s) | ksec | (10-3 cts/s) | |||
| (0.12 4.0 keV) | (1.65 10 keV) | |||||
| RXJ 0152.71357 | 1998 Aug 7-10 | 60605001 | 61.3 | 127.7 | ||
| MS 2053.70449 | 1997 Oct 21-23 | 60243001 | 32.7 | 81.9 |
The observations were performed with the BeppoSAX Narrow Field Instruments, LECS (0.1–10 keV, Parmar et al. 1997), MECS (1.3–10 keV, Boella et al. 1997), HPGSPC (4–60 keV, Manzo et al. 1997) and PDS (13–200 keV, Frontera et al. 1997). We report here the analysis of the imaging instruments data (LECS and MECS). PDS and HPGSPC are collimated instruments with field of view of about 1.5 degrees (FWHM) and have a rather large and structured background which makes them not sensitive enough for very faint sources.
At launch the MECS was composed of three identical units. Unfortunately on 1997 May 6th the unit MECS1 had a technical failure. All observations after this date were performed with two units (MECS2 and MECS3). The LECS is operated during spacecraft dark time only, therefore LECS exposure times are usually smaller than MECS exposures by a factor 1.5-3. The MECS energy resolution is about 8% at 6 keV, while the LECS energy resolution is about 11% at 3 keV.
Table 2 gives the journal of observations for the two high redshift clusters. For both clusters we have acquired fewer photons than anticipated (because of the unavailability of one of the three MECS in the case of MS, and because of the shorter effective exposure in the case of RXJ 0152.71357).
Standard data reduction was performed using the software package “SAXDAS” (see http://www.sdc.asi.it/software and Fiore, Guainazzi & Grandi 1999). In particular, data are linearized and cleaned from Earth occultation periods and unwanted periods of high particle background (satellite passages through the South Atlantic Anomaly). We accumulated data for Earth elevation angles degrees and magnetic cut-off rigidity . Data from the two MECS units have been merged after gain equalization and single MECS spectra have been accumulated.
Both MECS and LECS source counts have been extracted from a circular region of 4 arcmin radius to maximize the statistics and the signal-to-noise (S/N) ratio.
LECS and MECS internal backgrounds depend on the position of the target in the detector (see Chiappetti et al. 1998, the BeppoSAX Cookbook, http://www.sdc.asi.it/software/cookbook and Parmar et al. 1999). Accordingly, background spectra were extracted from high Galactic latitude “blank” fields from the same source extraction region, in detector coordinates. The mean level of the background in the “blank fields” was compared with that of our observations using source-free regions at various positions in the detectors. The level of the “blank fields” background is consistent with the “local” background in the two cluster observations.
Spectral fits were performed using the XSPEC 9.0 software package and the September 1997 version of the calibration files (Ancillary Response Files and Redistribution Matrix Files). In the spectra analysis only the 1.6510 keV band counts for the MECS (channels 37 220) and the 0.124 keV counts for the LECS (channels 11 400) were used as suggested by the BeppoSAX Cookbook (Fiore, Guainazzi & Grandi, 1999, v. 1.2). The background subtracted count rates () in both LECS (0.12-4 keV) and MECS (1.65-10 keV) are given in Table 2. Source counts were binned in order to have a S/N 3 in each energy bin. The LECS and MECS data were fitted jointly, and the model normalization for each data set were allowed to be an independent parameter, in order to take into account differences in the absolute calibration of the two instruments. If not explicitly quoted all the errors reported in this paper represent the confidence levels for 1 interesting parameter ( = 1.0).
3 RXJ 0152.71357
RXJ 0152.71357 was discovered in the RDCS which has constructed an X-ray selected, flux-limited sample of clusters of galaxies via a serendipitous search for extended X-ray sources in deep pointed PSPC observations. A wavelet-based technique was employed to characterize low-surface brightness sources and select cluster candidates down to the flux limit of erg cm-2 s-1, over deg2 (Rosati et al., 1995). Optical follow-up imaging and spectroscopy have confirmed to date clusters and groups, which span a large range in redshift [0.05–1.26] and X-ray luminosity [ erg s-1], RXJ 0152.71357 being the most luminous of the sample.
RXJ 0152.71357 was discovered in the ROSAT PSPC field rp600005n00 pointed at the nearby galaxy NGC 720. The cluster was detected at 13.6′ off-axis ( and ). At this position the wavelet algorithm clearly reveals an extended X-ray source with an extent above the local PSF of the ROSAT PSPC instrument and with a double core (the multi-scale wavelet analysis preserves source substructure information) with intensity peaks separated by arcmin ( Mpc at the cluster redshift of ). This same cluster has also independently been identified in the WARPS survey (Ebeling et al. 1999) and recently reported also in Romer et al. (1999).
Integrating the ROSAT PSPC flux over a circle of 3 arcmin radius, corresponding to Mpc at , we obtain net counts 111 The south-west faint source, visible in figure 1 ( and ), possibly an AGN, was masked out in this measurement (this would increase the flux by 7%). The ROSAT hardness ratio map indicates that the spectra of this faint source is steeper than that of RXJ 0152.71357; therefore its contribution to the BeppoSAX data at kev is below a few percents. An even smaller contribution is expected from the two bright stars visible in the south-east section of the image. in the 0.5-2.0 keV energy band, with 6.2/arcmin2 background counts. With an effective exposure time of 19904 sec, a galactic HI column density along the line of sight of (Dickey & Lockman 1990) and using a Raymond-Smith spectral model (Raymond & Smith 1977) with kT 6 keV, we obtain an unabsorbed flux of erg cm-2 s-1. The rest frame X-ray luminosity within an aperture of Mpc is erg s-1.
Imaging and spectroscopic follow-up observations of RXJ1052.71357 were conducted with the EFOSC1 spectrograph at the ESO 3.6m in November 1996. With a long slit exposure of 2 hours it was possible to secure redshifts for 3 galaxies with belonging to the main northern clump. Additional multiband imaging and spectroscopy have been carried out at Keck with the Low Resolution Imaging Spectrograph (LRIS, Oke et al., 1995) and are presented and discussed elsewhere (Squires et al. in preparation), along with a weak lensing analysis of the field. We only note here that the new spectroscopic data confirm the redshift of also for the southern clump.
In figure 1, we show the R-band image (obtained with Keck-LRIS; 4000 s integration time) with the PSPC X-ray contours overlaid. The cluster galaxies distribution shows two main clumps and correlates very well with the double-peaked X-ray morphology.

The BeppoSAX - MECS X-ray image of the field in the keV band is shown in figure 2. The source, centered at and , is consistent with the celestial position of the cluster within the SAX positional errors. This source is marginally resolved at the spatial resolution of the BeppoSAX - MECS.
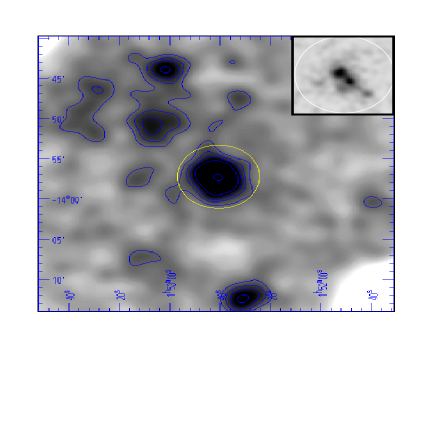
The total net counts in the source extraction region are for the LECS and for the MECS. The net counts represent about 59% (39%) of the total (source + background) counts in the source region for LECS (MECS).
The source spectrum was fitted using a Raymond-Smith spectral model modified by galactic absorption ( cm-2) along the line of sight at the cluster position. The results are reported in Table 3. The cluster gas is best fitted by a rest frame temperature of and metallicity of (68% confidence interval). The ratio of the model normalizations from LECS and MECS is about 0.71, which is consistent with the known differences in the absolute calibration of the two instruments.
The unfolded spectrum, the folded spectrum and the ratio between the data and best fit model are displayed in figure 3, while in figure 4 we report the two-parameter contours (68.3%, 90% and 99% confidence levels) for the cluster metallicity (in solar units) and temperature (in keV). Both temperature and metal abundance are rather well constrained, which is partially due to the detection of the iron complex at the redshifted energy of about 3.7 keV. It is worth noting that leaving the redshift, along with the metallicity and temperature, as free parameters we obtain best fit values () of , and metallicity (68% confidence interval). Finally, we have also tried a fit with the absorbing column density as a free parameter. We obtain best fit values () of , and ; the best fit absorbing column density converges to zero with a upper limit of cm-2. These results confirm the robustness of our spectral fit.


Using the best fit model parameters reported in Table 3 and assuming a mean value between the LECS and MECS normalizations, we derive an unabsorbed () keV flux of erg cm-2 s-1. The measured flux is in good agreement with that derived from the ROSAT PSPC data (see Table 1).
The derived unabsorbed () keV flux is erg cm-2 s-1, corresponding to a luminosity in the cluster rest frame of erg s-1, and to a bolometric luminosity of erg s-1.
Given the uncertain dynamical state of RXJ0152.7-1357 and the difficulty in measuring its gas density profile, it is difficult to provide an accurate estimate of its mass 222 Assuming the gas in isothermal and hydrostatic equilibrium the total mass within a radius would be : .
4 MS 2053.70449
MS 2053.70449 is part of the EMSS sample of high- clusters of galaxies () serendipitously discovered in the fields of the Einstein IPC. The X-ray source is located at and and the unabsorbed IPC flux, corrected for the effect of the finite EMSS detection cell is erg cm-2 s-1 (Henry et al. 1992; Gioia & Luppino 1994). The redshift of is based on 5 concordant galaxy redshifts (Fabricant, private communication).
Given its high luminosity, erg s-1, MS 2053.70449 was part of the CCD imaging survey for gravitational lensing carried out with the telescopes at Mauna Kea by Luppino et al. (1999). Luppino and Gioia (1992) first reported the presence of a large arc (arc-length ) fragmented into two distinct clumps at a radius of from the optically dominant cluster galaxy.
A weak lensing study (Clowe 1998) shows that MS 2053.70449 is not among the most massive z 0.55 clusters of the EMSS. Clowe et al. (1999) report a mass value, from the weak lensing, of (2.3 h within 0.5 h Mpc. The mass profile is well fit by a “universal” CDM profile (Navarro, Frenk & White, 1996) with parameters r200=590 h kpc and c2 assuming a background galaxy redshift zbg=1.5. MS 2053.70449 is also well fit by an isothermal sphere model with a velocity dispersion of km s-1 for zbg=1.5, indicating that the cluster is close to virialization. Kelson et al. (1997) find that the fundamental plane relation of galaxies in MS 2053.70449 is very similar to that of Coma, suggesting that the structure of the early-type galaxies has changed little since .
The MECS keV X-ray image of the field is shown in figure 5; the peak of the X-ray emission from the cluster is centered at and , which is consistent with the celestial position of the cluster within the SAX positional errors. The total net counts from MECS (LECS) are () and represent about 36% (47%) of the total (source + background) gross counts in the source region.
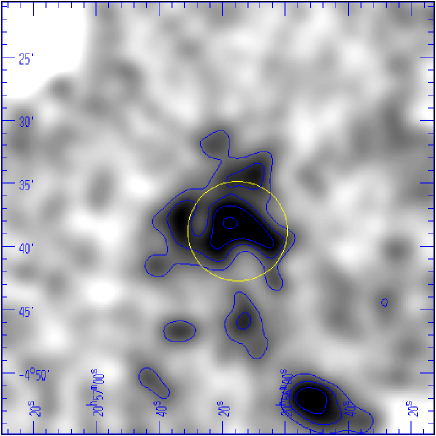
Table 3 reports the results of the spectral analysis. The source spectrum was fitted using a Raymond-Smith spectral model modified by galactic absorption ( cm-2, Dickey & Lockman 1990) along the line of sight at the cluster position. From the present data no constraints can be set on the abundance which was thus fixed to 0.3 solar. The cluster gas is best fit by a rest frame temperature (68 % confidence interval). The unfolded spectrum, the folded spectrum and the ratio between the data and best fit model are displayed in figure 6.
| Name | z | KT | Abundance | Norm. (LECS/MECS)a | /dof | |
|---|---|---|---|---|---|---|
| ( cm-2) | (keV) | (Solar Units) | () | |||
| RXJ 0152.71357 | 0.831 | 1.55 (fixed) | 6.46 | 0.53 | 6.9/9.7 | 0.79/21 |
| MS 2053.70449 | 0.583 | 4.96 (fixed) | 6.7 | 0.3 (fixed) | 5.4/4.8 | 0.93/7 |
NOTE - Errors are the 68% confidence interval for one interesting parameter ().
a Normalization at 1 keV. This number is equal to , where D is the distance to the source in cm, is the electron density in units of cm-3 and V is the volume filled by the X-ray emitting gas in cm3

.
The ratio of the model normalizations for LECS and MECS is about 1.1, which is slightly in excess of the value expected from the known differences in the absolute calibration of the two instruments. However, given the present statistics we consider the fit acceptable. We note that using only the MECS data we obtain for the temperature (68% confidence interval), which is consistent with (and even more constrained than) that obtained by the combined (LECS + MECS) data set.
Finally, we note that ASCA (GIS + SIS) did measure a temperature of (68% confidence level) for MS 2053.70449 (Henry, 1999); given the large uncertainties involved (both from BeppoSAX and ASCA) the two results are obviously consistent. On the other hand they both suggest a temperature less than about 13–14 keV.
Using the best fit model parameters reported in Table 3, we derive an unabsorbed () keV flux of erg cm-2 s-1 (LECS normalization) or erg cm-2 s-1 (MECS normalization). The measured flux is lower, but consistent within the errors, than that derived from Einstein IPC data (see Table 1). Henry (1999) finds from ASCA data a flux erg cm-2 s-1 in perfect agreement with the EMSS.
The derived unabsorbed keV flux (computed assuming a mean value between the LECS and MECS normalizations) is erg cm-2 s-1, corresponding to a luminosity in the cluster rest frame of erg s-1, and to a bolometric luminosity of erg s-1.
5 Discussion
In a recent work, Wu, Xue and Fang (1999) have used the largest sample of clusters of galaxies with good broad band X-ray spectroscopy from the literature to discuss the and the relationships 333The reader is referred to Wu, Xue and Fang (1999) for the comparison of their results with those from the literature, as well as for the comparison of the observed relationships and the theoretical ones. See also Section 3.3 in Borgani et al. (1999).. Their sample is mainly composed by clusters at (only 5 clusters out of 142 are at higher redshift). By comparing the clusters at with those at they do not find convincing evidence for a significant evolution in the and the relationship out to , a result which was first pointed out by Mushotzky and Scharf (1997).
As summarized in Table 4, distant cluster temperatures which have been measured to date are limited to a few systems at . At these redshifts the lookback time approaches half the age of the Universe and, therefore, the time leverage to measure evolution in cluster properties is large.
| Name | z | KTa | Lbol | Ref. |
|---|---|---|---|---|
| (keV) | erg s-1 | |||
| MS 0451.60305 | 0.539 | 10.17 | WXF,M+S,D96 | |
| MS 0015.91609 | 0.545 | 7.55 | WXF,M+S,HB98 | |
| MS 2053.70449 | 0.583 | 6.7 | This paper | |
| MS 1137.56625 | 0.78 | 5.7 | D99 | |
| RXJ 1716.66708 | 0.813 | 5.66 | WXF,G99 | |
| MS 1054.40321 | 0.826 | 12.30 | WXF,D98 | |
| RXJ 0152.71357 | 0.831 | 6.46 | This paper | |
| AXJ 20191127 | 1.00 | 8.60 | WXF,H97 |
a For consistency with the other measurements we have reported in this column the 90% confidence range.
Ref: WXF: Wu, Xue and Fang (1999); M+S: Mushotzky and Scharf (1997); D96: Donahue (1996); D98: Donahue et al. (1998); G99: Gioia et al. (1999); D99: Donahue et al. (1999); HB98: Hughes & Birkinshaw (1998); H97: Hattori et al. (1997).

In figure 7, we plot the high redshift cluster temperatures known to date in the plane. The error on the temperature represent the 90% confidence range, while we have used a realistic 15% absolute error for the bolometric luminosity. Since MS 2053.70449 and AXJ 20191127 have very large errors on the measured temperature, we have not reported these objects in figure 7.
The relationship for clusters at obtained by Wu, Xue and Fang (1999) () is also shown (solid line), together with the on the slope (dotted lines). The short-dashed line represents the evolving relationship with at , while the long dashed line represents the evolving relationship with at . The two redshifts enclose all the objects shown in figure 7. For A1 and A2 we have assumed the values 1 and 3, respectively; these two values have been determined by Borgani et al. (1999), and represent the 90% confidence level required to fit the lack of observed evolution of the XLF in the RDCS cluster sample in a = 1 universe. Low density models, instead, can easily be accommodated with a non-evolving relation, or mild () evolution. The new cluster temperature we have determined for RXJ0152.71357 is not consistent with a strong evolution of the relation out to . Since all the data points in figure 7 lie to the right of the line, according to the parameterization of Borgani et al. (1999), the cluster temperatures measured so far at lend considerable support to cosmological models with a low density parameter. Similar results have been recently obtained by Donahue et al. (1999) and by Donahue and Voit (1999). Using a complete sample of high redshift EMSS clusters, Donahue et al. (1999), have shown that the cluster temperature function reveals modest evolution, a result which implies a low value (Donahue and Voit 1999).
The metal abundance of the ICM in rich clusters of galaxies has been recently investigated by Mushotzky and Loewenstein (1997). They found that the Fe abundance shows little or no evolution out to (), suggesting that most of the enrichment of the ICM occurred at . Given the present uncertainty on the ICM abundance in RXJ 0152.71357 we cannot set strong constraints on the cosmological evolution of the Fe abundance. However, within the large uncertainty (; 68 % confidence interval), these data suggest that the bulk of the Fe enrichment was completed by .
Finally it is worth comparing RXJ 0152.71357 with MS1054.40321. Provided that temperature measurements are not biased by cooling flows, strong deviations from isothermality or by the presence of contaminating AGN, it is interesting to note that the temperature of MS1054.40321 is significantly higher than that of RXJ 0152.71357, although the two clusters have very similar luminosities. With the present X-ray data we are unable to discuss any further the difference in temperature between these two distant clusters which have nonetheless many similarities. The highly spatially resolved X-ray spectroscopy and high throughput that Chandra and XMM will provide are needed to clarify this problem as well as to study in detail distant clusters of galaxies.
6 Summary and Conclusions
We have presented and discussed BeppoSAX observations of two high redshift clusters of galaxies: MS 2053.70449 at and RXJ 0152.71357 at .
The first object has been selected from the EMSS sample. No constraints on the metallicity can be derived from the present data; by fixing the abundance to 0.3 solar we measure a gas temperature with very high uncertainty ( keV).
The second cluster has been selected from the RDCS sample and is one of the most X-ray luminous system known at . It is characterized by a complex morphology (both in the optical and soft X-ray) with at least two cores, a gas temperature of keV and a metallicity of (68 % confidence interval). A prominent iron Kα line is clearly visible in the MECS spectrum.
In light of this new cluster temperature measurement at , we have discussed the high redshift () relationship and we have found that the limited data available so far can easily be accommodated with a non-evolving (or mildly evolving) relation. This result, when combined with the little observed evolution in the X-ray cluster abundance, gives support to cosmological models with a low density parameter (e.g. Borgani et al., 1999).
Acknowledgements.
RDC and IMG are greateful to T. Maccacaro for the continuous support and encouragement since the early phases of this work. M. Hattori provided us with unpublished data for AXJ 20191127. We thank G. Chincarini, C. Lobo, A. Wolter and G. Zamorani for a careful reading of the paper and useful comments. We thank the BeppoSAX SDC, SOC and OCC teams for the successful operation of the satellite and preliminary data reduction and screening. This research has made use of SAXDAS linearized and cleaned event files produced at the BeppoSAX Science Data Center. IMG acknowledges partial financial support from NSF AST95-00515, from NASA-STScI GO-06668.02-95A and from CNR-ASI grants.References
- Boella et al (1997) Boella, G. et al. 1997, A&AS 122, 327
- Borgani et al., (1999) Borgani, S., Rosati, P., Tozzi, P., & Norman, C. 1999, ApJ, 517, 40
- Burke et al (1997) Burke, D.J., Collins, C.A., Sharples, R.M., Romer, A.K., Holden, B.P., Nichol, R.C., 1997, ApJ, 488, L83
- Chiappetti et al (1998) Chiappetti L., Cusumano G., Del Sordo S., et al., 1998, in ”The Active X-ray Sky”, L. Scarsi, H. Bradt, P. Giommi, F. Fiore (Eds.), Nuclear Physics B Proc. Suppl. 69/1-3, 610
- Clowe (1998) Clowe, D.I., 1998, PhD Thesis, University of Hawaii
- Clowe et al (1999) Clowe, D.I., Luppino, G.A., Kaiser, N. & Gioia, I.M., 1999, ApJ, submitted.
- Crawford and Fabian (1996) Crawford, C.S. & Fabian, A.C., 1996, MNRAS, 282, 1483
- Deltorn et al (1997) Deltorn, J-M, Le Fèvre , O., Crampton, D. & Dickinson, M., 1997, ApJ, 483, L21
- Dickey and Lockman (1990) Dickey, J.M. & Lockman, F.J., 1990, ARAA, 28, 215
- Dickinson (1997) Dickinson, M.D., 1997, in “The Early Universe with the VLT”, Ed. J. Bergeron, Berlin, Springer, p.274
- Donahue (1996) Donahue, M., 1996, ApJ, 468, 79
- Donahue et al (1998) Donahue, M., Voit, G.M., Gioia, I.M., Luppino, G.A., Hughes, J.P., and Stocke, J.T., 1998, ApJ, 502, 550
- Donahue et al (1999) Donahue, M., Voit, G.M., Scharf, C.A., Gioia, I.M., Mullis, C.R., Hughes, J.P., and Stocke, J.T., 1999, ApJ, in press, astro-ph/9906295
- Donahue and Voit (1999) Donahue, M., & Voit, G.M., 1999, ApJ, in press, astro-ph/9907333
- Ebeling et al., (1999) Ebeling, H., et a., 1999, ApJ, submitted.
- Eke et al., (1996) Eke, V.R., Cole, S., and Frenk, C.S., 1996, MNRAS, 282,263
- Fiore et al (1999) Fiore F., Guainazzi, M. & Grandi P. 1999, technical report, ftp://www.sdc.asi.it/pub/sax/doc/software_docs/ saxabc_v1.2.ps.gz
- Frontera et al (1997) Frontera F., Costa E., Dal Fiume D., et al., 1997, A&AS 122, 357
- Gioia and Luppino (1994) Gioia, I.M. & Luppino, G.A., 1994, ApJS, 94, 583
- (20) Gioia, I.M., Maccacaro, T., Schild, R.E., Wolter, A., Stocke, J.T., Morris, S.L. & Henry, J.P. 1990, ApJS, 72, 567
- Gioia et al (1999) Gioia, I.M., Henry, J.P., Mullis, C.R., Ebeling, H., & Wolter, A. 1999, ApJ, in press, astro-ph/9902277
- (22) Hattori, M., Ikebe, Y., Asoaka, I., et al., 1997, Nature, 388, 146.
- Henry et al. (1992) Henry, J.P., Gioia, I.M., Maccacaro, T., Morris, S.M., Stocke, J.S. & Wolter, A., 1992, ApJ, 386, 408
- HB (98) Huges, J.P. & Birkinshaw, M., 1998, ApJ, 501, 1
- Henry, (1999) Henry, J.P., 1999, ApJ, submitted.
- Kelson et al (1997) Kelson, D.D., van Dokkum, P.G., Franx, M., Illingworth, G.D., & Fabricant, D., 1997, ApJ, 478, L13
- Luppino and Gioia (1992) Luppino, G.A. & Gioia, I.M., 1992, A&A, 265, L9
- Luppino et al (1999) Luppino, G.A., Gioia, I.M., Hammer, F., Le Fèvre , O. & Annis, J.A., 1999, A&AS, 136, 117
- Manzo et al (1997) Manzo G., Giarrusso S., Santangelo A., et al., 1997, A&AS 122, 341
- Markevitch (1998) Markevitch, M., 1998, ApJ, 504, 27
- Mullis et al (1998) Mullis, C.R. Gioia, I.M. and Henry, J.P., 1998, IAU Symposium 188 “The Hot Universe”, Eds. K. Koyama, S. Kitamoto & M. Itoh, pages 473-474
- Mushotzky and Loewenstein (1997) Mushotzky, R., & Loewenstein, M., 1997, ApJ, 481, L63
- Mushotzky and Scharf (1997) Mushotzky, R., & Scharf, C., 1997, ApJ, 482, L13
- Navarro et al (1996) Navarro, J.F., Frenk, C.S., & White, S.D.M. 1996, ApJ, 462, 563
- Oke et al (1995) Oke, J.B., Cohen, J.G., Carr, M., Cromer, J., Dingizian, A., Harris, F.H., Labrecque, S., Lucinio, R., Schall, W., Epps H., and Miller, J. 1995, PASP, 107, 375
- Parmar et al (1997) Parmar A.N., Martin D.D.E., Bavdaz M., Favata, F., Kuulkers, E., Vacanti,, G., Lammers, U., Pecock, A., & Taylor, B. G., 1997, A&AS 122, 309
- Parmar et al (1998) Parmar A.N., Oosterbroek T., Orr A., et al., 1999, A&A submitted
- Peebles et al (1989) Peebles, P.J.E., Daly, R. & Juskeiewicz, R., 1989, ApJ, 347, 563
- Press and Schechter (1974) Press, W. & Schechter, P., 1974, ApJ, 187, 425
- Raymond and Smith (1977) Raymond J.C. & Smith B.W., 1977, ApJS 35, 419
- (41) Romer, A.K., Nichol, R.C., Holden, B.P., et al., 1999, astroph-9907401.
- Rosati et al (1995) Rosati, P., Della Ceca, R., Burg, R., Norman, C. & Giacconi, R., 1995, ApJ, 445, L11
- Rosati et al (1998) Rosati, P., Della Ceca, R., Norman, C. & Giacconi, R., 1998, ApJ, 492, L21.
- Rosati et al (1999) Rosati, P., Stanford, A.S., Eisenhardt, P.R., Elston, R., Spinrad, H., Stern, D. & Dey, A., 1999, AJ, in press, astro-ph/9903381
- Scharf et al (1997) Scharf, C.A., Jones, L.R., Ebeling, H., Perlman, E., Malkan, M. & Wegner, G., 1997, ApJ, 477, 79
- Smail and Dickinson (1995) Smail, I. & Dickinson, M., 1995, ApJ, 455, L99
- van Haarlem et al (1997) van Haarlem, M.P., Frenk, C.S. & White, S.D.M, 1997, MNRAS, 287, 817
- Vikhlinin et al (1998) Vikhlinin, A., McNamara, B.R., Forman, W., Jones, C., Quintana, H. & Hornstrup, A., 1998, ApJ, 502, 598
- Wu et al (1999) Wu, X-P., Xue, Y-J., & Fang, L-Z., ApJ, 524, 22.