Three-micron imaging of the Hubble Deep Field11affiliation: Based on observations made at the W. M. Keck Observatory, which is operated jointly by the California Institute of Technology and the University of California; and with the NASA/ESA Hubble Space Telescope, which is operated by AURA under NASA contract NAS 5-26555.
Abstract
Images of the Hubble Deep Field at , taken with the 10-m Keck Telescope, are presented. The images cover a total area of . To a 5-sigma limit of (Vega-relative), 11 sources are detected, 9 of which are extragalactic. The integrated galaxy number counts are therefore to this depth. The galaxies detected at have a median redshift of . All sources have , and visual counterparts, all of fairly regular morphologies; several also have , , , , or counterparts. No sources are found which are either anomalously red or anomalously blue in their color, and there are significant detections of most of the known near-infrared HDF sources for which detection in these data seemed likely.
1 Introduction
Until now, it has been impractical to make wide-field ground-based surveys at infrared wavelengths longer than . Although the atmosphere is transparent in wavelength windows in the near infrared out to , sky brightness increases rapidly with increasing wavelength. Detector area is limited by the need to read out quickly before saturation. The Near Infrared Camera (NIRC; Matthews & Soifer 1994) on the 10-m W. M. Keck Telescope, however, is equipped with a fast readout mode which allows it to read out its entire array quickly enough to avoid saturation in a short-wavelength -band filter, centered on .
The bandpass is complementary to the standard near-infrared , , and (, and ) bandpasses in a number of respects. It admits light at the rest-frame wavelengths of these bandpasses at redshifts of 1.7, 1.0, and 0.5, so observations of intermediate and high-redshift galaxies can be compared directly to local analogs observed in the standard bandpasses. The bandpass can be used to extend the near-infrared spectral energy distributions (SEDs) to longer wavelengths. While stellar populations are made up of a superposition of basically thermal radiators, nuclear activity tends to be redder than thermal (in the near infrared, bluer in the visual) and thus ought to become more prominent in redder bandpasses. Nuclear activity may also heat nuclear dust to produce additional near-infrared emission (eg, Peletier et al 1999). In units of , the SEDs of normal galaxies peak at , primarily due to a minimum in H- opacity in stellar atmospheres. At , this peak is redshifted to . A “non-evolving” elliptical galaxy at redshift ought to appear as a mag source at . At , old stellar populations are to mag brighter than young stellar populations with the same apparent magnitude (Coleman et al 1980, Aaronson 1977).
This paper presents the results of deep imaging of the Hubble Deep Field (HDF; Williams et al 1996) in the bandpass with NIRC. Although neither the sky coverage nor the number of detected sources is large, to our knowledge this is the first deep near-infrared survey at wavelengths beyond the band. It extends the SEDs of HDF sources over a decade in wavelength from the F300W bandpass at . The choice of the HDF for deep imaging in this new bandpass was clear: The HDF is currently the most well-studied field on the sky, deeply imaged by almost every astronomical technique.
In what follows, all magnitudes are Vega-relative.
2 Observations and reduction
The filter on NIRC was chosen for this study. The filter passes light in the wavelength range . When combined with typical atmospheric absorption conditions on Mauna Kea, the bandpass is concentrated in the wavelength range , with a small “blue leak” ( of the total transmission function) in a narrow peak at . The central wavelength is for the filter plus atmosphere transmission function; for this reason, magnitudes with this instrument and filter setup will be denoted . The filter is currently the longest-wavelength bandpass in which NIRC can read out its full () field area without saturation from sky brightness alone. A source with in the bandpass has a flux density of 330 Jy. This approximate zeropoint is an interpolation between measured and -band zeropoints, and is uncertain by no more than 10 percent.
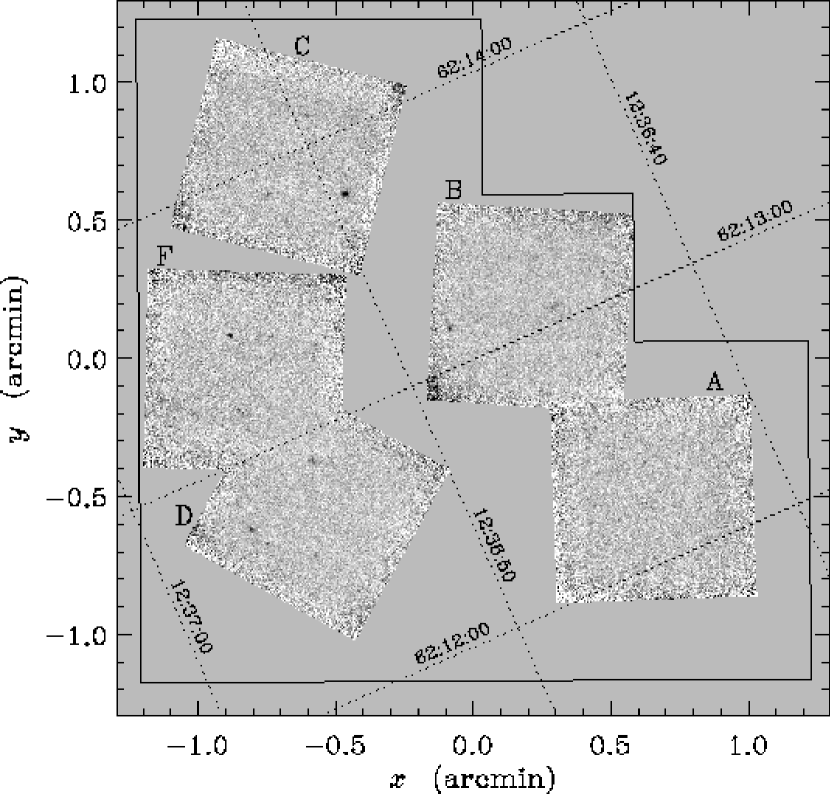
The selection of the HDF for deep study with HST is described elsewhere (Williams et al 1996). Within the HST-imaged portion of the HDF, a set of subfields were chosen for deep study with NIRC. These subfields were not chosen with regard to any particular “interesting sources.” Rather, one subfield was chosen to lie roughly in the center of each WFPC2 CCD chip image, subject to guide star constraints (these are the primary subfields A, B, C, and D), and additional subfields were chosen to fill in the gaps between these four primary subfields. In the end, telescope time and weather restricted our study to five subfields, the primary four and subfield F, which lies between subfields C and D. The well-observed solid angle is roughly per subfield (given dithering) or a total of . The layout of the subfields is shown in Figure 1, relative to the HST-imaged field.
Air mass of the observations ranged from 1.40 to 1.75. The conditions were clear and apparently photometric for all nights, although there was some variation in the sky brightness. Each individual exposure consisted of 1000 (or, occasionally, 2000) 0.025 s or 0.029 s integrations coadded into a single image in hardware. A visual imaging offset guider pointing at a star maintained the tracking of the telescope. The observations were taken in half-hour or hour-long sets with random dithers over a range. The photometric sensitivity was determined by measuring faint standard stars (Elias et al 1982, Persson et al 1998) roughly once per hour during each night. During several of the nights, the measured sensitivity (corrected for airmass) varied in an apparently linear way with time. The subfield most affected by this was subfield A, which shows no significant sources (see below), so the variation in this subfield does not affect the results. The scatter of the individual standard-star measurements around the linear sensitivity trends is , but for the other four subfields, the trends themselves range between for subfield D and for subfield F. The uncertainty in the photometric calibration is thus no better than , but may be worse if the linear trends represent a serious photometric problem. The observing dates, integration times, and sensitivities of the final, stacked images of the subfields are given in Table 1.
The data were processed by subtracting an average of the two adjacent images (before and after) from each image to eliminate artifacts introduced by varying sky brightness and field rotation resulting from the alt–azimuth configuration of the Keck Telescope. Because the individual images show no significant sources above the sky noise, registration of the individual images was accomplished with telescope coordinates as computed from the positions of the star in the guider camera. The individual registered images were averaged, after dark subtraction and flat-fielding, to produce the final images shown in Fig 1. The pixel-to-pixel rms values in the central parts of the images correspond to mag in ; the specific values for each subfield are given in Table 1.
Because there are so few sources visible per subfield (none for subfield A), determination of the seeing is difficult. Seeing values given in Table 1 are determined by comparison of the sources in the final, stacked images to their visual counterparts in the WFPC2 image of the HDF taken in the F814W bandpass (Williams et al 1996); they are necessarily quite uncertain. Since in several fields (especially F) the seeing in the final, stacked image is apparently worse than that for the standard stars, some of the seeing must arise from poor registration of the frames coadded in the stacks.
For visual images, the “version 2” reductions of the HST/WFPC2 imaging of the HDF were used. Details of the data acquisition, reduction, and sensitivities are given elsewhere (Williams et al 1996). For brevity, the F300W, F450W, F606W, and F814W bandpasses will be referred-to here as , , , and , although F300W and F606W are substantially different from conventional and .
For other near-infrared data, the “version 1.04” reductions of the imaging of the HDF taken with the NICMOS instrument on HST were used. Details of the data acquisition, reduction, and sensitivities are given elsewhere (Dickinson et al 2000). For brevity, the F110W and F160W bandpasses will be referred-to here as and , although F110W is substantially bluer than standard . The photometric sensitivities of the and data are uncertain at the percent level.
3 Source selection and photometry
Sources were identified in the image by requiring a positive deviation of greater significance than inside a focal-plane aperture of diameter in the final, stacked images of the subfields. The noise levels were estimated by measuring fluxes in randomly placed apertures, so they correctly take into account any pixel-to-pixel correlations. At significances less than , it was established that the sources had visual and near-infrared counterparts in the HST images. No deviations failed to show counterparts, except at the very edges of the subfields, where the noise and background flatness are degraded. A total of 11 sources were selected. The total area subject to source detection is roughly .
Total magnitudes for the sources selected at were estimated by measuring aperture magnitudes in focal-plane apertures of diameter and then correcting for the small size of the aperture. The aperture was chosen to be small enough to reduce the background at but large enough to reduce variations in photometric sensitivity measured from the standard stars to below . The aperture corrections were determined under the assumption that there are only small color gradients in color, by comparing and diameter aperture magnitudes in the very high signal-to-noise -band image, smoothed to the seeing of the image. (The one exception is the star at +, for which a diameter aperture was used in order to avoid light from the neighboring bright galaxy.) Aperture and total magnitudes for the sources are given in Table 2. The uncertainties given in Table 2 are based only on the photon statistics and the uncertainties in determining the sky level, and do not include uncertainties in the photometric sensitivity. No estimate is made for the uncertainties in the aperture corrections. These may be considerable, if the seeing estimates are in error, if there are significant color gradients, or if there is significant light outside of the diameter aperture.
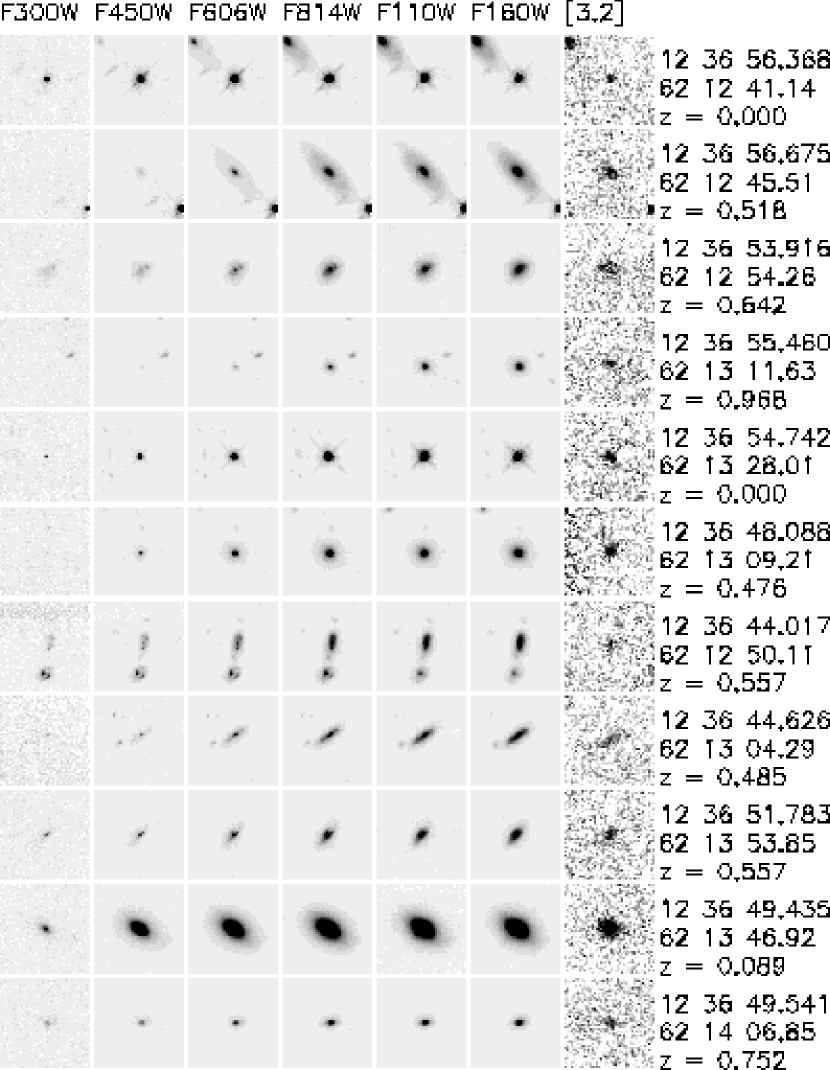
Colors were measured in diameter focal-plane apertures in the visual WFPC2 and near-infrared NICMOS images, smoothed to the seeing of the images. The aperture size was chosen so the colors were measured in the regions of the sources which are well-measured at . The colors are given in Table 3. The photon and read-noise contributions to the uncertainties in the color measurements are at or below the level for the all the visual and near-infrared colors except for where the uncertainties are dominated by the uncertainty in given in Table 2 and where the uncertainties are at the to mag level, depending on -band flux. Although the NICMOS and measurements have a very high signal-to-noise ratio, the photometric sensitivities are uncertain at the percent level (Dickinson et al 2000). Figure 2 shows and colors for the galaxies as a function of redshift. Figure 3 shows the visual and near-infrared counterparts of all the sources.
Absolute RA and Dec positions were assigned to the sources under the assumption that the absolute astrometry of the visual HST images of the HDF (Williams et al 1996) is correct. These absolute positions are given in Table 2.
4 Comparison with other HDF catalogs
The catalog selected at can be compared with other catalogs made in the HDF at other wavelengths or with other techniques. The redshifts and flux densities at other wavelengths discussed in this Section are presented in Tables 3 and 4.
Redshifts were found by comparing the coordinates of the sources with the lists of redshifts obtained in the Hubble Deep Field with the Keck Telescope (Cohen et al 1996; Lowenthal et al 1997; Cohen et al 2000). Two of the sources are Galactic stars, consistent with their stellar appearance on the HST images.
Flux densities in the band () were found by matching the absolute positions of the sources with the positions of the sources from the -selected catalog of Hogg et al (2000). Flux densities at and were found by matching with the catalogs made from imaging data from the Infrared Space Observatory (Aussel et al 1999; based on data from Serjeant et al 1997). Flux densities at were taken from the catalog made from the SCUBA instrument at JCMT (Hughes et al 1998), although the sources were identified in part through comparing positions derived from observations (Richards 1999a). Flux densities at and were found by matching positions in catalogs made with VLA data at these frequencies (Richards et al 1998; Richards 1999b).
The detection fraction at of known near-infrared sources was tested by identifying sources in the NICMOS/HDF catalogs (Dickinson et al 2000) satisfying
| (1) |
which corresponds to an approximate linear extrapolation (in log-log space) of the and magnitudes to . (This equation is roughly appropriate for predicting the fluxes of galaxies and nuclear emission, since both have SEDs which resemble power-laws at (observed) at the redshifts of interest.) All nine sources inside the region of the HDF well-observed at with have counterparts in the catalog selected at , and of the the six sources in the well-observed region with , two have counterparts in the catalog.
5 Results
Images of the Hubble Deep Field at , taken with the 10-m Keck Telescope were presented, representing the first near-infrared survey of the distant Universe at wavelengths beyond the band. The images cover a total area of .
To a 5-sigma limit of (Vega-relative), 11 sources are detected, 9 of which are extragalactic. The integrated galaxy number counts are therefore to this depth. The sources detected at have a median redshift of .
All sources have , and visual counterparts. No sources are found which are either anomalously red or anomalously blue in their or colors. In Figure 2, the source colors are compared with no-evolution predictions, based on observations of local galaxies (Coleman et al 1980, Aaronson 1977) and simple models of the filter transmission curves. Although the sources selected at are among the reddest visually-selected galaxies, they are blue relative to no-evolution predictions. The blue colors are likely a consequence of higher star formation rates at intermediate redshift than in the present-day Universe, as has been inferred, among other ways, from metallicity in Lyman-alpha clouds (Pei & Fall 1995), ultraviolet luminosity density (Lilly et al 1996; Connolly et al 1997; Madau et al 1998) and emission line strengths (Hammer et al 1997; Heyl et al 1997; Small et al 1997; Hogg et al 1998). The lack of very red sources does not constrain the abundance of “extremely red objects” (EROs) because, at the magnitudes of interest, the angular number density of EROs is on the order of (Hu & Ridgeway 1994; Thompson et al 1999).
The morphologies of the sources in the visual and near-infrared bandpasses are shown in Figure 3. The sample is small, but they appear fairly regular, with some showing nearby neighbors or evidence for mild interaction.
Comparisons with surveys of the HDF at other wavelengths show that all of the sources have counterparts, one has a counterpart, several have counterparts, one has a likely counterpart, and two have counterparts. Furthermore, there are detections of the majority of sources which, on the basis of their and photometry, ought to have been detected.
In short, the imaging of the HDF shows no great surprises. It does demonstrate that it is possible, with significant telescope time, to perform studies of normal galaxies at high redshifts in the band of atmospheric transmission.
References
- (1) Aaronson M., 1977, PhD thesis, Harvard University
- (2) Aussel H., Cesarsky C. J., Elbaz D., Starck J. L., 1999, A&A 342 313
- (3) Cohen J. G., Cowie L. L., Hogg D. W., Songaila A., Blandford R., Hu E. M., Shopbell P., 1996, ApJ 471 L5
- (4) Cohen J. G., Hogg D. W., Blandford R. D., Cowie L. L., Hu E., Songaila A., Shopbell P., Richberg K., 2000, ApJS submitted
- (5) Coleman G. D., Wu C.-C., Weedman D. W., 1980, ApJS 43 393
- (6) Connolly A. J., Szalay A. S., Dickinson M., Subbarao M. U. & Brunner R. J., 1997, ApJ 486 L11
- (7) Dickinson M. E., 2000, in preparation
- (8) Elias J. H., Frogel J. A., Matthews K., Neugebauer G., 1982, AJ 87 1029
- (9) Hammer F., Flores H., Lilly S. J., Crampton D., Le Fèvre O., Rola C., Mallen-Ornelas G., Schade D. & Tresse L., 1997, ApJ 481 49
- (10) Heyl J., Colless M., Ellis R. S. & Broadhurst T., 1997, MNRAS 285 613
- (11) Hogg D. W., Neugebauer G., Armus L., Matthews K., Pahre M. A., Soifer B. T., Weinberger A. J., 1997, AJ 113 474 (erratum AJ 113 2338)
- (12) Hogg D. W., Cohen J. G., Blandford R. & Pahre M. A., 1998, ApJ 504 622
- (13) Hogg D. W., Pahre M. A., Adelberger K. L., Blandford R., Cohen J. G., Gautier T. N., Jarrett T., Neugebauer G., Steidel C. C., 2000, ApJS in press
- (14) Hu E. M., Ridgeway S. E., 1994, AJ 107 1303
- (15) Hughes D. H. et al, 1998, Nature 394 241
- (16) Lilly S. J., Le Fèvre O., Hammer F. & Crampton D., 1996, ApJ 460 L1
- (17) Lowenthal J. D., Koo D. C., Guzman R., Gallego J., Phillips A. C., Faber S. M., Vogt N. P., Illingworth G. D., Gronwall C., 1997, ApJ 481 673
- (18) Madau P., Pozzetti L. & Dickinson M., 1998, ApJ 498 106
- (19) Matthews K., Soifer B. T., 1994, in Infrared Astronomy with Arrays: The Next Generation, Mclean I., ed., Dordrecht: Kluwer, 239
- (20) Pei Y. C. & Fall S. M., 1995, ApJ 454 69
- (21) Peletier R. F., Knapen J. H., Shlosman I., Pérez-Ramírez D., Nadeau D., Doyon R., Espinosa J. M. R., García A. M. P., 1999, astro-ph/9905076
- (22) Persson S. E., Murphy D. C., Krzeminski W., Roth M., Rieke M., 1998, AJ 116 2475
- (23) Richards E. A., Kellerman K. I., Fomalont E. B., Windhorst R. A., Partridge R. B., 1998, AJ 116 1039
- (24) Richards E. A., 1999a, ApJ 513 L9
- (25) Richards E. A., 1999b, ApJ in press
- (26) Serjeant S. B. G. et al, 1997, MNRAS 289 457
- (27) Small T. A., Sargent W. L. W. & Hamilton D., 1997, ApJ 487 512
- (28) Thompson, D. et al., 1999, ApJ 523 100
- (29) Williams R. E. et al, 1996, AJ 112 1335
| name | date | exposure | seeing FWHMaaBecause there are so few significant sources per subfield, the seeing measurements are very uncertain; see text. | at bbThe magnitude is that corresponding to a variation in the sky in a focal-plane aperture of in solid angle, in the central (i.e., full exposure-time) part of the image. |
|---|---|---|---|---|
| (UT) | (s) | (arcsec) | (mag) | |
| NIRC-HDF-A | 1999 April 28 | 13440 | 0.5ccThe seeing FWHM for subfield A is taken from the observations of the standard stars, because there are no significant sources detected in that subfield. | 20.1 |
| NIRC-HDF-B | 1998 February 6 | 11100 | 0.5 | 20.4 |
| NIRC-HDF-C | 1998 February 7 | 9600 | 0.4 | 20.2 |
| NIRC-HDF-D | 1999 April 30 | 9480 | 0.4 | 20.3 |
| NIRC-HDF-F | 1999 April 27 | 11100 | 0.6 | 20.0 |
| RAaaAbsolute positions were found with information from the HST/WFPC2 images (Williams et al 1996). | DecaaAbsolute positions were found with information from the HST/WFPC2 images (Williams et al 1996). | sub- | bbAperture magnitudes are measured in a diameter focal-plane aperture. The quoted uncertainty in magnitude is simply that due to uncertainty in the photon statistics and sky level in the focal-plane aperture. The quoted uncertainty does not take into account uncertainty in overall calibration. | ccTotal magnitudes have been corrected to an effective diameter aperture with information from the image; see text for details. |
|---|---|---|---|---|
| (J2000) | field | (mag) | (mag) | |
| + | B | |||
| + | B | |||
| + | B | |||
| + | C | |||
| + | C | |||
| + | C | |||
| + | D | |||
| + | F | |||
| + | F | |||
| + | D | |||
| + | D | |||
| RA | Dec | aaRedshifts are from Cohen et al (1996), Lowenthal et al (1997), and Cohen et al (2000). Sources with “0.000” in this column are Galactic stars. | bbColors were measured through diameter apertures in images smoothed to match the seeing of the images; see text. The bandpass names stand for (F300W,F450W,F606W,F814W,F110W,F160W). Uncertainties in all colors except and are at or below the level; see text | bbColors were measured through diameter apertures in images smoothed to match the seeing of the images; see text. The bandpass names stand for (F300W,F450W,F606W,F814W,F110W,F160W). Uncertainties in all colors except and are at or below the level; see text | bbColors were measured through diameter apertures in images smoothed to match the seeing of the images; see text. The bandpass names stand for (F300W,F450W,F606W,F814W,F110W,F160W). Uncertainties in all colors except and are at or below the level; see text | bbColors were measured through diameter apertures in images smoothed to match the seeing of the images; see text. The bandpass names stand for (F300W,F450W,F606W,F814W,F110W,F160W). Uncertainties in all colors except and are at or below the level; see text | bbColors were measured through diameter apertures in images smoothed to match the seeing of the images; see text. The bandpass names stand for (F300W,F450W,F606W,F814W,F110W,F160W). Uncertainties in all colors except and are at or below the level; see text | b,cb,cfootnotemark: | |
|---|---|---|---|---|---|---|---|---|---|
| (J2000) | (mag) | (mag) | (mag) | (mag) | (mag) | (mag) | (mag) | ||
| + | 0.557 | ||||||||
| + | 0.485 | ||||||||
| + | 0.476 | ||||||||
| + | 0.089 | ||||||||
| + | 0.752 | ||||||||
| + | 0.557 | ||||||||
| + | 0.642 | ||||||||
| + | 0.000 | ||||||||
| + | 0.968 | ||||||||
| + | 0.000 | ||||||||
| + | 0.518 | ||||||||
| RA | Dec | aaFlux densities at are from Hogg et al (2000) converted to Jy under the assumption that corresponds to . | bbFlux densities at are magnitudes converted under the assumption that corresponds to . | ccUncertainties in color are dominated by the uncertainty in the magnitude. | ccFlux densities at and are from Aussel et al (1999). | ddFlux densities at are from Hughes et al (1998). The value is marked with a question mark because there is more than one possible 1.4 GHz counterpart. | eeFlux densities at and are from Richards et al (1998) and Richards (1999b). | eeFlux densities at and are from Richards et al (1998) and Richards (1999b). | |
|---|---|---|---|---|---|---|---|---|---|
| (J2000) | () | () | () | () | () | () | () | ||
| + | 0.557 | ||||||||
| + | 0.485 | ? | |||||||
| + | 0.476 | ||||||||
| + | 0.089 | ||||||||
| + | 0.752 | ||||||||
| + | 0.557 | ||||||||
| + | 0.642 | ||||||||
| + | 0.968 | ||||||||
| + | 0.518 | ||||||||