High Redshift Clusters and Protoclusters
Abstract
Our understanding of the cosmic history of galaxy clusters has recently been enhanced due to an extensive series of observations including faint spectroscopic data (especially those obtained at the Keck Observatory), deep optical and NIR imaging from the ground and in space, morphological data from HST, and new constraints on the evolution of the intracluster medium from ROSAT and ASCA. When such observations are applied to complete, objectively derived catalogs of clusters, our constraints on cluster formation and evolution become quite confined. A picture is emerging in which the bulk of cluster formation starts at , yielding cluster potentials that are well established by , and there is little substantial evolution of the cluster galaxy population since . This review talk will summarize the current observational constraints on the properties and evolution of high redshift clusters and protoclusters and their implications.
Space Telescope Science Institute
1. Introduction
The evolution of galaxy clusters is quite sensitive to the physical processes which dominate the formation of structure and to the cosmological parameters. Cluster evolution is inherently complex both because clusters are not closed systems and because the 3 main mass components (dark matter, intracluster gas, and galaxies) evolve differently. As a consequence, different cluster parameters evolve on different timescales depending on the thermal and dissipative properties of the mass component(s) which most strongly control each cluster parameter. Furthermore, it is becoming evident that the process of cluster formation extends over a moderately broad range in redshift. Given the complexity of the problem, breakthroughs in understanding the formation and evolution of clusters of galaxies must rely on observations spread over a large range of wavelength and redshift.
With the advent of the Keck 10m telescopes, the restored resolution of HST imagery, improvements in IR arrays, and the enhanced x-ray imaging and spectroscopic capabilities of ROSAT and ASCA, constraints on the properties of the ICM and the cluster galaxy population have been extended out to and beyond. Indeed, cluster candidates have been identified out to (see Table 1). The large temporal baseline these data cover now allow much tighter constraints on scenarios for cluster evolution.
2. Search Strategies
The most distant cluster candidates have been found by conducting searches in the vicinity of high-z radio galaxies or quasars. The evidence for the presence of a cluster in these cases is typically based on fewer than 5 spectroscopically confirmed members plus a statistical excess of red galaxies or Ly emitters.
Table 1. Examples of Cluster Candidates
| Name | Redshift | Reference |
|---|---|---|
| MRC 0316-257 | 3.14 | Le Fevre et al. 1996 |
| QSO 0953+545 | 2.50 | Malkan et al. 1996 |
| QSO 1312+4237 | 2.50 | Campos et al. 1999 |
| 53W002 | 2.39 | Pascarelle et al. 1995 |
| QSO 2139-4434 | 2.38 | Francis et al. 1996 |
| 3C294 | 1.79 | Dickinson et al. 1999 |
| RXJ0848+4453a | 1.27 | Stanford et al. 1997; Rosati et al. 1999 |
| 3C324 | 1.21 | Dickinson 1997 |
| AXJ2019+112 | 1.01 | Benitez et al. 1998 |
| 3C184a | 1.00 | Deltorn et al. 1997 |
a Spectroscopic confirmation based on more than 10 ’s
Hall & Green (1998) have also performed a search around a sample of radio-loud quasars and have identified 31 possible clusters in the range . The physical properties of cluster candidates are not well quantified because of the limited amount of spectroscopic data available to date. While looking for clusters in the vicinities of radio galaxies or quasars is fruitful, the resulting samples will naturally suffer from selection effects associated with limiting ones search to such interesting environments. None the less, it appears that overdensities which may be the progenitors of present day clusters exist at (% of the current age of the universe).
A more complete picture of the properties of high-redshift clusters can be obtained at through objective searches of wide areas of sky in optical, NIR, and x-ray passbands. The advantage of x-ray cluster selection is two-fold: 1) emission from the hot intracluster medium (ICM) directly indicates the presence of a gravitationally bound system and 2) the ICM comprises 70 to 80% of the cluster’s baryonic mass. Nearly all x-ray selected high- clusters are rich and elliptical dominated. The Extended Medium Sensitivity Survey (EMSS; Gioia et al. 1990a; Henry et al. 1992) has been used to identify clusters out to over an area of deg2 and the ROSAT Distant Cluster Survey (RDCS; Rosati et al. 1998) has been used to find systems out to over an area of deg2. The RDCS, in particular, includes 100 spectroscopically confirmed clusters. Of these, 33% have and 25% have (Rosati 1998). While past x-ray telescopes have had fairly low effective areas, new observatories, like XMM, will provide at least an order of magnitude improvement. Equally exciting are developments in the use of the Sunyaev-Zeldovich Effect to locate clusters. Mohr et al. (1999) indicate that SZE facilities in the near future will be able to detect clusters per year.
Searching for distant clusters in the optical and NIR, however, also has significant advantages. From a practical point of view, there are more telescopes and larger area mosaic cameras available in the optical/NIR than in x-rays. Optical/NIR searches will also find clusters spanning a wider range of x-ray luminosity and total mass (e.g., Holden et al. 1997). Although the spurious detection rate at high- can be %, the use of photometric redshifts can dramatically reduce the number of false positives. Some of the largest area and deepest optical/NIR distant cluster surveys include the Palomar Distant Cluster Survey (5.1 deg2; Postman et al. 1996), the ESO Imaging Survey (12 deg2; Scodeggio et al. 1999) The Deeprange Survey (16 deg2; Postman et al. 1998), and the NOAO Deep-Wide Survey (18 deg2; Jannuzi & Dey 1999).
An optimal strategy, of course, is to combine x-ray and optical/NIR data obtained over the same region of sky. This allows a full assessment of the selection biases to be made and is likely to reveal subtle effects which can be important in interpreting, for example, the abundance of high- clusters. The benefits of such joint searches are already being realized: Scharf et al. (1999) used 22 deep ROSAT PSPC fields as targets for deep optical imaging to study the effects of optical and x-ray selection on derived cluster evolution and to look for correlations in the large-scale distribution of diffuse x-ray emission and the galaxy distribution. Preliminary results include the possible first direct detection of x-ray emission from an intercluster filament at . Stanford et al (1997) and Rosati et al (1999) have identified a supercluster at in the Lynx field which was initially detected in the NIR (K-band) and, subsequently, in x-rays.
3. Cluster Abundance
The abundance of clusters as a function of redshift is one of the fundamental constraints on both structure formation and cosmological models. The space density of clusters at , for example, is highly sensitive to (Bahcall, Fan, & Renyue 1997; Donahue & Voit 1999). Present observational constraints from x-ray surveys (followed up by optical spectroscopy) indicate that the comoving space density of clusters per unit is invariant out to at least for systems with erg sec-1 (Henry et al. 1992; Rosati et al. 1998). For more luminous (massive) clusters, mild negative evolution has been reported (Gioia et al. 1990b; Henry et al. 1992; Vikhlinin et al. 1998) although the deficit, expressed in absolute numbers, is only a dozen or so EMSS clusters at (small enough that one might worry about subtle selection biases at low x-ray surface brightness levels in the existing surveys). The distribution of poor to moderately rich optically selected clusters is also consistent with a constant comoving space density to at least (Postman et al. 1996; Holden et al. 1998).
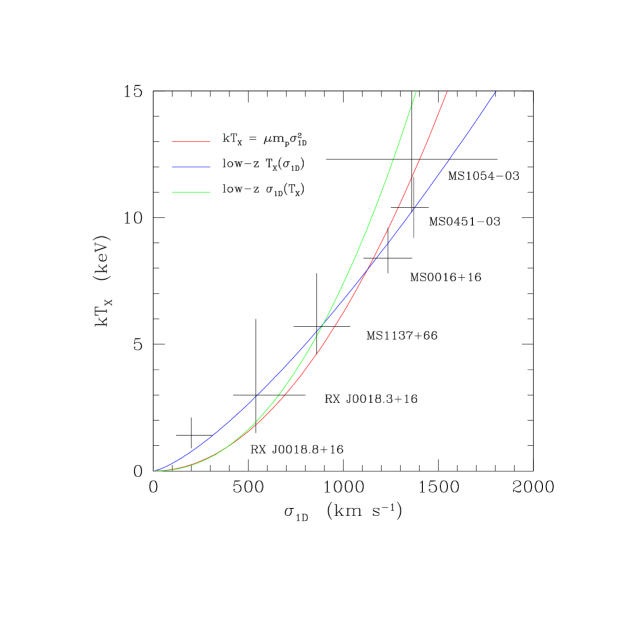
At , our constraints on cluster abundances presently suffer from a lack of data. There are at least 5 known clusters with that have velocity dispersions in the range km sec-1. At least two of these, MS-1137 () and MS-1054 (), have relatively high kinetic gas temperatures () – 5.7 keV and 12.4 keV, respectively (Donahue et al. 1998, 1999). The existence of massive ( M⊙) clusters at is, thus, no longer in doubt. Interestingly, the space density of clusters inferred from the RDCS coverage of the Lynx region is Mpc-3 (Rosati 1999), within a factor of 2 of the density structures delineated by Lyman break galaxies (Steidel et al. 1998). Whether this is indicative of an evolutionary connection or mere coincidence remains to be decided.
4. Evolution of the Gravitational Potentials of Clusters
The evolution of the ICM and its correlation with global cluster kinematics provide direct constraints on the growth of the gravitational potentials which we call clusters. The relationship between and in low- clusters is remarkably tight but is somewhat steeper than that predicted by bremsstrahlung emission from a population of virialized, structurally identical clusters with constant gas fraction (Arnaud & Evrard 1999). However, with reasonable constraints on cluster structure, the same authors find the fractional variation in cluster gas fraction is %. Mushotsky & Scharf (1997) demonstrate that the relationship exhibits no significant evolution out to . Donahue et al. (1999) have extended this work out to : if the evolution of the relation is parameterized as , then they find that is rejected with greater than confidence (for ). Values of would be required to explain the lack of evolution in the x-ray luminosity function cited above if . Donahue et al. (1998) have further shown (see Figure 1) that the relation between the cluster velocity dispersion () and is invariant out to . Cluster potentials are clearly well established in the universe by and, on average, the x-ray properties of the ICM are similar to those in current epoch clusters.
The distribution of the optically luminous mass in clusters, as delineated by the member galaxies, may be experiencing more recent evolution than the ICM. Clusters exhibit significantly more asymmetry in their galaxy distribution at than at the present epoch (Lubin & Postman 1996) – the observed profiles are inconsistent with azimuthal symmetry at the 99.9% confidence level, in strong contrast with the situation at . In some cases, like MS-1054, the clumpiness seen in the galaxy distribution is also seen in the x-ray brightness distribution (Donahue et al. 1998) and in a mass map based upon weak lensing distortions (Hoekstra, Franx, & Kuijken 1999) – characteristic of recent merger activity. Indeed, mergers of group-size clumps at may be the origin of some of the current epoch richness class 1 and 0 clusters (Lubin et al. 1998; Gioia et al. 1999). However, the majority of the known high- clusters appear to have been in existence since at least , as observations discussed below suggest.
5. Constraining the Epoch of Cluster Formation
The processes which control the formation of clusters leave observable signatures in the evolution of the morphological and spectrophotometric properties of cluster galaxies. This is a key reason why observational work in this area has been a major component of recent extragalactic telescope programs. The evolution of the mass function of cluster galaxies, in particular, provides critical constraints on and tests of cluster formation scenarios. At high-, cluster galaxy mass determinations are difficult to obtain but the K-band cluster galaxy luminosity function (KLF) can provide a reliable substitute because it probes the total stellar mass component and is not strongly sensitive to the instantaneous star formation rate (e.g., see Gavazzi, Pierini, Boselli 1996). De Propris et al. (1999) have derived the KLF for 38 clusters at . Their main result is that the KLF departs from no-evolution predictions at however the changes observed are consistent with simple, passive evolution (aging of the existing stellar population) and a narrow formation epoch around (if ) or (if ).
Comparison of the broadband colors and spectral features of the early type cluster members at with spectral synthesis models suggests these galaxies are old (mean ages Gyr, at the observed redshifts) implying a relatively early formation at as well (e.g., Bower, Kodama, Terlevich 1998; Postman, Lubin, Oke 1998; Stanford, Eisenhardt, Dickinson 1998). Such observations also suggest that the mass-to-light ratios of the early type cluster galaxies have evolved passively since at least (Kelson et al. 1997; van Dokkum et al. 1998). Taken in concert with the results on the KLF evolution, one may conclude that the mass function of cluster galaxies has remained roughly invariant since .
An additional constraint of the duration of the cluster galaxy formation era comes from the optical/NIR color-magnitude relations for the red galaxy population which are well-defined and exhibit remarkably low scatter in clusters from (Stanford, Eisenhardt, Dickinson 1998). This places a stringent constraint on their formation synchronicity of Gyr (roughly the time between and in a cosmology). The coeval nature of cluster elliptical evolution is also reflected in observations which are consistent with exponentially decaying star formation rates with relatively short -folding times ( Gyr; Postman, Lubin, Oke 1998).
There is some evidence (Fuller, West, Bridges 1999) that the brightest cluster galaxies are preferentially aligned with the global cluster galaxy distribution, an effect also suggestive of an early formation epoch.
The metallicities of cluster ellipticals in the redshift range are consistent, on average, with the close to solar values observed in current epoch ellipticals. Similarly, there does not appear to have been much change in the metallicity of the ICM ( solar) between now and (Donahue et al. 1999). This suggests reprocessing of the baryonic mass component of clusters had been on-going for a few Gyr prior to current lookback time. Hierarchical models do predict, however, that some star formation activity should be occurring in clusters since . This is indeed seen in the spiral members and in the surrounding field galaxy population. For example, the fraction of cluster members with strong OII emission (EW 15Å), a reliable star formation indicator, increases by a factor of 3 - 4 between now and (Balogh et al. 1998; Postman, Lubin, Oke 1998). The percentage of cluster galaxies with post-starburst spectral features increases nearly tenfold between now and (Dressler et al. 1999).
6. Evolution of the Morphological Mix
Using the high angular resolution imaging provided by the Hubble Space Telescope, several teams (e.g., Dressler et al. 1997; Oemler et al. 1997; Smail et al. 1997; Lubin et al. 1999) have conducted morphological surveys of clusters in from . Upon comparison with similar ground-based studies of low- clusters, it appears that the distribution of cluster galaxy morphologies has undergone rather substantial evolution between but remains relatively invariant between and the present epoch. One indicator that has been used to gauge the evolution is the ratio of the number of lenticulars (S0) to ellipticals in the central regions of clusters. Figure 2 summarizes the current constraints on the redshift dependence of the S0/E ratio in clusters observed by Dressler et al. 1997 (D97) and Lubin et al. 1999.
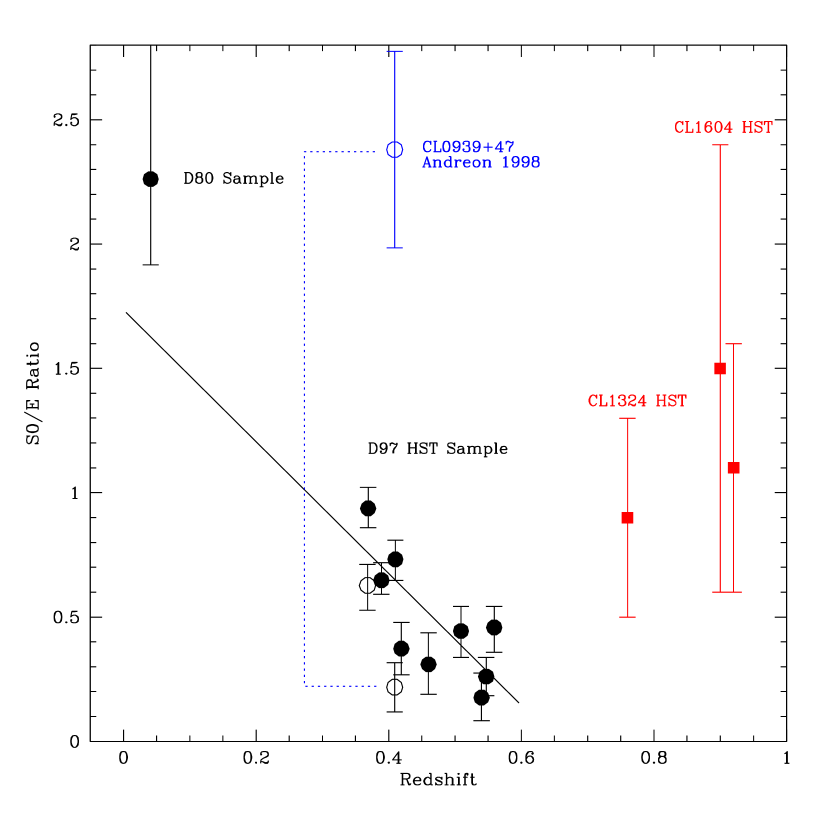
Although the D97 results have been widely cited as evidence for substantial morphological evolution even since , re-analysis of the data by Andreon (1998) and new data at higher from Lubin et al. 1999 suggest that the metamorphosis may not be as dramatic as originally thought. However, the high- data from Lubin et al. also find that the while ellipticals still preferentially reside in the highest density environments, the Spiral/S0 morphology-density relation at is much less well-defined than it is now.
There is further evidence that morphological modifications are occurring at least as recently as : Dressler et al. (1999) find that the OII equivalent widths, for a given morphological type, are lower in cluster galaxies than in the field and that the actively star-forming galaxies in these clusters have a more extended spatial distribution than the non-active galaxies. The kinematic properties of the early and late type cluster galaxies appear to differ as well, although these differences exist both in the present epoch and at (Adami et al. 1998; Lubin et al. 1999). Specifically, the spiral population tends to have a higher velocity dispersion than the elliptical members suggestive of an on-going spiral infall process. Poggianti et al. (1999) find, however, evidence for widespread cessation of star formation activity in intermediate clusters over a relatively short ( Gyr) timescale. Specifically, 90% of the spiral cluster members they studied show spectral signatures of either enhanced or suppressed star formation relative to local spirals.
7. A Possible Scenario
I will now propose a possible evolutionary sequence which incorporates the myriad of constraints derived from observations of clusters. Note that some of the steps below have not been observationally confirmed or are still controversial!
-
•
In a universe with (and possibly ), protoclusters form at .
-
•
The sites of formation are located at the intersections of filamentary matter flows and the first cluster galaxies form during the first generation of matter crossings (This is a conjecture based solely on N-body simulations and popular dark matter models).
-
•
The richest, current epoch clusters formed first. Some of the poorer clusters seen today may have developed via group-group mergers since .
-
•
Primordial ICM shocks and begins to emit x-rays at (and perhaps earlier). Enrichment of the ICM most likely occurs in the era. From to now, there is little evolution of the ICM.
-
•
The brightest cluster galaxies grow via cannibalism until . Most merger activity ceases by and subsequent evolution is passive. Other massive ellipticals assemble prior to and are the first to reach dynamical equilibrium with the cluster potential.
-
•
The most active periods of star formation within the cluster occur at . Most star formation is quenched, however, by .
-
•
Infall of spirals results in morphological and color gradients within the cluster. This process continues up to the present epoch.
-
•
The S0 and dwarf elliptical populations develop within the cluster core, certainly by and more likely by . The likely relevant processes involved are ram pressure stripping, mergers, and tidal stress. S0’s may descend from high surface brightness spirals, dE’s from low surface brightness spirals (Moore at al. 1998).
There are notable exceptions to the above scenario such as low- spiral rich clusters (e.g., Virgo, Hercules) and low- irregular clusters (e.g., Abell 1185), which are probably still dynamically young, suggesting that some cluster evolution is still occurring at the present epoch. Furthermore, our knowledge of cluster evolution at is still quite rudimentary. Thus, while great strides have been made, there remain many steps to go before our understanding of the cluster formation process is complete. Some of the observational programs which will take us farther towards this goal are now, or soon will be, underway. These include more complete and larger cluster samples, more objective and precise studies of the cluster population (e.g., the Sloan Digital Sky Survey, the 2dF survey, the REFLEX survey), improved x-ray observations from XMM and Chandra and optical/IR observations with HST (ACS, WF3) and SIRTF, extended spectroscopic studies of high- clusters using the growing suite of 8 – 10m ground-based telescopes, construction of mass-selected cluster catalogs from SZE surveys, and ultra deep 21 cm searches for protoclusters at using the Giant Meter-wave Radio Telescope.
Acknowledgments.
I thank the SOC for their generous travel support which made attendance of this meeting possible. I also wish to thank Megan Donahue and Caleb Scharf for providing results based on their x-ray observations of clusters in advance of publication.
References
Adami, C. et al. 1998, A&A, 331, 439
Andreon, S. 1998, ApJ, 501, 533
Arnaud, M., Evrard, A. 1999, MNRAS, 305, 631
Bahcall, N., Fan, X., Renyue, C. 1997, ApJ, 485, L53
Balogh, M. et al. 1998, ApJ, 504, L75
Benitez, N. et al. 1998, astro-ph/9812218
Bower, R., Kodama, T., Terlevich, A. 1998, MNRAS, 299, 1193
Campos, A. et al., 1999, ApJ, 511, L1
De Propris, R. et al. 1999, AJ, 118, 719
Deltorn, J. M. et al. 1997, ApJ, 483, L21
Dickinson, M. 1997, in HST and the High Redshift Universe, eds. N. Tanvir, A. Aragon-Salamanca, and J.V. Wall, (Singapore: World Scientific), p. 207
Dickinson, M. et al. 1999, ApJ, submitted
Donahue, M. & Voit, M. 1999, ApJ, 523, L137
Donahue, M. et al. 1998, ApJ, 502, 550
Donahue, M. et al. 1999, ApJ, in press, also astro-ph/9906295
Dressler, A. 1980, ApJ, 236, 351
Dressler, A. et al. 1997, ApJ, 490, 577
Dressler, A. et al. 1999, ApJS, 122, 51
Francis, P. et al. 1996, ApJ, 457, 490
Fuller, T., West, M., Bridges, T. 1999, ApJ, 519, 22
Gavazzi, G., Pierini, D., Boselli, A. 1996, A&A, 312, 397
Gioia, I. et al. 1990a, ApJS, 116, 247
Gioia, I. et al. 1990b, ApJ, 365, 35
Gioia, I. et al. 1999, AJ, 117, 2608
Hall, P., Green, R. 1998, ApJ, 507, 558
Henry, J. et al. 1992, ApJ, 386, 408
Hoekstra, H., Franx, M., Kuijken, K. 1999, ApJ, in press
Holden, B. et al. 1997, AJ, 114, 1701
Holden, B. et al. 1998, AAS, 193, 3817
Jannuzi, B., Dey, A. 1999, AAS, 194, 8803
Kelson, D. et al. 1997, ApJ, 478, L13
Le Fevre, O. et al. 1996, ApJ, 471, L11
Lubin, L., Postman, M. 1996, AJ, 111, 1795
Lubin, L. et al. 1998, AJ, 116, 584
Lubin, L. et al. 1999, AJ, submitted
Malkan, M., Teplitz, H., Mclean, I. 1996, ApJ, 468, L9
Mohr, J. et al. 1999, astro-ph/9905256
Oemler, A., Dressler, A., Butcher, H. 1997, ApJ, 474, 561
Pascarelle, S.M. et al. 1996, ApJ, 456, L21
Poggianti, B. et al. 1999, ApJ, 518, 576
Postman, M. et al. 1996, AJ, 111, 615
Postman, M. et al. 1998, ApJ, 506, 33
Postman, M., Lubin, L., Oke, J. B. 1998, AJ, 116, 560
Rosati, P. 1998, in Wide Field Surveys in Cosmology, eds. S. Colombi, Y. Mellier, B. Raban, p. 219
Rosati, P. et al. 1998, ApJ, 492, L21
Rosati, P. 1999, private comm.
Rosati, P. et al. 1999, AJ, 118, 76
Scharf, C. et al. 1999, ApJ, in press
Scodeggio, M. et al. 1999, A&AS, 137, 83
Smail, I. et al. 1997, ApJS, 110, 213
Stanford, S. et al. 1997, AJ, 114, 2232
Stanford, S., Eisenhardt, P., Dickinson, M. 1998, Apj, 492, 461
Steidel, C. et al. 1998, ApJ, 492, 428
van Dokkum, P. et al. 1998, ApJ, 504, L17
Vikhlinin, A. et al. 1998, ApJ, 502, 558