OFF-CENTER MERGERS OF CLUSTERS OF GALAXIES AND NONEQUIPARTITION OF ELECTRONS AND IONS IN INTRACLUSTER MEDIUM
Abstract
We investigate the dynamical evolution of clusters of galaxies and their observational consequences during off-center mergers, explicitly considering the relaxation process between ions and electrons in intracluster medium by N-body and hydrodynamical simulations. In the contracting phase a bow shock is formed between the two subclusters. The observed temperature between two peaks in this phase depends on the viewing angle even if the geometry of the system seems to be very simple like head-on collisions. Around the most contracting epoch, when we observe merging clusters nearly along the collision axis, they look like spherical relaxed clusters with large temperature gradients. In the expanding phase, spiral bow shocks occur. As in head-on mergers, the electron temperature is significantly lower than the plasma mean one especially in the post-shock regions in the expanding phase. When the systems have relatively large angular momentum, double-peak structures in the X-ray images can survive even after the most contracting epoch. Morphological features in both X-ray images and electron temperature distribution characteristic to off-center mergers are seriously affected by the viewing angle. When the clusters are observed nearly along the collision axis, the distribution of galaxies’ line-of-sight (LOS) velocities is a good indicator of mergers. In the contracting phase, an negative kurtosis and a large skewness are expected for nearly equal mass collisions and rather different mass ones, respectively. To obtain statistically significant results, about galaxies’ LOS velocities are required. For nearby clusters (), large redshift surveys such as 2dF will enable us to study merger dynamics.
1 INTRODUCTION
According to the hierarchical clustering scenario such as the cold dark matter cosmology, it is believed that clusters of galaxies (CGs) are formed through subcluster merger and/or absorption of smaller groups. Mergers of CGs are the most energetic events in the Universe after the Big Bang, where the total kinetic energy of the two subclusters reaches ergs. Thus, it is most likely that they affect various properties of CGs. In intracluster medium (ICM), mergers make strong bulk-flow motion and shocks. These cause characteristic morphology of X-ray images (elongation and/or substructures) and complex electron temperature structures in ICM (e.g., Honda et al. 1996; Churazov et al. 1998; Donnelly et al. 1998; Donnelly et al. 1999; Markevitch, Sarazin, & Vikhlinin 1998; Watanabe et al. 1999; Watanabe, Yamashita, & Furuzawa 1999). In addition, rapid change of physical properties of ICM probably induces nonequilibrium plasma ionization (Hanami et al. 1999). For galaxies, mergers change drastically their environments through gravitational tidal field (Bekki 1999) and static and ram pressure of ICM (Evrard 1991; Fujita et al. 1999). These may affect star formation activities of member galaxies (e.g., Caldwell et al. 1993; Tomita et al. 1996; Wang, Ulmer, & Lavery 1997). Furthermore, high energy phenomena of CGs such as radio halos (e.g., Giovannini et al. 1993; Deiss et al. 1997; Röttgering et al. 1997) and hard X-ray emission (Fusco-Femiano et al. 1999) are well correlated to merger phenomena. This suggests a part of huge energy of mergers is transported to acceleration of high energy relativistic particles (Sarazin 1999) and amplification of magnetic field, though their detailed physical processes are still unclear.
Since CGs evolve in cosmological timescale and their initial conditions depend on the cosmology, cosmological N-body + hydrodynamical simulations are suitable to investigate the formation and evolution of CGs in general (e.g., Evrard 1990; Navarro, Frenk, & White 1995; Bryan & Norman 1998; Eke, Navarro, & Frenk 1998; Suginohara & Ostriker 1998; Yoshikawa, Itoh, & Suto 1998). However, the simulations starting from rather idealized initial conditions are more suitable to investigate mergers in detail (Roettiger, Burns, & Loken 1996; Ishizaka & Mineshige 1996). Schindler & Müller (1993) found that characteristic temperature structures occur in merging clusters through shock heating and adiabatic compression and expansion. Ishizaka (1997) found that the specific energy ratio of ICM and galaxies, , is a good indicator of merging clusters and that it can be used to determine the phase of the mergers. Takizawa (1999) performed N-body and hydrodynamical simulations explicitly considering the relaxation process between ions and electrons and find that electron temperature distribution becomes significantly different than ion temperature one in later stages of mergers. Recently, Roettiger, Burns, & Loken (1999) performed N-body + magnetohydrodynamical simulations to investigate evolution of magnetic field in ICM during mergers.
Some of the observational results (e.g., A754 in Henriksen & Markevitch 1996; A3395 in Markevitch et al. 1998) imply off-center mergers. Furthermore, cosmological N-body simulations show collapsed dark halos have angular momentum which correspond to (Barnes & Efstathiou 1987; Ueda et al. 1994), where is the ratio between the actual angular velocity and the angular velocity needed to provide rotational support (see Binney & Tremaine 1987). It is probable that dark halos obtain a part of the angular momentum through off-center major mergers. Thus, it is an quite interesting problem to study evolution of off-center mergers and their observational consequences. Ricker (1998) studies gas dynamical evolution of off-center mergers in detail using the high resolution peacewise-parabolic method. However their simulations do not contain the collisionless N-body component. This is very problematic because dark matter and galaxies dominate gravity in typical CGs. In addition, two-temperature nature of ICM is not considered there. Thus, we perform N-body and hydrodynamical simulations explicitly considering the relaxation process between ions and electrons to investigate the dynamical evolution and observational consequences of off-center mergers of CGs.
2 THE SIMULATIONS
2.1 The Numerical Method
In the present study, we consider CGs consisting of two components: collisionless particles corresponding to the galaxies and dark matter (DM), and two-temperature gas corresponding to the ICM. When calculating gravity, both components are considered, although the former dominates over the latter. Radiative cooling and heat conduction are not included. The numerical method used here is fully described in §3.1 of Takizawa (1999). Thus, we briefly review the outline of the method in this subsection.
We used the smoothed-particle hydrodynamics (SPH) method to solve the hydrodynamical equations for the gas component (see Monaghan 1992). As the standard SPH codes for one-temperature fluid, we solve the continuity equation, the momentum equation, and the thermal energy equation for whole plasma with artificial viscosity to treat the shocks. In addition to these equations, we solve one more equation for the normalized electron temperature, , where is the electron temperature and is the plasma mean temperature. We assume that artificial viscous heating is effective only for ions and that only the Coulomb coupling is considered in the relaxation process.
Gravitational forces are calculated by the Barnes-Hut tree algorithm (Barnes & Hut 1986) and softened using the Plummer potential profile. We set the softening length one-tenth of the initial core radius of the smaller subcluster in the simulation. Tree structure is also used to search for nearest neighbors in SPH calculations (Hernquist & Katz 1989).
2.2 Models and Initial Conditions
We consider mergers of two virialized subclusters of galaxies with masses and . The initial configuration of each subcluster is the same as in Takizawa (1999). The spatial distribution of DM in each subcluster is represented by the King distribution with core radii and . We assume the velocity distribution of the DM particles to be an isotropic Maxwellian. We assume that the initial ICM temperature is isothermal and equal to the virial temperature. The ICM is initially in hydrostatic equilibrium within the cluster potential of the DM and the ICM, itself.
We set the initial conditions as follows. Two subclusters are initialized in the plane, separated by a distance in the direction and a distance (the impact parameter) in the direction. The initial relative velocity, is directed along the axis. The coordinate system is taken in such a way that the center of masses is at rest in the origin. The total gas mass fraction is set to be 0.1.
In both Run A1 and A2, two subclusters have the same masses; . We set the core radii to be Mpc. Each subcluster consists of 5000 collisionless particles and 5000 SPH particles. For the both runs, the binding energy between the two subclusters is the same as in Run A of Takizawa (1999). We set Mpc. Then, the impact parameter and initial relative velocity are taken in such a way that for Run A1 and for Run A2, respectively. The parameter is the ratio between the actual angular velocity and the angular velocity needed to provide rotational support, where is the angular momentum of the two subclusters around the center of masses, is the binding energy between the two, is the gravitational constant, and is the total mass (see Binney & Tremaine 1987).
In both Run B1 and B2, the mass ratio is . The larger subcluster has the same mass as that in Run A1 and A2. The particle numbers of the smaller one are one-fourth of the larger one. For the both runs, the binding energy between the two subclusters is the same as in Run B of Takizawa (1999). We set Mpc. Again, the impact parameter and initial relative velocity are taken in such a way that for Run B1 and for Run B2, respectively. The parameters in our calculations are summarized in Table 1.
3 RESULTS
3.1 X-ray Images and Electron Temperature Distribution of Run A1
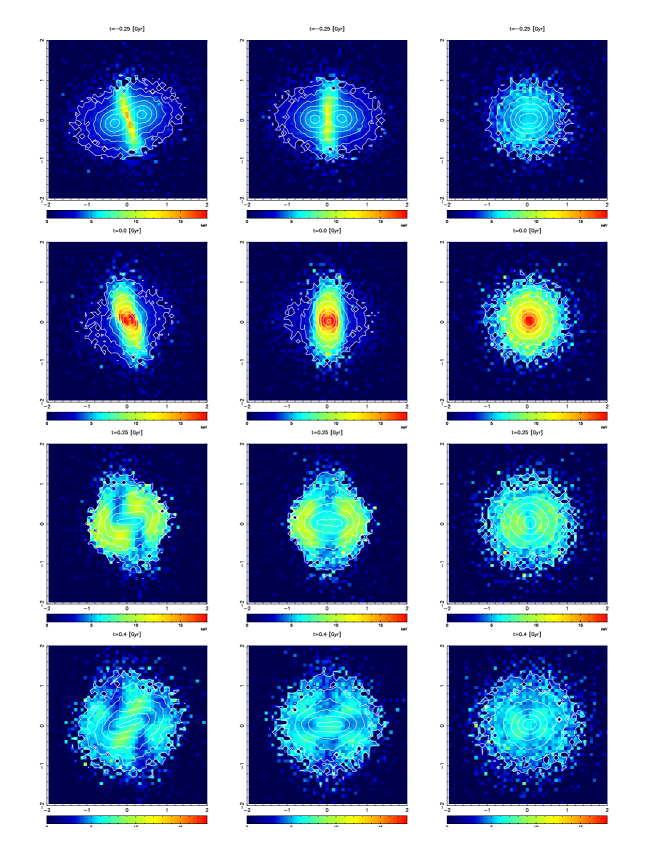
First of all, let us see the evolution of electron temperature ( ) distribution and X-ray surface brightness distribution, which are important observational quantities in X-ray to investigate the dynamical properties of merging CGs. Figure 1 shows the snapshots of X-ray surface brightness (contours) and emissivity-weighted (colors) distribution of Run A1 viewed along the -axis (Column 1), -axis (Column 2), and -axis (Column 3) at four epochs (Rows 1-4) during the merger. The times relative to the most contracting epoch are listed above each panel: , , , and Gyr. X-ray surface brightness contours are equally spaced on a logarithmic scale and separated by a factor of 7.4. The blue, green, yellow, and red colors correspond to keV, 8 keV, 12 keV, and 16 keV, respectively. Each panel is 4 Mpc on a side.
When we observe the cluster along the z-axis (Column 1), which is nearly perpendicular to the collision axis, the morphology characteristic to the off-center merger is clarified. When two subclusters approach each other, we see double peaks in the X-ray image of “one cluster” at Gyr. Just between the peaks electron temperature rises up to keV due to the shock. The shock front is oblique to the collision axis due to the angular momentum between the subclusters. At the most contracting epoch ( Gyr), two peaks merge to one peak in the X-ray image and the image elongates to the directions nearly perpendicular to the collision axis. Then the cluster expands and two shocks propagate in the opposite directions ( Gyr). Since the system has angular momentum, the shape of the expanding shocks are similar to the arms of the spiral galaxies. However, due to the limitation of relaxation between ions and electrons, the post-shock hot regions have not so high electron temperature as in the contracting phase (see §3.3).
On the other hand, when we observe the cluster along the y-axis (Column 2), it looks like a head-on merger such as Run A in Takizawa (1999). The between the two peaks at Gyr becomes lower than when viewed along the z-axis, because the both foreground and background cooler gas contaminates the hot gas at the shock. This lead to the underestimation of the collision velocity though the morphology of this epoch is very simple and seems to be suitable for the estimation (and we will discuss this in §4).
Furthermore, when we observe the cluster along the x-axis (Column 3), which is nearly along the collision axis, the morphology is rather different. It looks like a spherical symmetric cluster both in the X-ray surface brightness and electron temperature distribution. Except for the most contracting epoch ( Gyr), there is no distinct temperature structure. At the most contracting epoch, temperature distribution is spherical symmetric but have a rather large gradient (and we will discuss this in §4). Since ICM is optically thin, information along the line-of-sight direction is emissivity-weighted integrated and lost in large part. In this case, line-of-sight velocity distribution of galaxies is more suitable for analyzing the cluster dynamical properties (see §3.4). In addition, line-of-sight velocity of ICM may also provide us with useful information, which will become observable with the X-Ray Spectrometer (XRS) after the launch of ASTRO-E.
3.2 X-ray Images and Electron Temperature Distribution of Run B1
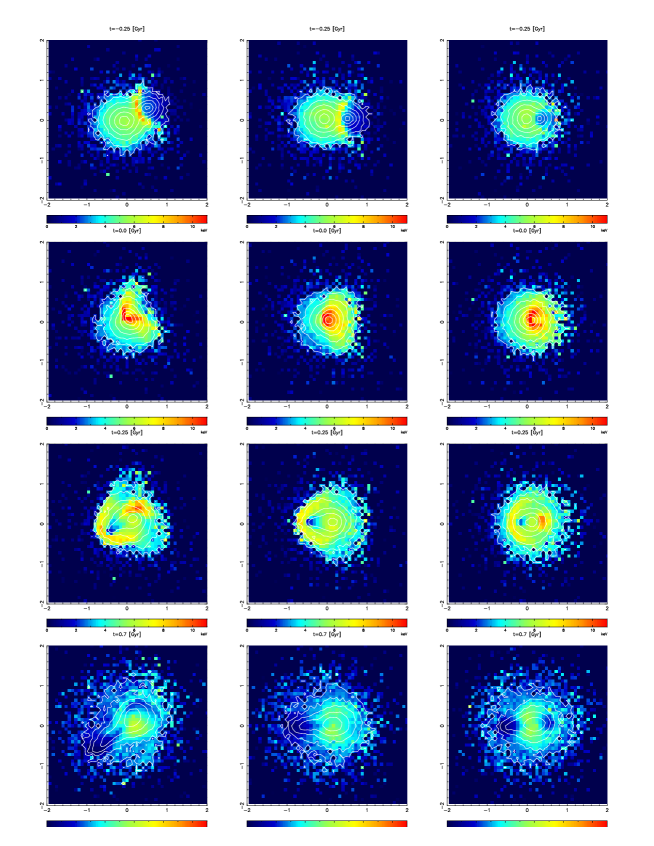
Next, we describe the evolution of X-ray surface brightness and distribution of Run B1. Figure 2 shows the same conditions as Figure 1, but for Run B1. The times are listed above each panel: , , , and Gyr. Temperature color scale is adjusted for Run B1. The blue, green, yellow, and red colors correspond to keV, 5 keV, 7.5 keV, and 10 keV, respectively.
As in Run A1, characteristic features of off-center mergers are most clearly seen when the cluster is viewed along the z-axis (Column 1). When two subclusters approach each other, the bow shock with an arc shape is formed just between the two as in head-on collisions. However, since the direction of the smaller subcluster’s velocity is not coincident to the direction connecting the two, the shock is stronger in the upper region of the panel ( Gyr). Then the two peaks merge to one triangle image ( Gyr). The hot region associated to the bow shock is seen elongated slantingly backward with respect to the motion of the smaller subcluster. However, this hot region is located not in the center of the cluster but in the upper half of the image due to an off-center collision. Then the gas expands and the two shocks propagate outward ( Gyr). As in Run A1, the expanding shocks form spiral-like structure and electron temperature there is significantly lower than the plasma mean temperature (see §3.3).
When we observe the cluster along the y-axis (Column 2), its morphological feature in X-ray surface brightness is similar to the that of head-on merger as in Run A1. However, this is not the case in the electron temperature distribution. This is prominent especially in the expanding phase ( Gyr). The hot region located in the backward with respect to the motion of the smaller cluster is hardly seen. Since this hot component is not so spread, the foreground and background cooler gas contaminates it. When we observe the cluster along the x-axis (Column 3), non spherical structure can be seen on the contrary to the Run A1. At the geometry is very simple and seems to be very suitable for estimation of the collision velocity. However, this lead to the underestimation of the collision velocity as in Run A1.
3.3 Two-Temperature Nature of ICM in the Expanding Phase
As shown by Takizawa (1999), electron temperature distribution is significantly different than the plasma mean one in the expanding phase of mergers. Let us examine two-temperature nature of ICM for each model.
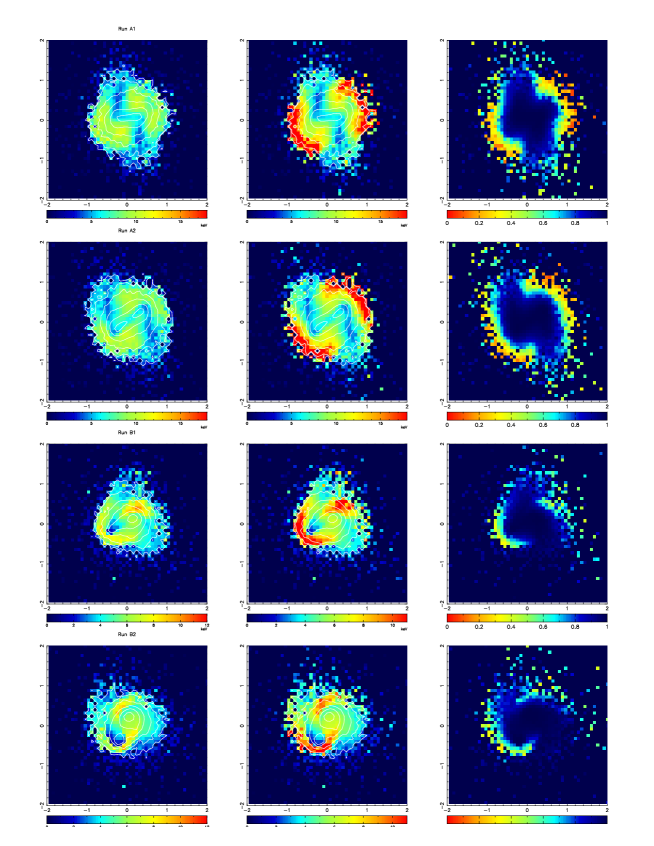
Figure 3 shows the snapshots of electron temperature () distribution (Column 1), the plasma mean temperature () one (Column 2), and the normalized electron temperature () one (Column 3) for each model at the expanding phase (0.25 Gyr after the most contracting epoch) viewed along the z-axis. X-ray surface brightness distribution (contours) is overlaid for the panels in Column 1 and 2. Run A1, A2, B1, and B2 are showed in Row 1, Row 2, Row 3, and Row 4, respectively. Temperature color scale for and (Column 1 and 2) in Row 1 and 2 (for Run A1 and A2) , and Row 3 and 4 (for Run B1 and B2) are the same as in figure 1 and 2, respectively. For distribution (Column 3), the red, yellow. green, and blue colors correspond to , and , respectively.
For all models, spiral-shaped shocks are recognized. As in head-on mergers (Takizawa 1999), electron temperature in the post shock regions is significantly lower than the plasma mean one in this phase. However, even in the electron temperature distribution, spirally high temperature regions can be seen. Note that these regions are located not at the shocks, but Mpc behind the shocks.
In the higher angular momentum cases (Run A2 and B2), double-peak structure can be seen even in the expanding phase whereas it can be seen only in the pre-merger contracting phase in head-on collisions. Thus, a cluster which has double peaks in X-ray surface brightness distribution and hot temperature regions not between the two peaks but around them, is most likely a candidate of a off-center collision. This is the case of A3395 (Markevitch et al. 1998). This will be discussed in §4.
3.4 Line-of-sight Velocity Distribution of Galaxies
As described in §3.1 and 3.2, when we observe merging clusters nearly along the collision axis, line-of-sight (LOS) velocity distribution of galaxies has more useful information than the X-ray images. Let us discuss this issue. In the argument below, we assume that DM particles distribution in velocity space well represents that of galaxies.
First, we describe the evolution of LOS velocity distribution of galaxies in Run A1. Figure 4 shows the histograms of LOS velocities of N-body particles of Run A1 viewed along the x-axis at four epochs. For the pre-merger phase ( Gyr), two components associated to the subclusters can be clearly recognized. Then at the most contracting epoch the distribution becomes boxier than the Gaussian ( Gyr). This is confirmed from the evolution of the kurtosis (Fig. 5). However, in the expanding phase, the distribution becomes closer to Gaussian. To see the evolution of the distribution quantitatively, we show the evolution of the skewness and kurtosis of the LOS velocity distribution viewed along the x-axis (open triangles and solid lines), y-axis (open squares and dotted lines), and z-axis (filled square and short dashed lines), respectively. Due to the symmetry of the equal mass collision, it is quite natural that the skewness is almost zero in all directions. On the other hand, the kurtosis of the velocity distribution along the x-axis becomes significant negative values especially in the contracting phase although the kurtosis of the other components is almost nearly zero.
Next, we investigate the behavior of Run B1. Figure 6 shows the same conditions as figure 4 but for Run B1. In the contracting phase, a tail associated to the smaller subcluster is visible toward negative velocities. This is more clarified in the skewness evolution in figure 7, which is the same conditions as figure 5 but for Run B1. Due to this tail component the skewness becomes significantly large negative values. Note that the sign of the skewness depends on the relative position among two subclusters and the observer. Again, a kurtosis of the velocities along the x-axis becomes negative in the contracting phase although this is not so prominent as in Run A1.
In the above cases, we use the all N-body particles ( for Run A1 and for Run B1) to calculating the moments of LOS velocity distribution. In real cases, however, it is difficult to measure LOS velocities for such numbers of galaxies. On the other hand, the standard deviations of a skewness and a kurtosis for a Gaussian distribution are approximately and , respectively. Thus, for Run A1, we need galaxies’ LOS velocities to obtain a statistically significant negative kurtosis. If the number of galaxies is only , it is difficult to distinguish a negative kurtosis due to mergers from that due to poor statistics. For Run B1, is required to detect a statistically significant negative kurtosis. On the other hand, we need galaxies to obtain a statistically significant skewness. This will be discussed in §4.
4 SUMMARY AND DISCUSSION
We investigate evolution of CGs and their observational consequences during off-center mergers explicitly considering the relaxation process between the ions and electrons. In the contracting phase, a bow shock occurs between the two subclusters. X-ray images have two peaks and the high temperature region is located between the two. However, the observed temperature between the two peaks depends on the viewing angle. In the expanding phase spiral-shaped two shocks propagate outward. Spatial distribution of ICM electron temperature is significantly different in this phase as in head-on collisions. Morphological features in X-ray images and temperature distribution characteristic to off-center mergers are seriously affected by the viewing angle. When we observe CGs during off-center merger in some directions, we cannot distinguish them from head-on mergers only through X-ray images and temperature maps.
When we observe merging CGs nearly along the collision axis, LOS velocity distribution of galaxies has more useful information than X-ray images and temperature maps of ICM. In the contracting phase, the distribution is boxier and have a negative kurtosis. This is prominent when the two subclusters have nearly equal masses. When the two subclusters have rather different masses, the skewness of the distribution is more suitable for a indicator of mergers in the contracting phase. To obtain statistically significant values of these moments, we need galaxies’ LOS velocities.
Recently, Markevitch et al. (1999) and Kikuchi et al. (1999) estimated subcluster collision velocities in Cygnus A and Virgo using the electron temperature maps obtained by ASCA, respectively. Both of them have simple geometry; Hot temperature region is located just between the two peaks of X-ray images. However, if we do not observe CGs just perpendicular to the collision axis, the observed temperature between the peaks is lower than the true temperature at the shock. This is due to the contamination of cooler ICM located foreground and background. Therefor, this method can lead to underestimation of the collision velocities. We should regard their results as the minimum limit. However, since estimated velocities through electron temperature maps depend on the true collision velocities and the viewing angles, they are related to the transverse components of the collision velocities. On the other hand, LOS components of collision velocities will be observable with XRS after the launch of ASTRO-E. Therefor, we will be able to estimate true collision velocities combining the results of both electron temperature maps and LOS velocities.
When we observe merging clusters around the most contracting phase nearly along the collision axis through X-ray, they seem to be relaxed spherical ones in X-ray images. In addition, the is nearly unity only around this epoch though a large value is a good indicator of mergers when observed along the collision axis (Ishizaka 1997; Takizawa 1999). Thus, it is difficult to resolve whether they are merging clusters or not. One of their characteristic features is a large temperature gradient. Markevitch (1996) found that some of clusters have a larger radial gradient in electron temperature than that expected from the self-similar solution (Bertschinger 1985) and numerical simulations (eg; Navarro et al. 1995; Takizawa & Mineshige 1998) in the plasma mean temperature. One explanation to solve this discrepancy is energy nonequipartition of electrons and ions in the outer regions (Fox & Loeb 1997; Chiéze, Alimi & Teyssier 1998; Ettori & Fabian 1998; Takizawa 1998). However, it is probable that some of them are hidden merging clusters as mentioned above. Again, measurement of ICM LOS velocities with XRS of ASTRO-E will clarify such hidden merging clusters.
When the angular momentum of the systems are relatively high (), double-peak structures in X-ray images survive after the most contracting epoch. We cannot find whether they are in a contracting or expanding phase only through X-ray surface brightness distribution. However, electron temperature distribution enable us to determine the phase of mergers. If high temperature regions are located not between but around the peaks like A3395 (Markevitch et al. 1998), they are in the expanding phase of off-center mergers. If high temperature regions are between the peaks like Cygnus A (Markevitch et al. 1999), on the other hand, they are in contracting phase.
If we assume the luminosity function of galaxies is the Schechter form (see Binney & Merrifield 1998) with the normalization through a typical galaxy number density in rich clusters, the absolute magnitude of the 1000-th luminous galaxy is . This corresponds to in the apparent magnitude for an object at when the Hubble constant is 75 km . This is nearly equal to the survey limit of 2dF (). Thus, we will be able to discuss on merger dynamics for nearby clusters using such redshift survey data.
| Run A1 | Run A2 | Run B1 | Run B2 | |
| ) | 0.5/0.5 | 0.5/0.5 | 0.5/0.125 | 0.5/0.125 |
| (Mpc) | 0.2/0.2 | 0.2/0.2 | 0.2/0.1 | 0.2/0.1 |
| (keV) | 4.78/4.78 | 4.78/4.78 | 4.78/2.39 | 4.78/2.39 |
| (Mpc) | 3.2 | 3.2 | 2.2 | 2.2 |
| (Mpc) | 0.4648 | 1.042 | 0.5394 | 1.456 |
| (km/sec) | 714 | 637 | 863 | 639 |
| 0.01 | 0.02 | 0.01 | 0.02 | |
| 0.1 | 0.1 | 0.1 | 0.1 | |
| (Mpc) | 0.02 | 0.02 | 0.01 | 0.01 |
| (SPH) | 5000/5000 | 5000/5000 | 5000/1250 | 5000/1250 |
| (DM) | 5000/5000 | 5000/5000 | 5000/1250 | 5000/1250 |
References
- (1) Barnes, J., & Hut, P. 1986, Nature, 324, 446
- (2) Barnes, J., & Efstathiou, G. 1987, ApJ, 319, 575
- (3) Bertschinger, E. 1985, ApJS, 58, 39
- (4) Bekki, K. 1999, ApJ, 510, L15
- (5) Binney, J., & Merrifield, M. 1998, Galactic Astronomy (Princeton: Princeton University Press)
- (6) Binney, J., & Tremaine, S. 1987, Galactic Dynamics (Princeton: Princeton University Press)
- (7) Bryan, G. L., & Norman, M. L., 1998, ApJ, 495, 80
- (8) Caldwell, H., Rose, J. A., Sharples, R. M., Ellis, R. S., & Bower, R. G. 1993, AJ, 106, 473
- (9) Chiéze, J.-P., Alimi, J.-M, & Teyssier, R. 1998, ApJ, 495, 630
- (10) Churazov, E., Gilfanov, M., Forman, W., & Jones, C. 1998, ApJ, submitted (astro-ph/9802166)
- (11) Deiss, B. M., Reich, W., Lesch, H., Wielebinski, R. 1997, A&A, 321, 55
- (12) Donnelly, R. H., Markevitch, M., Forman, W., Jones, C., David, L. P., Churazov, E., & Gilfanov, M. 1998, ApJ, 500, 138
- (13) Donnelly, R. H., Markevitch, M., Forman, W., Jones, C., Churazov, E., & Gilfanov, M. 1999, ApJ, 513, 690
- (14) Eke, V. R., Navarro, J. F., & Frenk, C. S. 1998, ApJ, 503, 569
- (15) Ettori, S. & Fabian, A. C. 1998, MNRAS, 293, L33
- (16) Evrard, A. E. 1990, ApJ, 363, 349
- (17) Evrard, A. E. 1991, MNRAS, 248, 8
- (18) Fox, D. C., & Loeb, A. 1997, ApJ, 491, 459
- (19) Fujita, Y., Takizawa, M., Nagashima, M., & Enoki, M. 1999, PASJ, in press (astro-ph/9904386)
- (20) Fusco-Femiano, R., Fiume, D. D., Feretti, L., Giovannini, G., Grandi, P., Matt, G., Molendi, S., and Santangelo, A. 1999, ApJ, 513, L21
- (21) Giovannini, G., Feretti, L., Venturi, T., Kim, K. T., and Kronberg, P. P. 1993, ApJ, 406, 399
- (22) Henriksen, M. J., & Markevitch, M. L. 1996, 466, L79
- (23) Hernquist, L., & Katz, N. 1989, ApJS, 70, 419
- (24) Honda, H., Hirayama, M., Watanabe, M., Kunieda, H., Tawara, Y., Yamashita, K., Ohashi, T., Hughs, J., P., & Henry, J. P. 1996, ApJ, 473, L71
- (25) Ishizaka, C., & Mineshige, S. 1996, PASJ, 48, L37
- (26) Ishizaka, C., 1997 Ap & SpS, 254, 233
- (27) Hanami, H., Tsuru, T., Shimasaku, K., Yamauchi, S., Ikebe, Y., & Koyama, K. 1999, ApJ, in press
- (28) Kikuchi, K. et al. 1999, in preparation
- (29) Markevitch, M. 1996, ApJ, 465, L1
- (30) Markevitch, M., Forman, W. R., Sarazin, C. L., & Vikhlinin, A. 1998, ApJ, 503, 77
- (31) Markevitch, M., Sarazin, C. L., & Vikhlinin, A. 1999, ApJ, in press (astro-ph/9812005)
- (32) Monaghan, J. J. 1992, ARA&A, 30, 543
- (33) Navarro, J. F., Frenk, C. S., & White, S. D. M. 1995, MNRAS, 275, 720
- (34) Ricker, P., M. 1998, ApJ, 496, 670
- (35) Roettiger, K., Burns, J. O., & Loken, C. 1996, ApJ, 473, 651
- (36) Roettiger, K., Stone, J. M., & Burns, J. O. 1999, ApJ, in press (astro-ph/9902015)
- (37) Röttgering, H. J. A., Wieringa, M. H., Hunstead, R. W., and Ekers, R. D. 1997, MNRAS, 290, 577
- (38) Sarazin, C. L. 1999, ApJ, in press (astro-ph/9901601)
- (39) Schindler, S., & Müller, E. 1993, A&A, 272, 137
- (40) Suginohara, T., & Ostriker, J. P. 1998, ApJ, 507, 16
- (41) Takizawa, M., & Mineshige, S. 1998, ApJ, 499, 82
- (42) Takizawa, M. 1998, ApJ, 509, 579
- (43) Takizawa, M. 1999, ApJ, in press (astro-ph/9901314)
- (44) Tomita, A., Nakamura, F. E., Takata, T., Nakanishi, K., Takeuchi, T., Ohta, K., & Yamada, T. 1996, AJ, 111, 42
- (45) Ueda, H., Shimasaku, K., Suginohara, T., & Suto, Y. 1994, PASJ, 46, 319
- (46) Wang, Q. D., Ulmer, M. P., Lavery, R. J. 1997, MNRAS, 288, 702
- (47) Watanabe, M., Yamashita, K., Furuzawa, A., Kunieda, H., Tawara, Y., & Honda, H. 1999, ApJ, submitted
- (48) Watanabe, M., Yamashita, K., & Furuzawa, A. 1999, in preparation
- (49) Yoshikawa, K., Itoh, M., & Suto, Y. 1998, PASJ, 50, 203