Deep Radio Imaging of Globular Clusters and the Cluster Pulsar Population
Abstract
We have obtained deep multifrequency radio observations of seven globular clusters using the Very Large Array and the Australia Telescope Compact Array. Five of these, NGC 6440, NGC 6539, NGC 6544, NGC 6624 and Terzan 5 had previously been detected in a shallower survey for steep spectrum radio sources in globular clusters Fruchter & Goss (1990). The sixth, the rich globular cluster, Liller 1, had heretofore been undetected in the radio, and the seventh, 47 Tucanae, was not included in our original survey. High resolution 6 and 20 cm images of three of the clusters, NGC 6440, NGC 6539, NGC 6624 reveal only point sources coincident with pulsars which have been discovered subsequent to our first imaging survey. 21 and 18 cm images reveal several point sources within a few core-radii of the center of 47 Tuc. Two of these are identified pulsars, and a third, which is both variable and has a steep spectrum, is also most likely a pulsar previously identified by a pulsed survey. However, the 6, 20 and 90 cm images of NGC 6544, Liller 1 and Terzan 5 display strong steep-spectrum emission which cannot be associated with known pulsars. The 90 cm flux densities of Terzan 5, Liller 1 and NGC 6544 are 35, 9 and 6 mJy, respectively, implying that a number of bright pulsars in these clusters have been hidden from pulsed searches.
The image of the rich cluster Terzan 5 displays numerous point sources within , or 4 core radii of the cluster center. The density of these objects rises rapidly toward the core, where an elongated region of emission is found. This feature may be due to the presence of a higher density of point sources than can be resolved by the resolution of our data. The brightest individual sources, as well as the extended emission, possess the steep spectra expected of pulsars. Furthermore, the flux distribution of the sources agrees well with the standard pulsar luminosity function. The total luminosity and number of objects observed suggest that Terzan 5 contains more pulsars than any other Galactic globular cluster.
1 Introduction
Low mass x-ray binaries (LMXBs) announce themselves from across the galaxy to telescopes with effective areas measured in square centimeters, but some of their descendants, binary millisecond pulsars (MSPs) are far less vocal. The majority of MSPs are difficult for even the largest radio telescopes to detect at a distance of a few kiloparsecs, and the pulses from even the bright MSPs can be obscured by the dispersion of the interstellar medium or by doppler smearing resulting from the gravitational tug of a binary companion. These latter difficulties, however, can be overcome by radio interferometric imaging. The flux density measured in a radio image is not affected by dispersion or doppler broadening. Furthermore, one can generally distinguish between pulsars and background sources by the steep spectra of pulsars and their occasional polarization. Indeed, the first pulsar found in a globular cluster was located in a Very Large Array (VLA) image Hamilton et al. (1985).
As discussed in Fruchter and Goss (1990), henceforth FG90, interferometric imaging has another, subtle, but equally important advantage. If the synthesized beam of the interferometer is comparable in diameter to the core of the cluster, then the flux density one observes will frequently be the sum of the emission from many pulsars in the cluster. If the number of pulsars in a clusters is large, this sum can substantially exceed the flux density from the single brightest pulsar in the cluster. The luminosity function of pulsars, as measured in the field, has the form
| (1) |
where , the pulsar luminosity, is bounded below by a minimum luminosity, , of order mJy kpc2 at 20 cm (1400 MHz), and the power, , is approximately 2 Manchester & Taylor (1977); Dewey et al. (1985); Stollman (1987). Limited observational evidence has so far suggested that the luminosity function of pulsars in globular clusters agrees with that of the field Anderson (1992). Although with this luminosity law the expected luminosity of a pulsar (and thus a cluster) diverges logarithmically, it can be shown, that for a given observed cluster luminosity, if , the expected number of pulsars in the cluster beaming towards earth is
| (2) |
Thus, by observing a cluster with a large beam, we not only gain the advantage of the increased flux density, but also obtain an estimator of the number of pulsars in the cluster.
In FG90 we described a search of 17 globular clusters for radio emission at 20 cm. Resolutions comparable to the core diameters were employed to maximize the sensitivity to the integrated emission from a population of pulsars in the clusters. New sources were detected in NGC 6440, NGC 6539, NGC 6544 and Terzan 5 and we confirmed the existence of a controversial source in NGC 6624. As reported in FG90, repeat observations of these sources at 20 cm, and observations of many of them at 6 cm, suggested that with the possible exception of the source in NGC 6624 all of the sources were due to radiation from pulsars, as a result of their observed variability or steep spectrum. Later, pulsed searches, from Parkes and Jodrell revealed individual pulsars with flux densities comparable to those we observed in three of the clusters, NGC 6440, NGC 6539 and NGC 6624. Additionally, a source visible on our image of Terzan 5, but well outside of the cluster core, was found to be an eclipsing millisecond pulsar.
In order to better study the pulsar population in these clusters we have reobserved these clusters with the VLA but using a substantially smaller beam size. Observations were taken at 20 and 6 cm, and particular attention was paid to the two optically richest clusters in our survey Terzan 5 and NGC 6440. Further observations were taken at 90 cm of NGC 6544 and Terzan 5 in order to better characterize the emission from clusters where emission was seen but no pulsar found. Finally, we have expanded our study to include two other rich clusters, Liller 1 and 47 Tuc, which had substantial unpublished data in the archives of the VLA and Australia Telescope Compact Array (ATCA), respectively. Early versions of some of the results reported here were presented in Fruchter and Goss (1991) and Fruchter and Goss (1995).
2 Observations and Results
2.1 Terzan 5
The globular cluster Terzan 5 was observed at 20 cm in the A, BnA, B and CnB configurations of the Very Large Array (VLA)111The A configuration of the VLA is its largest. Each successive array (B,C,D) is approximately a factor of three smaller than its predecessor. Hybrid configurations (e.g. BnA), have the northern arm in the larger configuration, to provide a more circular beam for southern sources.. In each case, approximately four hours of data were obtained. All observations were done in continuum mode, using two 50 MHz bandpasses, centered on the sky frequencies of 1465 and 1515 MHz. Both right and left circular polarizations were observed. Terzan 5 was also observed at 6 cm in the B and C arrays. In both cases the observations were done in continuum mode, employing two orthogonal polarizations in each of two 50 MHz bandpasses, centered at the sky frequencies of 4835 and 4885 MHz. Here we discuss the 6 cm C array data as its beamsize () closely approximates that which we used to measure the extended emission observed at 20 cm. About six hours of data were taken on source in the C array during two four hour observing sessions separated by about one week. Finally, Terzan 5 was reobserved on three successive days in the A/B array. During these observing session we rapidly switched between 20 cm and 90 cm. The 20 cm observations were done as described above. At 90 cm we observed across two 3.125 MHz bandpasses centered at 327.5 and 333 MHz. Both linear polarizations were observed. These dual frequency observations were designed to allow us to study both the emission from the center of the cluster as well as the the low-frequency eclipse behavior of the 11 ms pulsar 1744-24A.
EDITOR: INSERT FIGURES 1-4 HERE
EDITOR: INSERT TABLE 1 HERE
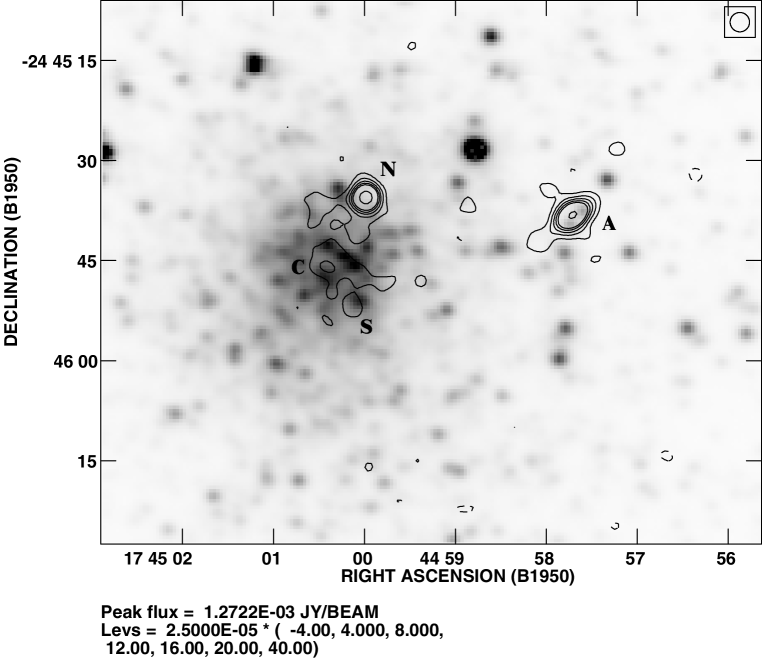
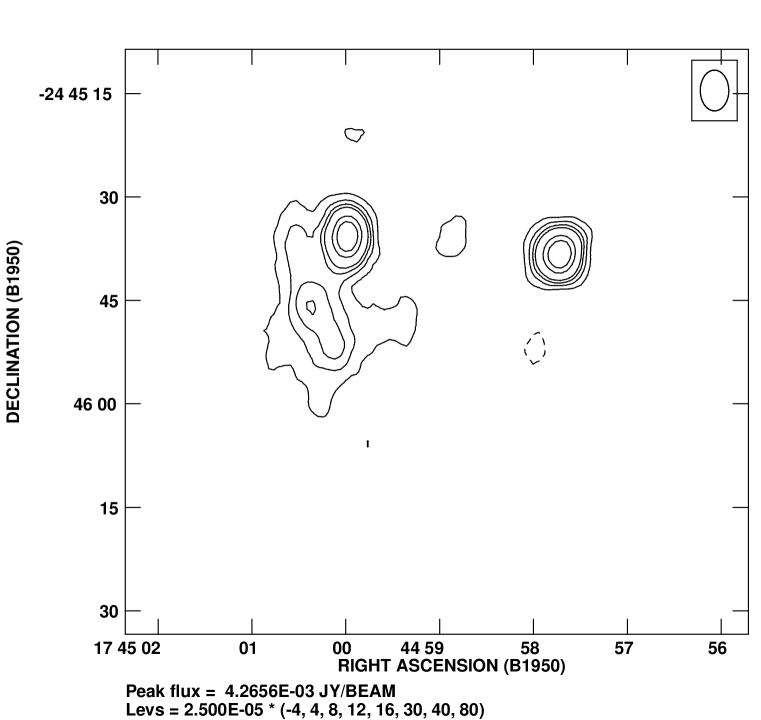
Figure 1 shows the contours of the 20 cm image of Terzan 5 superposed on an I band image of the cluster taken by Taft Armandroff with the Cerro Tololo Inter-American Observatory (CTIO) 1-m telescope. The VLA image was made using uniform weighting and a 40 kilolambda taper. This weighting produces a small beam size () which sharpens the details of the image with the loss of some sensitivity to extended structure. The bright radio source about to the west of the cluster is the eclipsing pulsar, PSR 1744-24A Lyne et al. (1990); Nice et al. (1990); Nice & Thorsett (1992). The “sidelobes” and apparent elongation of this source are due to its time variability caused primarily by the obscuration of the pulsar by a wind off its companion. Two other points sources, a northern and southern source can be seen on either side of the central cluster emission (the positions and flux densities per beam of the sources in Figure 1 are displayed in Table 1). Perhaps the most striking feature of the radio image, however, is the diffuse radiation centered on the optical cluster, which can be better viewed in the image shown in Figure 2, which has a beam of . This image was created using a “robust weight” of Briggs (1995), this is a weighting roughly intermediate between uniform weighting, which emphasizes resolution, and natural weighting, which emphasizes sensitivity.
The flux density of the diffuse component is mJy at 20 cm: stronger than the two prominent point sources in the image. Even when only the highest resolution data is retained and an image with a beam is produced (with a consequent loss of signal-to-noise) the center of the cluster remains a continuous, elongated resolved source. If, as we suspect, the source of this emission is pulsars, their central density is too large for them to be individually distinguished in our data.
The alignment of the radio and optical images is based on the astrometric solutions for a number of stars in the I-band image which are also found in the HST Guide Star Catalog Russell et al. (1990), which has an astrometric accuracy somewhat better than . As a number of stars in that catalog were in the I-band image, and as the positions the peaks of the diffuse radio and optical flux densities are indistinguishable with this astrometry, we believe we have correctly identified the center of the Terzan 5 cluster. The position derived for the center of the diffuse emission, , , agrees well with that measured by the discoverer of the cluster, Terzan (1971); however, this position disagrees with that of Picard and Johnston (1995) by about 8 arcseconds. (The Picard and Johnston position is also inconsistent with that of Terzan). We believe the position and association proposed here are correct.
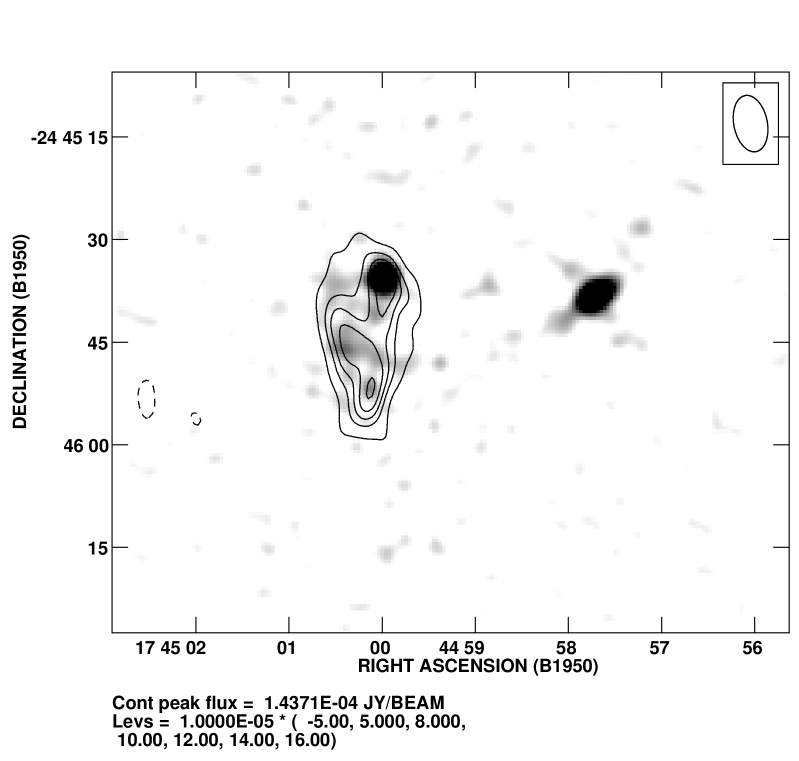
In Figure 3 we have superposed the 6 cm images as contours upon the 20 cm image, which is shown in greyscale. Comparison of these images shows that the mJy 20 cm source about ten arc seconds to the northwest of the cluster center (labeled “N” in both Table 1 and Figure 1) possesses a spectral index, , of , and the central diffuse emission (source C) has an index greater than (to determine the spectral index it is assumed that the flux density of the object, , scales as between the observed frequencies). The only astrophysical sources likely to possess spectra this steep are pulsars. Indeed, it is worth noting that the spectrum of PSR 1744-24A it is completely undetected in the 6 cm image.
The 6 cm image also reveals the Jy source to the south-east of the cluster (source S) to be highly variable (undectable in one image, its flux density increased by at least a factor of several in the other taken days later). Furthermore, in the 20 cm BnA configuration image obtained simultaneously with our 90 cm data (but which is not included in the 20 cm image shown here), this source has brightened considerably to become a mJy source. While the rapid 6 cm variability can be ascribed to diffractive scintillation, the cause of the long-term 20 cm variation is less clear. The expected diffractive scintillation bandwidth at 20 cm (assuming a dispersion measure of pc cm-3) is of order 1 MHz Cordes et al. (1985), significantly smaller than the 100 MHz bandpass of the observations, and refactive scintillation is usually limited to changes in flux density of a factor of 2 Kaspi & Stinebring (1992). Scattering by caustics in the interstellar medium, while relatively rare, can cause such strong variability Goodman et al. (1987). Nonetheless, there can be little doubt that the object is a pulsar – the simultaneous 90 and 20 cm observations imply a spectral index of , far steeper than typical background sources Condon (1984).
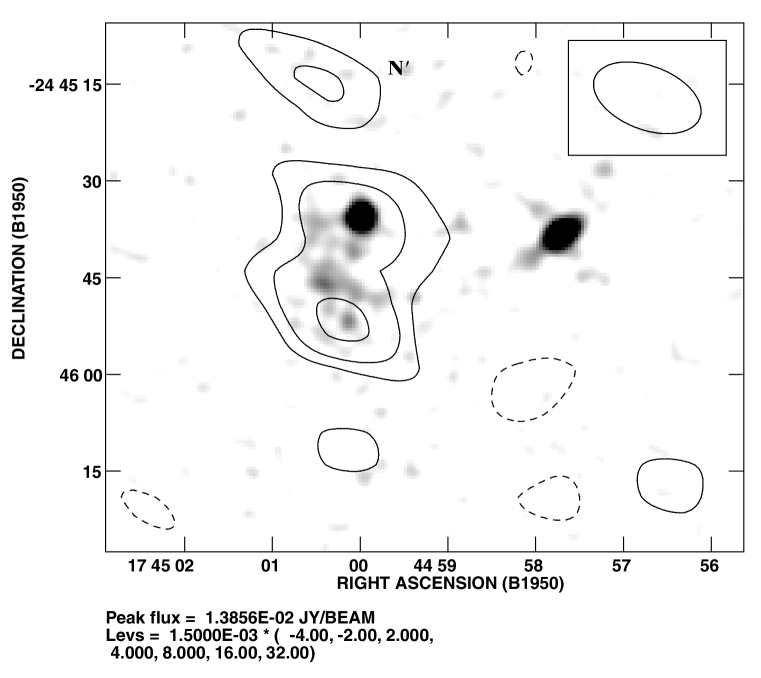
Indeed, both the northern and southern point sources show up strongly in our 90 cm image. Each contributes about mJy to the total flux density of the cluster, with another mJy apparently due to the cluster as a whole. As our 90 cm beamsize is across, the division of the flux density into these components must be regarded as approximate. Unfortunately, a beamsize this large was required in order to make the necessary 3-D imaging of the 90 cm data computationally feasible. In Figure 4, we display the 90 cm radio contours superposed on a greyscale image of the 20 cm data displayed in Figure 1. The r.m.s. noise in the 90 cm image is approximately mJy. Note that the only 20 cm source not also observed at 90 cm is the one identified pulsar in the cluster, PSR 1744-24A. Our data provides strong evidence that this pulsar is continuously enshrouded by material lost from the companion. However, there is a strong 90 cm source, which we have labelled N’ (see Figure 4 and Table 1) which is not visible at all in the 20 cm image. This source must either have a spectral index between 90 and 20 cm, or vary dramatically with time. This argues strongly for the identification of N’ as a pulsar. It is worth noting that neither N’, nor any of the other point radio sources found in Terzan 5, has a position which agrees with either of the two known x-ray sources in that cluster Johnston et al. (1995); thus, radio emission from x-ray binaries is unlikely to be the cause of any of the point sources reported in this cluster.
2.2 Liller 1
The strong central emission observed in Terzan 5 made the non-detection Johnston et al. (1991) of the nearly equally dense and equadistant cluster Liller 1 seem particularly surprising. While the 20 cm observations of Johnston, Kulkarni and Goss (1991) reached the deep limit of Jy, the data were taken in A configuration which has a beamsize of , and thus greatly over-resolve the core radius of the cluster Djorgovski (1993). If the cluster were to contain a number of sources, a lower resolution image would be more sensitive. We therefore observed Liller 1 at 20 cm in the CnB configuration, which, at this wavelength, has a beamwidth of approximately at the declination of Liller 1. This observation revealed a Jy source. In order to determine the spectral index of this emission we observed Liller 1 at 6 cm in the DnC configuration, and re-reduced 90 cm B configuration archival observations made by Johnston and Kulkarni using 3-D imaging. We find a 90 cm (330 MHz) flux density of mJy and a 6 cm (4885 MHz) flux density of Jy.
2.3 NGC 6544
Although NGC 6544 has been searched extensively for pulsed radio sources Biggs & Lyne (1996) even after our discovery of a radio source in this cluster Fruchter & Goss (1990), no pulsar has been found. Nonetheless we followed up our low-resolution imaging of this cluster with deep A-array 20-cm imaging and B-array 6-cm observations. Additionally the cluster was observed by Helen Johnston and colleagues at 90 cm in B array. We have also reduced these archival data. A source of mJy is found at 90 cm. At 20 cm, the flux density is mJy. No source was detected at 6 cm, with a upper limit to the flux density of 75 Jy. The 20 cm position , , agrees, within the rather large () errors with the 90 cm source, and is within of the position found by Shawl and White (1986) for the optical center of the cluster. There is no evidence of an extended emission in any of the images. Although the spectral index of the source between 90 and 20 cm is only 1.1, between 90 cm and 6 cm it is greater than 2.5, strongly implying that the radio emission from this cluster is produced by one or more pulsars.
2.4 NGC 6440, NGC 6539, NGC 6624
As noted previously, after our detection of strong 20 cm emission from a number of southern clusters, deep pulsed surveys were undertaken at Jodrell and Parkes to locate these objects as pulsars. In three cases, NGC 6440 Manchester et al. (1989), NGC 6539 D’Amico et al. (1993), and NGC 6624 Biggs et al. (1994) these surveys detected pulsars coincident with the 20 cm emission. All three of these clusters were re-observed by us at 20 cm using the A-array of the VLA and at 6 cm in the B-array. Additionally, NGC 6440, one of the two richest clusters in our sample, was also reobserved in the BnA, B and CnB arrays at 20 cm. All observations were done in continuum mode, employing two orthogonal polarizations in each of two 50 MHz bandpasses, typically centered on the sky frequencies of 1465 and 1515 MHz at 20 cm 4835 and 4885 MHz at 6 cm. NGC 6539 and NGC 6624 were each observed for 2 hours at 20 cm in the A array and 2.2 hours at 6 cm in the B array. NGC 6440 was observed at 20 cm for 4.7 hours in the A array, and 3 hours in each of the BnA, B and CnB arrays. NGC 6440 was also observed at 6 cm for 3.5 hours in the B array. All of the resulting observations are consistent with a single point source dominating the flux density from each of the clusters, and each of these point sources is consistent with the position of a known pulsar in a cluster. In the case of NGC 6440, a small variation in flux density () was seen between images taken in the different VLA configurations; however, the size of the variability is comparable to that expected from the scintillation of the known pulsar, and there is no evidence that the flux density of the cluster increases with lower resolution, as would be the case were a diffuse population of pulsars contributing significantly to the total flux density. In Table 2 the source positions and flux densities are compared with those of the known pulsars in the cluster cores. The agreement of the positions and flux densities is excellent.
EDITOR: INSERT TABLE 2 HERE
2.5 47 Tucanae
All of the observations so far discussed were performed at the VLA. However, the rich and relatively nearby globular cluster 47 Tuc is too far south to be observed from New Mexico, and was therefore not included in our original survey. As 47 Tuc has more detected pulsars than any other cluster, this was a particularly unfortunate omission. Since FG90, however, archival observations taken by David McConnell and Jon Ables of 47 Tucanae using the 6 km Australia Telescope Compact Array (ATCA), have become public. We therefore have reduced these data. Two orthogonal linear polarizations in each of two bandpasses centered on 1408 and 1708 MHz were used. Each bandpass was divided into 4 MHz channels, and a total effective bandwidth of 104 MHz was obtained. The data were taken on the 24-25 Jan 1992 (13 hours) and the 23-25 April 1992 (48 hours). The final image is shown in Figure 5. The image has noise of Jy/beam, where the beam is essentially circular with a FWHM.
Five objects with flux density greater than Jy are visible in our radio image in a radius of about about the center of 47 Tucanae; their positions and flux densities are listed in Table 3. Based upon positional coincidence, two of these sources can clearly be associated with the two of the brightest pulsars yet discovered in the cluster, 47TucC and 47TucD Manchester et al. (1991); Robinson et al. (1995); furthermore, when our position for Source 2 is used a starting position for the pulsar timing data of 47 Tuc, a timing solution is found for the eclipsing pulsar 47TucJ (Fernando Camilo, personal communication). Source 2 is highly variable and has a steep spectrum – over the course of the ATCA observations the flux density of this source varied by more than a factor of two, and its average flux densities at 1408 and 1708 MHz are Jy and Jy respectively, corresponding to a spectral index of . Therefore, it is highly likely that Source 2 is 47TucJ.
EDITOR: INSERT FIGURE 5 HERE
Based on number counts of faint field radio sources, we would expect, by chance, to detect about sources brighter than Jy within our search radius Condon (1984). Thus there is no strong statistical reason to believe that either of sources 1 or 3 is a pulsar. Additionally, we find no evidence of extended diffuse emission in the cluster. After convolution of the image with both a and a beam we find limits on emission from the center of the cluster of 0.9 and 1.5 mJy per beam respectively. Although these beams are large enough to encompass the most recent measurement of the core radius of 47 Tucanae, De Marchi et al. (1996), we note that none of the identified pulsars lie within of the cluster center. If the observed pulsars, rather than the reported core radius, provide the best estimate of the distribution of fainter pulsars in the cluster, than one would need perhaps as many as ten beams to properly cover the cluster, and the limit on extended emission would be, at a minimum, several mJy.
EDITOR: INSERT TABLE 3 HERE
3 Discussion
Our observations of Terzan 5, Liller 1 and NGC 6544 have revealed steep-spectrum radio emission even though these clusters do not possess known pulsars (or, in the case of Terzan 5, known pulsars coincident with the sources of most of the observed radiation). In this section we show that this emission is almost certainly produced by a significant population of pulsars so far undetected by pulsed searches.
We have therefore used a Monte Carlo simulation to determine whether our observations of the total radio emission of Terzan 5 are consistent with the standard luminosity function (as shown in Equation 1). Pulsar populations were created to simulate Terzan 5 using a range of , (the power-law exponent, see Equation 1), and total pulsar population. For each set of parameters, we determined the probability of creating a population whose brightest two pulsars were within a factor of two of the two brightest point sources in our Terzan 5 image (the eclipsing pulsar and the steep spectrum source north of the the cluster center) and whose remaining total luminosity agreed, again within a factor of two, with the observed total luminosity of the central region of the cluster. As was found in FG90, the ability to fit the data is largely independent of the assumed . However, the quality of our fits depends strongly on . The 90% confidence interval is found to be , with the best fit at . This striking agreement with the well-observed field luminosity function and the M15 pulsar luminosity function derived by Anderson (1992) makes it appear highly probable that all of the radio emission observed from Terzan 5 is produced by pulsars.
Our observations of Liller 1 and NGC 6544 are, however, significantly less informative. All of our detections of Liller 1 are with beamsizes larger than the cluster core radius. Thus our inability to resolve the emission and study its luminosity function is not surprising. Nonetheless the signal-to-noise ratios of our detections are good enough to allow us to obtain an accurate radio position in spite of our large beam. In Table 4, we compare the position of the radio emission with that of the optical cluster and the X-ray source in Liller 1. All radio positions agree; therefore we have reported only the 6 cm position, which has the smallest error ellipse.
EDITOR: INSERT TABLE 4 HERE
Although the reported position of the rapid X-ray burster in Liller 1 Grindlay et al. (1984) is offset from the radio position by about 8 arcseconds, or about , evidence has recently been growing of a correlation between the 6 cm flux density of Liller 1 and the X-ray strength of MXB 1730-335 Guerriero et al. (1998); Fox et al. (1998); Rutledge et al. (1998). The agreement between the radio source and the position of the center of the globular cluster reported by Liller Liller (1977) is good; however, the position of the optical center of the cluster is controversial. Grindlay et al. (1984) report a position which disagrees by several arcseconds with that of Liller. However, Grindlay et al. used U band plates for their work whereas Liller worked in the R and I bands. As the visual extinction to this object is estimated at magnitudes Djorgovski (1993), we have used Liller’s position in the table.
Although the astrometric situation remains uncertain, an identification of our 6 cm source with MXB 1730-335 could help explain the radio spectrum of Liller 1. Figure 6 shows a plot of the radio data versus observing frequency. Pulsar spectra are usually steeper at shorter rather than longer wavelengths Manchester & Taylor (1977). The object in Liller 1, however, shows the opposite trend. Indeed, our 20 cm flux density is Jy greater than the A configuration limit of Johnston, Kulkarni and Goss (1991). Averaging our 20 cm data with theirs would make this spectral break even more evident. We think it probable then that we may indeed be seeing flux from the Liller 1 X-ray source in our 6 cm data; given that our 20 and 90 cm observations have flux densities significantly brighter than the 6 cm flux densities observed at X-ray outburst (the 90 cm flux density is more than a factor of brighter than outburst levels), we doubt this object contributes significantly to our 90 or 20 cm images. Indeed, observations of X-ray binaries have typically found centimeter radio spectra that are inverted or flat, and rather than steeply declining as seen here Hjellming (1998).
EDITOR: INSERT FIGURE 6 HERE
Given that our Terzan 5 observations confirm that the standard field pulsar luminosity function can be applied to cluster millisecond pulsars, we can use our Monte Carlo simulations to estimate the number of pulsars in these clusters. Assuming that the minimum 20 cm pulsar luminosity is mJy kpc2 (see Fruchter and Goss 1990 for a discussion of this assumption), we estimate that there are between 60 and 200 pulsars in Terzan 5. Similarly using Equation 2, we can use the total luminosity of Liller 1 to estimate a population of pulsars. A similar number is indicated for the other cluster with an apparent undetected pulsar in our VLA sample, NGC 6544. While these estimates of total numbers depend upon the assumed (an not well known) minimum pulsar luminosity, , it should be noted that the relative expected number of pulsars in different clusters is independent of the assumed . Furthermore, the absolute numbers derived from this method will in general underestimate the total number of pulsars. As noted earlier, all of the identified sources in 47 Tuc lie outside of a core radius from the center of the cluster, and similarly the bright sources in Terzan 5 are more than a core radius from the cluster center. This, however, is not entirely unexpected: a large fraction of millisecond pulsars are thought to be produced as a result of a collision of a binary with a third star (quite possibly the neutron star) and this interaction can scatter the binary into the outskirts (or indeed out) of the binary. Depending on the mass distribution of the cluster, this may produce a significant enhancement of the pulsar density at large radii Sigurdsson & Phinney (1995). Thus, the measurement of the diffuse radio emission within a core radius of the cluster will underestimate the number of weak pulsars in the cluster.
Yet, if the radio spectra and luminosities of these sources are consistent with their being pulsars, why then have a substantial fraction of the bright sources been missed by pulsed searches? There are two obvious possibilities: 1) Binary pulsars may be lost to pulsed surveys due to doppler smearing, even though their radio emission remains detectable by interferometric observations Fruchter & Goss (1990); Kulkarni et al. (1990); Johnston et al. (1991); 2) The pulses may be smeared beyond detectability by interstellar dispersion and scattering. Indeed, all three of the clusters found in this survey to have substantial emission unassociated with know pulsars are located in the direction of the Galactic center at uncertain but great ( kpc) distances. The resulting expected dispersion measures are large. Indeed, the 11 ms pulsar in Terzan 5, PSR 1744-24A, has a dispersion measure of 230 cm-3 pc, making searches for pulsars with periods close to 1 ms extremely difficult. Searches are presently underway at Parkes which incorporate software capable of detecting accelerated pulsars, or which coherently de-disperse the radio signal, thus largely eliminating the effect of dispersion (although not scattering) on the pulsed signal. One may hope that these searches will find the pulsed signals associated with the pulsars apparent in our data.
Yet, one of the largest puzzles of these observations may come from the clusters where pulsars were detected. Our results imply that the flux density of NGC 6440, NGC 6539 and NGC 6624 are all dominated by a single pulsar. In FG90 we used the total integrated flux density of pulsars in globular clusters to estimate the total number of pulsars in the Galactic globular cluster system. We estimated the number to lie between 500 and 2000. The fact that so many of our clusters are dominated by a single pulsar would tend to push the best estimate down to the lower end of this range. Thus our latest result only compounds a problem pointed out in FG90. While 10% of Galactic LMXBs are in clusters, only 1% of their proposed descendants live there. Is this, as we noted in FG90, related to the apparent lower luminosity of globular LMXBs – do they spin up their pulsars more slowly? Or, is it just that objects in binaries are occasionally expelled from the clusters (either with or without their companion, depending upon the interaction) and as the lifetime of a MSP is longer than that of an LMXB, there is a greater chance that it will be expelled during its lifetime? Or are the LMXB’s formed by collision in clusters somehow less fecund than the native born binaries of the disk? In these discrepant statistics may lie an important clue to understanding the evolution of cluster binaries and the formation of millisecond pulsars.
4 Acknowledgements
We would like to thank Tim Cornwell, whose programs and assistance were invaluable to our 90 cm imaging, and David McConnell, Shri Kulkarni and Helen Johnston for supporting our use of their archival data. Taft Armandroff graciously provided an I-band image of Terzan 5 obtained at the CTIO 1-m. We also thank an anonymous referee for a very careful reading of our manuscript and many helpful comments. The radio observations presented here were done at the Very Large Array of the National Radio Astronomy Observatory, which is a facility of the National Science Foundation operated under cooperative agreement by Associated Universities , Inc. and at the Australia Telescope, which is funded by the Commonwealth of Australia for operation as a national facility by CSIRO.
References
- Anderson (1992) Anderson, S. J. 1992, Ph.D. thesis, Caltech
- Biggs et al. (1994) Biggs, J., Bailes, M., Lyne, A., Goss, W., & Fruchter, A. 1994, Mon. Not. R. Astr. Soc., 267, 125
- Biggs & Lyne (1996) Biggs, J. D., & Lyne, A. G. 1996, Mon. Not. R. Astr. Soc., 282, 691
- Briggs (1995) Briggs, D. S. 1995, Ph.D. thesis, New Mexico Institute of Mines and Technology
- Condon (1984) Condon, J. J. 1984, Astrophys. J., 287, 461
- Cordes et al. (1985) Cordes, J. M., Weisberg, J. M., & Boriakoff, V. 1985, Astrophys. J., 288, 221
- D’Amico et al. (1993) D’Amico, N., Bailes, M., Lyne, A. G., Manchester, R. N., Johnston, S., Fruchter, A. S., & Goss, W. M. 1993, Mon. Not. R. Astr. Soc., 260, L7
- De Marchi et al. (1996) De Marchi, G., Paresce, F., Stratta, M. G., Gilliland, R. L., & Bohlin, R. C. 1996, Astrophys. J., 468, L51
- Dewey et al. (1985) Dewey, R. J., Taylor, J. H., Weisberg, J. M., & Stokes, G. H. 1985, Astrophys. J., 294, L25
- Djorgovski (1993) Djorgovski, S. 1993, Physical Parameters of Galactic Globular Clusters (ASP Conf. 50), 373
- Fox et al. (1998) Fox, D., Guerriero, R., Lewin, W., Rutledge, R., Moore, C., Van Der Klis, M., & Van Paradijs, J. 1998, The Astronomer’s Telegram, 1
- Fruchter & Goss (1990) Fruchter, A. S., & Goss, W. M. 1990, Astrophys. J., 365, L63
- Fruchter & Goss (1991) Fruchter, A. S., & Goss, W. M. 1991, in X-ray binaries and recycled pulsar (Dordrecht ; Boston : Kluwer Academic Publishers), 105
- Fruchter & Goss (1995) Fruchter, A. S., & Goss, W. M. 1995, Journal of Astrophysics and Astronomy, 16, 245
- Goodman et al. (1987) Goodman, J. J., Romani, R. W., Blandford, R. D., & Narayan, R. 1987, Mon. Not. R. Astr. Soc., 229, 73
- Grindlay et al. (1984) Grindlay, J. E., Hertz, P., Steiner, J. E., Murray, S. S., & Lightman, A. P. 1984, Astrophys. J., 282, L13
- Guerriero et al. (1998) Guerriero, R., Fox, D., Lewin, W., Rutledge, R., Moore, C., Van Der Klis, M., & Van Paradijs, J. 1998, IAU Circ, 6815, 2
- Hamilton et al. (1985) Hamilton, T. T., Helfand, D. J., & Becker, R. H. 1985, Astron. J., 90, 606
- Hjellming (1998) Hjellming, R. M. 1998, in Galactic and Extragalactic Radio Astronomy, Second Edition, ed. G. L. Verschuur & K. I. Kellermann (Springer-Verlag), 381
- Johnston et al. (1991) Johnston, H., Kulkarni, S., & Goss, W. 1991, Astrophys. J., 382, L89
- Johnston et al. (1995) Johnston, H. M., Verbunt, F., & Hasinger, G. 1995, Astr. Astrophys., 298
- Kaspi & Stinebring (1992) Kaspi, V. M., & Stinebring, D. R. 1992, Astrophys. J., 392, 530
- Kulkarni et al. (1990) Kulkarni, S. R., Narayan, R., & Romani, R. 1990, Astrophys. J., 356, 174
- Liller (1977) Liller, W. 1977, Astrophys. J., 213, L13
- Lyne et al. (1990) Lyne, A. G., et al. 1990, Nature, 347, 650
- Manchester et al. (1989) Manchester, R. N., Lyne, A. G., Johnston, S., D’Amico, N., Lim, J., Kniffen, D. A., Fruchter, A. S., & Goss, W. M. 1989, IAU Circ, 4905, 2
- Manchester et al. (1991) Manchester, R. N., Lyne, A. G., Robinson, C., Bailes, M., & D’Amico, N. 1991, Nature, 352, 219
- Manchester & Taylor (1977) Manchester, R. N., & Taylor, J. H. 1977, Pulsars (San Francisco: Freeman)
- Nice & Thorsett (1992) Nice, D. J., & Thorsett, S. E. 1992, Astrophys. J., 397, 249
- Nice et al. (1990) Nice, D. J., Thorsett, S. E., Taylor, J. H., & Fruchter, A. S. 1990, Astrophys. J., 361, L61
- Picard & Johnston (1995) Picard, A., & Johnston, H. 1995, Astr. Astrophys., 112, 89
- Robinson et al. (1995) Robinson, C., Lyne, A. G., Manchester, R. N., Bailes, M., D’Amico, N., & Johnston, S. 1995, Mon. Not. R. Astr. Soc., 274, 547
- Russell et al. (1990) Russell, J. L., Lasker, B. M., McLean, B. J., Sturch, C. R., & Jenkner, H. 1990, Astron. J., 99, 2059
- Rutledge et al. (1998) Rutledge, R., Moore, C., Fox, D., Lewin, W. a. n., & Van Paradijs, J. 1998, The Astronomer’s Telegram, 8, 1
- Shawl & White (1986) Shawl, S. J., & White, R. E. 1986, Astron. J., 91, 312
- Sigurdsson & Phinney (1995) Sigurdsson, S., & Phinney, E. S. 1995, Astrophys. J. Supp. Series, 99, 609
- Stollman (1987) Stollman, G. M. 1987, Astr. Astrophys., 171, 152
- Terzan (1971) Terzan, A. 1971, Astr. Astrophys., 12, 477
TABLE 1
Terzan 5 Source Positions and Flux Densities Source error error Flux Density1 (Jy) N’ 7500 N 8 1420 A (PSR 1744-24A) 0 1340 C 230 S 230
1 Flux densities are given per beam. All flux densities, with the exception of that for the source N’ are for the beam of the 20 cm image shown in Figure 1. These sources have an error of 28 Jy/beam. Source N’ is only visible in the 90 cm image, and the flux density given is for that image (Figure 4). The 90 cm flux density error is 1.3 mJy/beam.
TABLE 2
Sources in Clusters Dominated by Known Pulsars Cluster Band Flux Density (Jy) NGC 6539 20 cm NGC 6539 6 cm NGC 6539 Pulsar1 NGC 6539 Optical2 NGC 6624 20 cm NGC 6624 6 cm NGC 6624 Pulsar3 - NGC 6624 Optical2 - NGC 6440 20 cm NGC 6440 6 cm NGC 6440 Pulsar4 NGC 6440 Optical2
1D’Amico et al. (1993)
2Shawl and White (1986)
3Biggs et al. (1994)
4Manchester et al. (1989)
TABLE 3
Positions and Flux Densities of 47 Tucanae Sources Source Flux Density (mJy) C D 1 2 3
TABLE 4
Liller 1 Source Positions Band error error Radio Optical1 X-ray2
1Liller (1977)
2Grindlay et al. (1984)
5 Figures
Figure 1: Radio contours are shown superposed on an I band image of the rich cluster Terzan 5. The 20 cm radio image combines data taken several different VLA configurations and has a beamsize of . Contour levels are -100, 100, 200, 300, 400, 500 and 1000 Jy/beam. The r.m.s. noise level in the image is 28 Jy.
Figure 2: 20 cm image of Terzan 5 using a larger synthesized beam (robust weight ) than in Figure 1. This image shows the large extent of the diffuse radio emission centered on the core of the globular cluster. The beam is and the image has an r.m.s. noise of 23 Jy/beam. the Contour levels are -100, 100, 200, 300, 400, 750, 1000 and 2000 Jy/beam.
Figure 3: 6 cm radio contours (beamsize , PA=) are are shown superposed on a 20 cm image (greyscale) of the cluster Terzan 5. The r.m.s. noise of the image is 25 Jy/beam; the radio contours are -50, 50, 80, 100, 120, 140 and 160 Jy/beam.
Figure 4: 90 cm radio contours (beamsize , PA= are shown superposed on a 20 cm image of the cluster Terzan 5 (Figure 1, now shown in greyscale). While the central emission displays a steep spectral index characteristic of pulsars, the one identified pulsar in the field, PSR 1744-24A is not detected, even though it was strong a strong source in the simultaneous 20 cm observations. This pulsar appears to be continuously eclipsed at 90 cm. The source N’ is undetected in either the 20 or 6 cm images of this cluster, implying a 90 to 20 cm spectral index, . The radio contours are , , 3, 6, 12, 24 and 48 mJy/beam; the r.m.s. noise of the image is mJy/beam;.
Figure 5: The ATCA image of the rich globular cluster 47 Tucanae. The center of the cluster is marked with an asterix, and the radio timing positions of pulsars 47TucC and 47TucD are marked with crosses. Two of the sources are identified, based on their positions, as being pulsars C and D from this cluster, and, as discussed in the text, Source 2 is most likely pulsar 47TucJ. Sources 1 and 3 remain unidentified. The observations were obtained at a wavelength of approximately 20 cm, and the beam is nearly circular with a FWHM. The contours shown are -120, 120, 240, and 480 Jy/beam; the r.m.s. noise of the image is 32 Jy/beam.
Figure 6: The flux density of the radio emission from Liller 1 as a function of observing frequency. As discussed in the text, the flux densities at 330 MHz (90 cm) and 1400 MHz (20 cm) are most likely dominated by emission from one or more pulsars, while some or most of the 4860 MHz (6 cm) emission may arise from an X-ray binary in the cluster. The line connecting the 90 and 6 cm flux densities is used only to guide the eye, and emphasizes the particularly sharp drop in flux density between 90 and 20 cm.