Prospects for solving basic questions in galaxy evolution with a next generation radio telescope
Abstract
A Square Kilometer Array radio telescope will detect tens of thousands of galaxies per square degree in the 21cm emission line of neutral hydrogen. The telescope will be sensitive to ordinary galaxy populations at redshifts when the mass density in neutral gas greatly exceeded the mass in luminous stars. Spectroscopy in the HI line will trace the kinematics of evolving galactic potentials, as well as monitoring consumption of the fuel for star formation. The OH megamaser population may be a significant indicator of merger and interaction rates for galaxies over cosmic time. Spectroscopy of the redshifted HI and OH lines provides a major incentive for designing a large radio telescope with continuous frequency coverage below 2 GHz.
1 Introduction
A number of indicators point to the period from to as the time when galaxies assembled. This period of some 3 billion years witnessed a maximum in the rate at which stars have formed and a peak in number of quasars and powerful radio galaxies. The luminous star forming galaxies that trace the rise and fall of star formation through this epoch represent a tiny fraction of the protogalactic systems that exist at this time, since neutral hydrogen clouds are known to have been abundant, amounting to far more mass than was then in stars. This leaves the bulk of the baryons destined to join galaxies below the threshold for viewing by today’s telescopes, and it means that our perception of this important epoch of history lacks a clear observational picture of the sequence and timing of events that has occurred in the coalescence of mass to form galactic potential wells and their present contents of stars, gas and dust.
Theoretical simulations, which are successfully tuned to produce the large scale structure starting from initial conditions that are consistent with the level of fluctuation in the microwave background, predict mass distribution functions for the protogalaxies through this period of galaxy formation. These simulations, which are based on the gravitational collapse of a Cold Dark Matter dominated Universe, demonstrate a hierarchical clustering that leads to the desired large-scale behavior and shows galaxies forming by the dissipationless merging of low mass dark matter mini-halos halos and the subsequent accretion of condensing, dissipational gas (cf. White & Frenk 1991, Kauffman 1996, Ma et al 1997).
The postponement of the assembly of massive galaxies in the CDM models is somewhat at odds with observations showing powerful radio galaxies at redshift above (van Breugel et al 1999) and evidence for large gaseous disks in well-formed potentials at (Prochaska & Wolfe 1999). A crucial test of the formation ideas will be to measure the sizes of galaxies and their total dynamical masses as a function of redshift in order to define time sequence of galaxy formation.
The next section reviews the considerable indirect evidence that bears on this epoch, leading to the conclusion that a large radio telescope, capable of sensing the abundant cool gas confined to the evolving potential wells, will clarify the history of galaxies through this critical period. Subsequent sections address the specific observational tests.
2 Evolution of global properties to
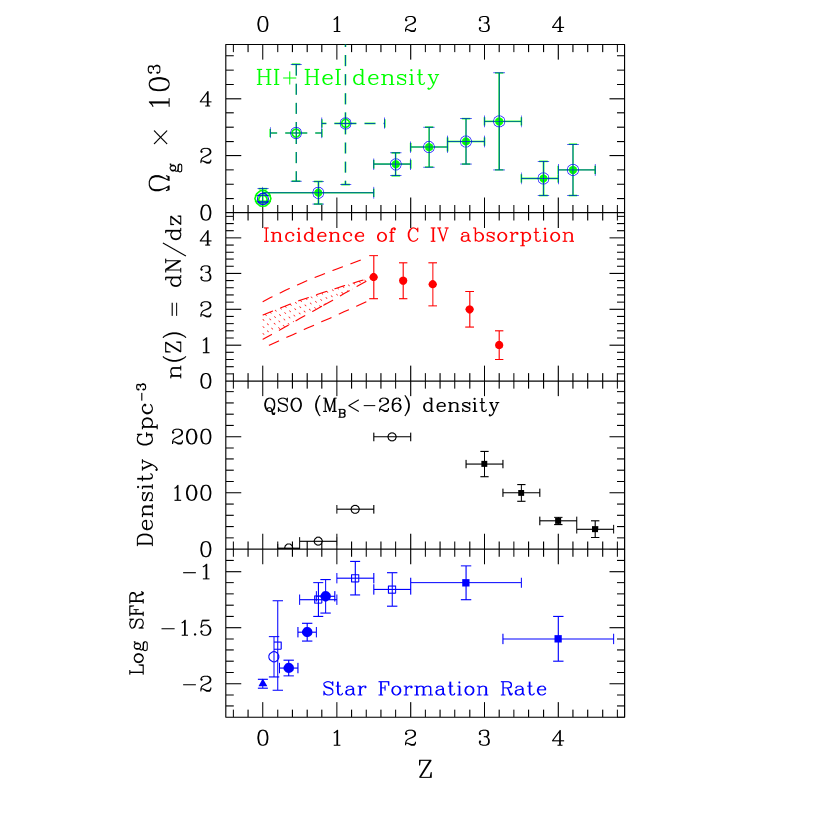
A number of indicators trace global properties of the Universe through the epoch of most vigorous assembly of galaxies. Fig. 1 shows four of these plotted as a function of redshift. (1) The star formation rate SFR density computed for color-selected, star forming galaxies (cf Madau et al 1996, Calzetti and Heckman 1999) shows a steep rise with redshift to with a modest decline at higher redshifts. More recent observational evidence (Steidel et al 1999) favors a flat SFR density above to at least , once corrections have been made for extinction. (2) The comoving space density of luminous optically selected quasars reaches a maximum at , implying that mass is being redistributed within the evolving galaxies to efficiently feed nuclear activity. (3) Studies of absorption lines against the ultraviolet continua of bright high redshift quasars provide probes of the comoving density of neutral gas, through studies of the damped Lyman- DLa line of HI (Wolfe et al 1986), as well as (4) the ionized galaxy halo gas that is sensed in CIV (Steidel 1990). Quasar absorption lines are especially relevant for the studies of normal galaxies, since they are not biased toward the luminous objects at the peak of the luminosity function for a chosen redshift, but rather the quasar absorption lines provide a democratic selection of the common, gas rich objects that represent the less rapidly evolving protogalaxies that are contain the bulk of the baryons destined to eventually be locked into galaxies at .
The DLa lines are especially relevant to the discussion here, since the quantities of cool neutral gas sensed in these high redshift absorbers exceeds the local HI comoving density by a factor of at least five (Wolfe et al 1995, Lanzetta 1995), and the HI is a viable target for radio studies in the 21cm line of HI. The DLa class comprises neutral gas layers with H0 column densities above cm-2, while the MgII selection chooses column densities of H0 down to levels cm-2.
The HI content contained in the DLa population of absorbing cloud suffers uncertainty in the high redshift regime. The same clouds that absorb in the Lyman- line, also show absorption by common metals that originated in a prior generation of stars. The same generation of stars will have produced dust, and the resulting extinction may cause lines of sight with DLa absorbers to be selected against when samples of high quasars are composed for spectroscopic study (Pei et al 1999). A detailed appraisal of the extinction leads Pei et al (1999) to conclude that the DLa statistics may underestimate the neutral gas density at by a factor of two to three, for a total factor of 10 to 15 above the present density .
A large uncertainty also remains in the low DLa measures of since the Lyman- line is not shifted in the optical window observable with ground based telescopes until . This is a period of galaxy evolution when the SFR subsided, perhaps in response to depleted supplies of neutral gas from which to form stars. During this period, star formation may have changed from being fueled with largely primordial material to star formation relying on reprocessing an interstellar medium of built from stellar mass loss (Kennicutt et al 1994) of earlier generations of relatively long lived stars. An understanding of this transition is important in predicting the gas-consumption time (Roberts 1963) and the duration of star formation into the future. These uncertainties could be eliminated by using a SKA class telescope to observe the HI emission directly in a survey to redshift to perform the kinds of HI census that is being made for the local Universe now by surveys conducted with telescopes such as Arecibo (Zwaan et al 1997) and Parkes (Staveley-Smith et al 1996).
Currently operational telescopes map the detailed gas kinematics of nearby spiral galaxies in the 21cm emission line, and the analyses show that galaxies rich in neutral gas have well ordered rotation of a cool disk, much like the disk of the Milky Way. The dynamical analysis of the velocity fields of the quiescent rotating disks has been a important tool in the measurement of the total mass in galaxies and has served to specify the presence and distribution of dark matter in galaxies (cf van Albada et al 1985, Broeils 1992). In this application, the HI is a highly diagnostic tracer of the galactic potential. Even the crude resolution obtained with single-dish telescopes yields a “mass indicator” by measurement of the profile width. The settled and quiescent nature of neutral gas layers makes them a more reliable tracer of gravitational potentials than emission line gas in HII regions around star forming regions, where stellar winds and expanding shock fronts compete with gravitation in determining the gas kinematics.
The apparent absence of isolated neutral gas clouds without an associated galaxy in the nearby Universe (Zwaan et al 1997, Spitzak and Schneider 1999) suggests that the neutral gas relies on a confining potential to maintain the gas at sufficient density that the it can remain neutral in the face of an ionizing background radiation field. Perhaps under the conditions of “adequate” confinement for preservation of neutrality, it is difficult to avoid the instabilities that lead to cooling, collapse and star formation. In such a picture, the shallower potential wells of the lower mass dwarf galaxies would be the places where the HI is more gently confined and evolutionary processes would generally proceed more slowly. Indeed, this is the domain inhabited by the dimmest of the gas-rich LSB galaxies. The expectation is that the DLa clouds at high redshift must also be confined in order to remain neutral, and they too will be tracers of their confining potentials.
In many respects, the neutral clouds giving rise to the the DLa absorbers have similar properties to the interstellar media of gas rich galaxies. They typically have a mix of cold clouds and a thinner, turbulent medium (Briggs & Wolfe 1983, Lanzetta & Bowen 1992, Prochaska & Wolfe 1997) whose physical conditions vary from mildly ionized to the more highly ionized “halo” gas characterized by the CIV absorption lines and represented by well studied lines of sight through the Milky Way halo. Metal abundances in the DLa clouds show considerable variance around the expected trend of enrichment over time (Pettini et al 1997), and there is now evidence that the DLa clouds are a distinct population (Pettini et al 1999) apart from the active star forming galaxies found through color selection (Steidel et al 1999). The onset of the CIV absorption (see Fig. 1) is another symptom of wide-spread star formation, as metals are produced and redistributed in the ISM and halos (Steidel 1990, Sembach et al 1999).
3 Gas-rich clouds vs. active star forming galaxies

An interesting comparison can be made between the observed sizes of the high- star forming galaxies (Giavalisco et al 1996a) and the interception cross-sections for uv absorption by different ions (cf. Steidel 1993). The Lyman-break color-selection technique for identifying the star forming galaxies produces candidates with a density on the sky of arcmin-2 for objects with redshifts predominantly in the range (Steidel et al 1998). The comoving density of galaxy “sites,” computed for this redshift range, amounts to arcmin-2 (for a cosmological model with ). Fig. 2 shows the cross section for absorption lines that every galaxy site would necessarily present, if ordinary galaxies are to explain the observed incidence of absorption lines. Thus, absorption line statistics indicate 2 times the absorption cross sections shown in Fig. 2 for every Lyman-break galaxy. At low and intermediate redshifts (), the association of the metal line absorbers with the outer regions of galaxies has been well established for the MgII class of absorber by observation of galaxies close to the lines of sight to the background quasars (Le Brun et al 1993). The CIV selected systems are consistent with galaxy halo cloud properties (Petijean & Bergeron 1994, Guillemin & Bergeron 1997), and ionized high velocity cloud (HVC) analogs for the CIV cloud population exist in the halo of the Milky Way (Sembach et al 1999). A few of the DLa absorbers are also identified with galaxies at intermediate redshift (Steidel et al 1994, Steidel et al 1995). The optical identification of the DLa systems has gone more slowly than for the MgII, for example, because DLa absorbers are rarer (as indicated by the relative cross sections), and the majority of the surveys for DLa systems have been conducted with ground-based telescopes, which find systems that are difficult to associate with galaxies. Curiously, some of the studies of the lowest redshift DLa absorbers have failed to provide any optical identification to sensitive limits (Rao & Turnshek 1998).
The overall implication of a comparison between the physical sizes of the Lyman-break galaxies and the absorption-line cross sections for the high- Universe is that there is a substantial population of metal-enriched gaseous objects, possibly accompanied by a tiny pocket of stellar emission, that can well go unnoticed in deep optical images. The nature of these invisible absorbers remains a puzzle. Do the basic skeletons of today’s galaxies exist already at redshifts greater than 3 as partially filled gravitational potential wells of dark matter – each well binding a star forming nuclear region, a large disk of neutral gas, and an extended halo structure of ionized, metal-enriched gas? Or, are the statistical cross sections for absorption plotted in Fig. 2 actually the integrals of many much smaller absorption cross sections created by much less strongly bound, small clouds that coalesce steadily since to form the large galaxies at ? In the latter case, the star-forming Lyman Break population would represent a very tiny fraction of the protogalaxy population. Will all galaxies pass through such a star-forming phase, or will they be accreted to the onto the LB objects? Would the tiny DLa clouds need to be bound in dark matter mini-halos in order to avoid photoionization as has occurred in the intergalactic medium? Are the DLa clouds clustered together or are they bound to the outskirts of the LB galaxies? These are important questions since the DLa population appears to be a gravitationally confined population containing enough baryons to produce the stellar matter at , and if these clouds are largely cool and unevolved, their kinematic and dynamic properties can be studied directly in no way other than at radio wavelengths.
4 The big questions
The big question is centered on the sequence for construction of the galaxy population. Do galaxies form in a hierarchical manner as described by the CDM simulations? Can merging and accretion be gentle enough to produce the cool flattened disk galaxies like the spiral population at ?
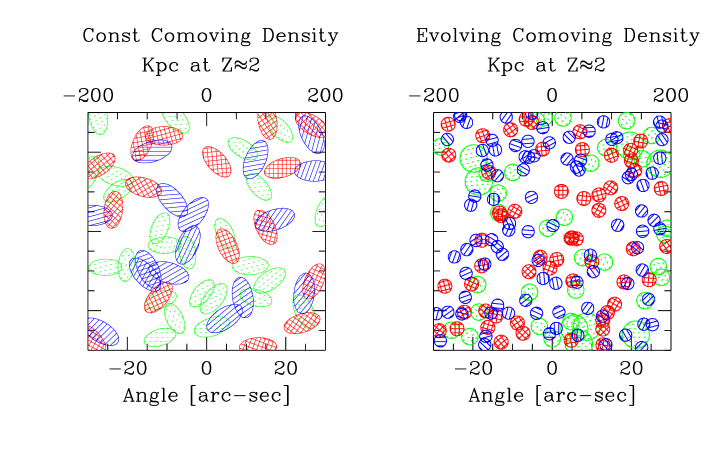
Fig. 3 is a schematic view of the observational consequences for the two scenarios – one with large objects already in place at high and one relying on hierarchical merging. In order to build up the cross section required by the DLa statistics at , there must be several disks per unit per square arcminute along a randomly chosen direction. The left panel in Fig. 3 illustrates this idea with disks whose comoving number density is constant over time from to and whose diameters are adjusted to match the DLa interception probabilities (Lanzetta et al 1995). There is an 50% probability of interception by a DLa over a redshift path from 0 to 4. The right panel in Fig. 3 has individual spherically shaped clouds that decline in radius toward higher redshifts as , while maintaining the same integral interception cross section per unit redshift as in the left panel. This requires that there be many more clouds to build up the required integral cross section. The metal line systems, such as CIV, have larger cross section, as shown in Fig. 2, and a similar diagram plotted for CIV statistics would provide near complete coverage of the sky, with a significant probability of multiple CIV absorbers along a single line of sight, as is observed (Steidel 1990).
The angular size scales of the DLa absorbers range over a few arcseconds, which is a good match to the sub-arcsecond resolution obtained by a radio interferometer array with baselines of a few kilometers to a few hundred kilometers. As depicted in Fig. 2, these objects are everywhere in the sky, so a sufficiently sensitive telescope would find them in surveys of randomly chosen fields. A further consequence of the existence of vast numbers of these objects is that they should frequently be seen in absorption against background radio sources. Roughly one half of the radio galaxies and quasars at will lie behind DLa clouds.
The prospects for making definitive emission and absorption experiments are discussed in the following sections. These observations include detection and mapping of HI emission from individual high redshift galaxies, as well as statistical studies of the HI content contained in sub-classes of optically selected objects. Measuring 21cm absorption against background sources might be an effective way to settle the question of spatial extent and dynamical mass content of the DLa population; the absorption experiments could be tackled during the next few years – with existing telescope arrays.
A consequence of hierarchical formation models is that galaxies should undergo repeated merging and accretion events. At the most noticeable merging systems are also bright far infrared emitters and often are hosts for OH megamasers. The brightest megamasers are so luminous that they could be seen throughout the Universe. This may provide a means to directly measure the galaxy merging rate as a function of time, without bias due to dust obscuration.
5 Monitoring the HI content of the Universe

The expectation for detection of HI-rich galaxies at different redshifts is straightforward to calculate. To provide the framework for these estimates, Fig. 4 summarizes simulations of the number of detected signals per unit of survey solid angle per unit of radio frequency. These units are chosen to facilitate comparison between the sky density of OH megamasers and more common but less luminous emission from ordinary galaxies in the 21cm line. The detection rates are computed for a range of cosmological models. Computed sensitivity levels assume signal profile widths of 300 km s-1 with optimally smoothed spectra. The detection threshold levels are: 1 mJy, 0.2 mJy, 5Jy, and 0.75Jy. The levels at 5Jy and 0.75Jy are 7 for 8 and 360 hour integrations respectively with a telescope with the nominal specifications suggested for SKA (Taylor & Braun 1999).
The calculation is based on the number density of galaxies of given HI mass described by the HI mass function of Zwaan et al (1999), truncated at the low mass end at M⊙. This mass function follows a Schechter form, which has power law rise toward low masses with index and a knee at M⊙ ( km s-1 Mpc-1) above which the mass function cuts off sharply with exponential dependence.
A SKA Deep Field HI survey would yield gas rich galaxies from a 1 square degree field. The most numerous detections would probably fall in the redshift range . These objects would be excellent tracers of large scale structure.
5.1 Low redshift:
For low redshifts, the Zwaan et al mass function should provide a reasonably reliable estimate of the detection rate. Through the redshift range from to , the Deep Field survey would observe the decline of the HI mass content of the Universe, as mass is increasingly locked up in stars. The difference between the star formation rate density (as measured in optical surveys) and gas consumption rate will specify the role of stellar mass loss in replenishing the ISM and prolonging star formation into the future.
5.2 Direct detection of protogalaxies at
As a framework for discussion, the calculation of Fig. 4 has adopted a constant comoving density of non-evolving galaxies. This cannot be correct at high redshifts. We know that there is more neutral mass at than at present. Whether this will also translate into an increased number of detections above what is specified by these calculations is not clear. Whether the HI is parceled in large or small masses will be the deciding factor. In order to illustrate the difficulty in measuring small HI masses predicted by hierarchical clustering scheme, the figure has dots drawn to indicate the highest redshift at which non-evolved and 0.1 galaxies would be detected, for the , cosmology. For a SKA Deep Field requiring 360 hours of integration, the galaxies are detected to redshift and an 0.1 to .
The goal of observing reshifts around would be resolve the considerable uncertainty in HI mass distribution. The large excess of HI that we know exists could simply increase all galaxy sites by a factor of 10 in mass, implying that an 0.1 galaxy at present evolved from a system of 1 at , and these would be easily detected, along with the 10 around the knee in the mass function. On the other hand, a hierarchical picture would have increased numbers, say by a factor 10, of objects with some fraction of the HI mass now measured in galaxies nearby. Note that as galaxies merge and stars form, the stellar populations form a sink for neutral baryons – merging ten M⊙ protogalaxies is likely to produce a luminous galaxy with only M⊙ or less of HI mass, since much of the mass is destined to be consumed in star formation.
Individual protogalactic clumps with M⊙ would not be detected by even the long integrations of a Deep Field survey. However, the coalescing clumps may be clustered sufficiently to create detectable signals.
5.3 A statistical measure of HI in the Lyman Break Population
The detection of the small, protogalactic HI masses common to hierarchical models at redshifts around will be difficult, even with a SKA class telescope. On the other hand, considerable progress might be made with a straightforward statistical method, much sooner than the construction of a new radio telescope. Several current generation aperture synthesis telescopes (the Westerbork Synthesis Radio Telescope and the Giant Metrewave Radio Telescope in India) are equipped to observe the 21cm line redshifted to . The field of view of these telescopes can survey several square degrees of sky in a single integration with sufficient angular resolution to avoid confusion among the LB galaxies. If an adequate catalog of LB galaxies could be constructed for such a synthesis field, with of order identified LB objects with celestial coordinates and redshifts, then the radio signals could be stacked, to obtain a statistical measure of the HI content of the LB population. This would allow the “average HI content per LB galaxy site” to be determined.

6 Sizes and kinematics of the DLa Clouds
6.1 Emission observations
For nearby galaxies, synthesis mapping techniques provide measurements of the extent of the HI emission and kinematics that help to clarify the structure of the galaxies and the distribution of their dark matter component. These elegant maps and subsequent analysis typically describe the nearby galaxies with peak flux densities in the integral profiles of a few 100 mJy with sensitivity levels around mJy per velocity channel (10 km s-1 wide).
The prospects for obtaining this level of sensitivity with in high redshift galaxies are not good. Fig. 5 summarizes the expected for M⊙ galaxies as a function of redshift. For this example, the galaxies have total velocity spreads of 300 km s-1, which is observed with channel spacing of 30 km s-1. A SKA 360 hour integration cannot achieve for redshifts greater than 0.6 and hits for .
6.2 Absorption observations
Fortunately, definitive measurements can be obtained through high spatial resolution observations of absorption against extended background radio sources. Fig. 3 shows that roughly half of the radio sources with redshift greater than 4 will lie behind DLa absorbing layers. SKA sensitivities will permit absorption experiments against random high redshift radio sources in every field. In fact, a standard tool for determining a lower limit to redshifts for optically blank field radio sources may be to examine the radio spectrum for narrow absorption lines of redshifted HI.
In fact, considerable progress in assessing the extent and kinematics of the DLa class of quasar absorption line system can be made before the commissioning of SKA with minimal technical adaptation of existing radio facilities. The technique requires background radio quasars or high redshift radio galaxies with extended radio continuum emission. Some effort needs to be invested in surveys to find redshifted 21cm line absorption against these types of sources. These surveys can either key on optical spectroscopy of the quasars to find DLa systems for subsequent inspection in the 21cm line, or they can make blind spectral surveys in the 21cm line directly, once the new wideband spectrometers that are being constructed for at Westerbork and the new Green Bank Telescope are completed. Then radio interferometers with suitable angular resolution at the redshifted 21cm line frequency must be used to map the absorption against the extended background source. This would involve interferometer baselines of only a few hundred kilometers – shorter than is typically associated with VLBI techniques, but longer than the VLA and GMRT baselines. The shorter spacings in the European VLBI Network and the MERLIN baselines would form an excellent basis for these experiments, although considerable effort will be required to observe at the interference riddled frequencies outside the protected radio astronomy bands.
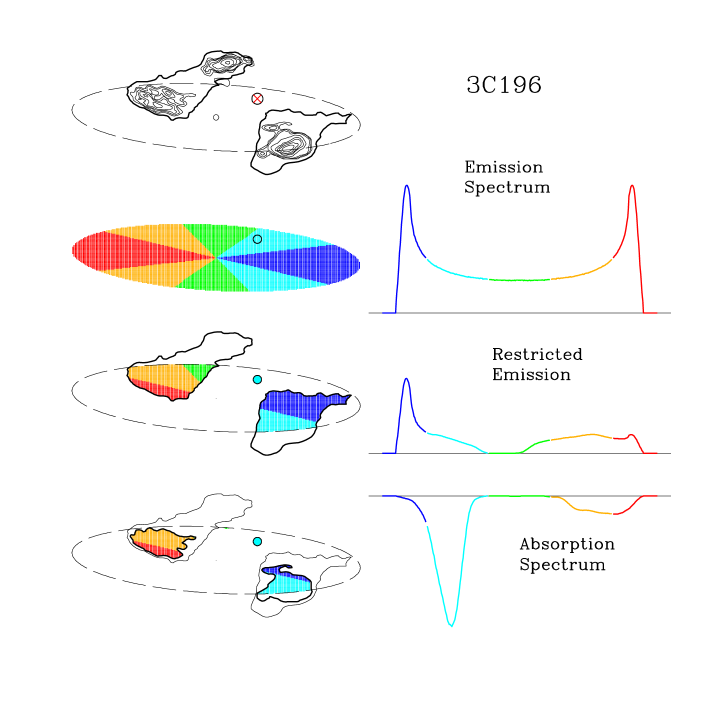
Fig. 6 shows an example of how these experiments might work. The top panel shows contours for the radio source 3C196. Brown and Mitchell (1983) discovered a 21cm line in absorption at against this source in a blind spectral survey. The object has been the target of intensive optical and UV spectroscopy (summarized by Cohen et al 1996), as well as HST imaging to identify the the intervening galaxy responsible for the absorption (Cohen et al 1996, Ridgway and Stockton 1997). Fig. 6 includes a dashed ellipse in the top panel to indicate the approximate extent and orientation of the galaxy identification.
The second panel from the top in Fig. 6 illustrates the 21cm line emission spectrum typical of nearby HI-rich disk galaxies, observed by a low resolution (“single-dish”) beam that does not resolve the gaseous structure in the galaxy. The rotation of a galaxy with a flat rotation curve produces the velocity field shown to the left of the spectrum
For disk systems observed in absorption, the information accessible to the observer is less, since we can only hope to ever learn about the gas opacity and kinematics for regions that fall in front of background continuum. This restricts our knowledge to zones outlined in the third panel of Fig. 6. The “restricted emission” spectrum is drawn to illustrate what fraction of the galaxies gas content might be sensed by a sensitive synthesis mapping observation. A comparison to the total gas content in the upper spectrum suggests that much of the important information (velocity spread, for example) would be measured by a synthesis map of the absorption against background source.
The single-dish spectrum of the absorption lines observed for an object like 3C196 is weighted by the regions where the background continuum has the highest brightness. As shown in the lower panel, this weighting emphasizes the bright spots in the radio lobes. Clearly sensitive mapping will better recover the information lost in the integral spectrum produced by a low angular resolution observation. A preliminary look at recent observations of the absorber in 3C196 can be found in de Bruyn et al (1997).
7 Direct measurement of the merger rate
OH megamasers occur in the nuclear regions of merging and heavily interacting galaxies. The galaxies are characterized by disturbed morphologies, strong far infrared emission and heavy extinction at the center. The brighter OH megamasers can be detected easily at cosmological distances. Due to the heavy obscuration, these objects are not especially eye catching, but their strong FIR flux has led to the identification of a representative sample.
Briggs (1998) argued that the OH megamasers may be a useful tool in direct measurement of the galaxy merger rate over time, since these sources would be expected to turn up in radio spectroscopic surveys, such as a SKA Deep Field. Simply counting the number of OH megamasers per volume as a function of redshift would specify the number of galaxies in the merging phase at that time. The selection is both immune to obscuration and unbiased with respect to redshift since the entire radio spectrum (aside from regions of strong rfi) can be covered with a single telescope.
Fig. 4 shows estimates for the detection rate for OH megamaser sources for comparison with the HI emission from ordinary galaxies. The OH calculations use a constant comoving density of OH megamaser hosts and the local OH megamaser luminosity function. For the levels of sensitivities reached by current radio telescopes (detection levels 0.2 to 1 mJy), the OH detections should dominate for frequencies below 1000 MHz. Given the expectation that mergers were more numerous in the past, there may be a much high detection rate for OH emission through the range that shown in the figure (Briggs 1998).
8 Conclusion
Radio mapping in the redshifted HI line with modest spatial resolution radio interferomters promises to resolve basic questions about how galaxies assemble and evolve. By observing the cool neutral gas that traces gravitational potential wells of forming galaxies, the 21cm line provides not only a measure of the neutral gas content of the Universe over cosmic time scales but also a method to weigh the dark matter halos.
Acknowledgements
The author is grateful to A.G. de Bruyn and J.M. van der Hulst for valuable discussions.
References
References
- [1] Briggs, F.H., & Wolfe, A.M., 1983, ApJ, 268, 76
- [2] Briggs, F.H. 1998, A&A, 336, 815
- [3] Broeils, A.H. 1992, A&A, 256, 19
- [4] Calzetti, D., & Heckman, T.M. 1999, ApJ, 519, 27
- [5] Cohen, R.D., Beaver, E.A., Diplas, A., Junkkarinen, V.T., Barlow, T.A., & Lyons, R.W. 1996, ApJ, 456, 132
- [6] de Bruyn, A.G., Briggs, F.H., & Vermeulen, R.C. 1997, http://www.nfra.nl/nfra /newsletter/1997-1/index.htm
- [7] Giavalisco, M., Steidel, C.C., & Macchetto, F.D. 1996a, ApJ, 470, 189
- [8] Guillemin, P., & Bergeron, J. 1997, A&A, 328, 499
- [9] Haehnelt, M.G., Steinmetz, M., Rauch, M. 1998, ApJ, 495, 647
- [10] Hewett, P.C., Foltz, C.B., & Chaffee, F.H. 1993, ApJ, 406, L43
- [11] Jedamzik, K., & Prochaska, J.X. 1998, MNRAS, 296, 430
- [12] Kauffmann, G. 1996, MNRAS, 281, 475
- [13] Kennicutt, R.C., Tamblyn, P., Congdon, C.E. 1994, ApJ, 435, 22
- [14] Lanzetta, K.M., & Bowen, D.V. 1992, ApJ, 391, 48
- [15] Lanzetta, K.L., Wolfe, A.M., & Turnshek, D.A. 1995, ApJ, 440, 435
- [16] Le Brun, J., Bergeron, J., Boisse, P., & Christian, C. 1993, A&A, 279, 33
- [17] Ma, C.-P., Berschinger, E. 1994, ApJ, 434, L5
- [18] Ma, C.-P., Berschinger, E., Hernquist, L., Weinberg, D.H., & Katz, N. 1997, ApJ, 440, L1
- [19] Madau, P., Fergueson, H.C., Dickinson, M.E., Giavalisco, M. Steidel, C.C., & Fruchter, A. 1996, MNRAS, 283, 1388
- [20] Madau, P. 1998, in The Hubble Deep Field, eds. M. Livio, S.M. Fall, & P. Madau, STScI Symposium Series, astro-ph/9709147
- [21] Pei, Y.C., Fall, S.M., & Hauser, M.G. 1999, ApJ, 522, 604
- [22] Petijean, P., & Bergeron, J. 1994, A&A, 283, 759
- [23] Pettini, M., Smith, L.J., King, D.L., & Hunstead, R.W. 1997, ApJ, 486, 665
- [24] Pettini, M., Ellison, S.L., Steidel, C.C., & Bowen, D.V. 1999, ApJ, 510, 576
- [25] Prochaska, J.X., & Wolfe, A.M. 1997 ApJ, 487, 73
- [26] Ridgway, S.E., & Stockton, A. 1997, AJ, 114, 511
- [27] Rao, S.M., & Turnshek, D.A. 1998, ApJ, 500, L115
- [28] Roberts, M.S. 1963, ARAA, 1, 149
- [29] Schmidt, M. Schneider, D.P., & Gunn, J.E. 1994, AJ, 107, 1245
- [30] Sembach, K.R., Savage, B.D., Lu, L.,& Murphy, E.M. 1999, ApJ, 515, 108
- [31] Spitzak, J. G., & Schneider, S. S. 1999, ApJS, 119, 159
- [32] Staveley-Smith, L. Wilson, W.E. Bird, T.S., Disney, M.J., Ekers, R.D., Freeman, K.C., Haynes, R.F., Sinclair, M.W., Vaile, R.A., Webster, R.L., & Wright, A.E. 1996, PASA, 13, 243
- [33] Steidel, C.C. 1990, ApJS, 72, 1
- [34] Steidel, C.C. 1993, in The Environment and Evolution of Galaxies, eds. J.M. Shull & H.A. Thronson, Kluwer Academic Publ., p. 263
- [35] Steidel, CC., Pettini, M., Dickinson, M., & Persson, S.E. 1994, AJ, 108, 2046
- [36] Steidel, C.C., Bowen, D.V., Blades, J.C., & Dickinson, M. 1995, ApJ, 440, L45
- [37] Steidel, C.C., Adelberger, K., Giavalisco, M., Dickinson, M., Pettini, M, & Kellogg, M. 1998, in The Young Universe, eds. d’Odorico, Fontana, and Giallongo, ASP Conference Series. (astro-ph/9804237)
- [38] Steidel, C.C., Adelberger, K.L., Giavalisco, M., & Pettini, M. 1999, ApJ, 519, 1
- [39] Taylor, A.R., & Braun, R. 1999, Science with the Square Kilometer Array: A next generation world radio observatory
- [40] Turnshek, D.A. 1997, in Structure and Evolution of the Intergalactic Medium from QSO Absorption Line Systems, eds. Petitjean, P., & Charlot, S., p. 263
- [41] van Albada, T.S., Bahcall, J.N., Begeman, K., & Sancisi, R. 1985, ApJ, 295, 305
- [42] van Breugel, W., de Breuk, C., Stanford, S.A., Stern, D., Rottgering, H., Miley, G. 1999, ApJ, 518, L61
- [43] Wolfe, A.M., Turnshek, D.A., Smith, H.E., Cohen, R.D. 1986, ApJS, 61, 249
- [44] Wolfe, A.M., Lanzetta, K.M., Foltz, C.B., & Chaffee, F.H. 1995, ApJ, 454, 698
- [45] Zwaan, M., Briggs, F., Sprayberry, D., & Sorar, E. 1997, ApJ, 490, 173