A BeppoSAX observation of the merging cluster Abell 3266
Abstract
We present results from a BeppoSAX observation of the rich cluster Abell 3266. The broad band spectrum (2-50 keV) of the cluster, when fitted with an optically thin thermal emission model, yields a temperature of 8.10.2 keV and a metal abundance of 0.170.02 in solar units, and with no evidence of a hard X-ray excess in the PDS spectrum. By performing a spatially resolved spectral analysis we find that the projected temperature drops with increasing radius, going from 10 keV at the cluster core to 5 keV at about 1.5 Mpc. Our BeppoSAX temperature profile is in good agreement with the ASCA temperature profile of Markevitch et al. (1998). From our two-dimensional temperature map we find that the gradient is observed in all azimuthal directions. The temperature gradient may have been caused by a recent merger event also responsible for a velocity dispersion gradient measured in the optical band. The projected metal abundance profile and two-dimensional map are both consistent with being constant.
Subject headings:
X-rays: galaxies — Galaxies: clusters: individual (Abell 3266)1. Introduction
Abell 3266 (hereafter A3266), also known as Sersic 40/6, is a rich, nearby (z 0.055, Teague et al. 1990), cluster of galaxies. It has been extensively studied at both optical and X-ray wavelengths. In the optical band various authors have studied the dynamics of this cluster by analyzing the velocity dispersion of a large number of galaxies (e.g. Teague et al. 1990, 152 galaxies; Quintana, Ramirez & Way 1996, hereafter QRW, 387 galaxies). QRW found evidence of a decrease of the velocity dispersion with increasing distance from the cluster core. Similar results were also reported by Girardi et al. (1997). The velocity dispersion radial gradient and the presence of a distorted central dumb-bell galaxy have been interpreted by QRW as evidence of a recent merger along the NE-SW direction. According to the above authors the two subclusters started colliding about 4 Gyr ago, with the central cores coming together in the last 1-2 Gyr.
X-ray observations with the Einstein HRI (Mohr, Fabricant & Geller 1993), and the ROSAT PSPC (Mohr, Mathiesen & Evrard 1999), have confirmed that A3266 is far from being a relaxed cluster. The isophotes on the few hundred kpc scale are elongated in the NE-SW direction, while on the few Mpc scales the elongation shifts to the E-W direction. The azimuthally averaged surface brightness profile (see figure 9 of Mohr, Mathiesen & Evrard 1999), is characterized by a relatively large core radius of 500 kpc and is not well fitted by a model, confirming the non-relaxed status of this cluster. Peres et al. (1998), by applying the deprojection technique (Fabian et al. 1980), found no evidence of a cooling flow in the core of A3266. David et al. (1993), using Einstein MPC data, report a global temperature of 6.2 keV for A3266. Markevitch et al. (1998), from the analysis of ASCA data, found evidence of a strong temperature gradient in A3266. The projected temperature was found to decrease from 10 keV to 5 keV when going from the cluster core out to 1.5 Mpc. Temperature maps of A3266 (Markevitch et al. 1998; Henricksen, Donnelly & David 1999) indicate an asymmetric temperature pattern, which could be associated with the ongoing merger. Irwin, Bregman & Evrard (1999), who have used ROSAT PSPC data to search for temperature gradients in a sample of galaxy clusters including A3266, in contrast with Markevitch et al. (1998), did not find any evidence of a temperature gradient in A3266. Mushotzky (1984), using HEAO1 A2 data, found a value of 0.40.2, solar units, for the Fe abundance of A3266.
In this Letter we report a recent BeppoSAX observation of A3266. We use our data to perform an independent measurement of the temperature profile and two-dimensional map of A3266. We also present the first abundance profile and map of A3266 and the first measurement of the hard (15-50 keV) X-ray spectrum of A3266. The outline of the Letter is as follows. In section 2 we give some information on the BeppoSAX observation of A3266 and on the data preparation. In section 3 we present the analysis of the broad band spectrum (2-50 keV) of A3266. In section 4 we present spatially resolved measurements of the temperature and metal abundance. In section 5 we discuss our results and compare them to previous findings. Throughout this Letter we assume Ho=50 km s-1Mpc-1 and qo=0.5.
2. Observation and Data Preparation
The cluster A3266 was observed by the BeppoSAX satellite (Boella et al. 1997a) between the 24th and the 26st of March 1998. We will discuss here data from two of the instruments onboard BeppoSAX: the MECS and the PDS. The MECS (Boella et al. 1997b) is presently composed of two units working in the 1–10 keV energy range. At 6 keV, the energy resolution is 8% and the angular resolution is 0.7′ (FWHM). The PDS instrument (Frontera et al. 1997), is a passively collimated detector (about 1.51.5 degrees f.o.v.), working in the 13–200 keV energy range. Standard reduction procedures and screening criteria have been adopted to produce linearized and equalized event files. Both MECS and PDS data preparation and linearization was performed using the Saxdas package under Ftools environment. The effective exposure time of the observation was 7.6104 s (MECS) and 3.2104 s (PDS). The observed countrate for A3266 was 0.4880.003 cts/s for the 2 MECS units and 0.230.03 cts/s for the PDS instrument.
All MECS spectra discussed in this Letter have been background subtracted using spectra extracted from blank sky event files in the same region of the detector as the source. All spectral fits have been performed using XSPEC Ver. 10.00. Quoted confidence intervals are 68 for 1 interesting parameter (i.e. ), unless otherwise stated.
3. Broad Band Spectroscopy
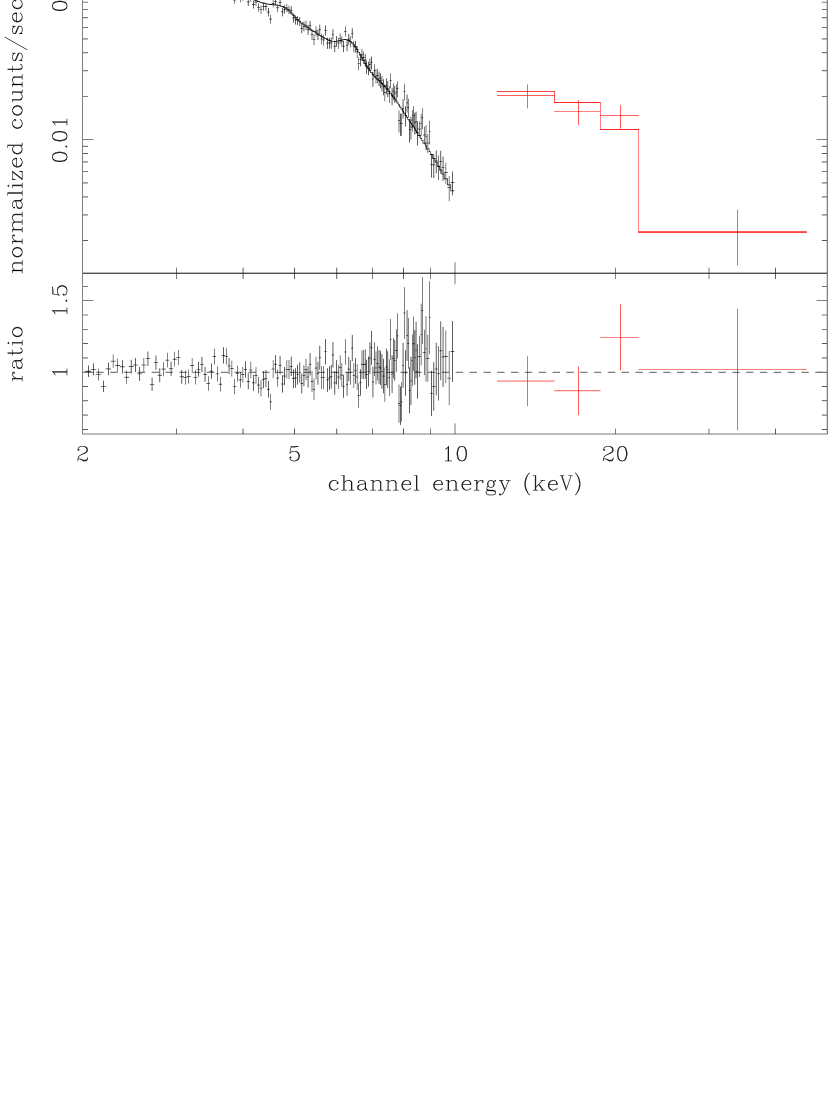
We have extracted a MECS spectrum, in the 2-10 keV band, from a circular region of 14′ radius (1.2 Mpc), centered on the emission peak. From the ROSAT PSPC radial profile, we estimate that about 89% of the total cluster emission falls within this radius. The PDS ( keV) background-subtracted spectrum has been produced by subtraction of the “off-” from the “on-source” spectrum. The spectra from the two instruments have been fitted simultaneously with an optically thin thermal emission model (MEKAL code in the XSPEC package), absorbed by a galactic line of sight equivalent hydrogen column density, , of 1.6 cm-2 (Dickey & Lockman 1990). A numerical relative normalization factor among the two instruments has been added to account for: a) the fact that the MECS spectrum includes emission out to 1.2 Mpc from the X-ray peak, while the PDS field of view (1.3 degrees FWHM) covers the entire emission from the cluster; b) the slight mismatch in the absolute flux calibration of the MECS and PDS response matrices employed in this Letter (September 1997 release); c) the vignetting in the PDS instrument, (the MECS vignetting is included in the response matrix thanks to the Effarea program described in the following section). The estimated normalization factor is 0.9. In the fitting procedure we allow this factor to vary within 15 from the above value to account for the uncertainty in this parameter. The MEKAL model yields an acceptable fit to the data, 191.3 for 176 d.o.f. The best fitting values for the temperature and the metal abundance are 8.10.2 keV and 0.170.02 respectively, where the latter value is expressed in solar units. In figure 1 we show the MECS and PDS spectra of A3266 together with the best fitting model. The PDS data shows no evidence of a hard X-ray excess.
4. Spatially Resolved Spectral Analysis
When performing spatially resolved spectral analysis of galaxy clusters one must take into account the distortions introduced by the energy dependent PSF. In the case of the MECS instrument onboard BeppoSAX, the PSF is found to vary only weakly with energy (D’Acri, De Grandi & Molendi 1998), and therefore the spectral distortions are expected to be small. Nonetheless they have been taken into account using the Effarea program publicly available within the latest Saxdas release. As explained in Molendi et al. (1999), hereafter M99, the Effarea program convolves the ROSAT PSPC surface brightness with an analytical model of the MECS PSF (see D’Acri, De Grandi & Molendi 1998, for a more extensive description). The Effarea program also includes corrections for the energy dependent telescope vignetting, which are not discussed in D’Acri et al. (1998). The Effarea program produces effective area files, which can be used to fit spectra accumulated from annuli or from sectors of annuli.
4.1. Radial Profiles
We have accumulated spectra from 7 annular regions centered on the X-ray emission peak, with inner and outer radii of 0′-2′, 2′-4′, 4′-6′, 6′-8′, 8′-12′, 12′-16′ and 16′-20′. A correction for the absorption caused by the strongback supporting the detector window has been applied for the 8′-12′ annulus, where the annular part of the strongback is contained. For the 4′-6′, 12′-16′ and the 16′-20′ annuli, where the strongback covers only a small fraction of the available area, we have chosen to exclude the regions shadowed by the strongback. For the 5 innermost annuli the energy range considered for spectral fitting was 2-10 keV, while for the 2 outermost annuli, the fit was restricted to the 2-8 keV energy range. We have used a softer energy range for the outer annuli to limit spectral distortions which could be caused by an incorrect background subtraction. The MECS instrumental background has a very hard spectrum that, in the outer regions, accounts for about 60 of the total intensity in the 8-10 keV band, and that can vary up to 10 from one observation to another.
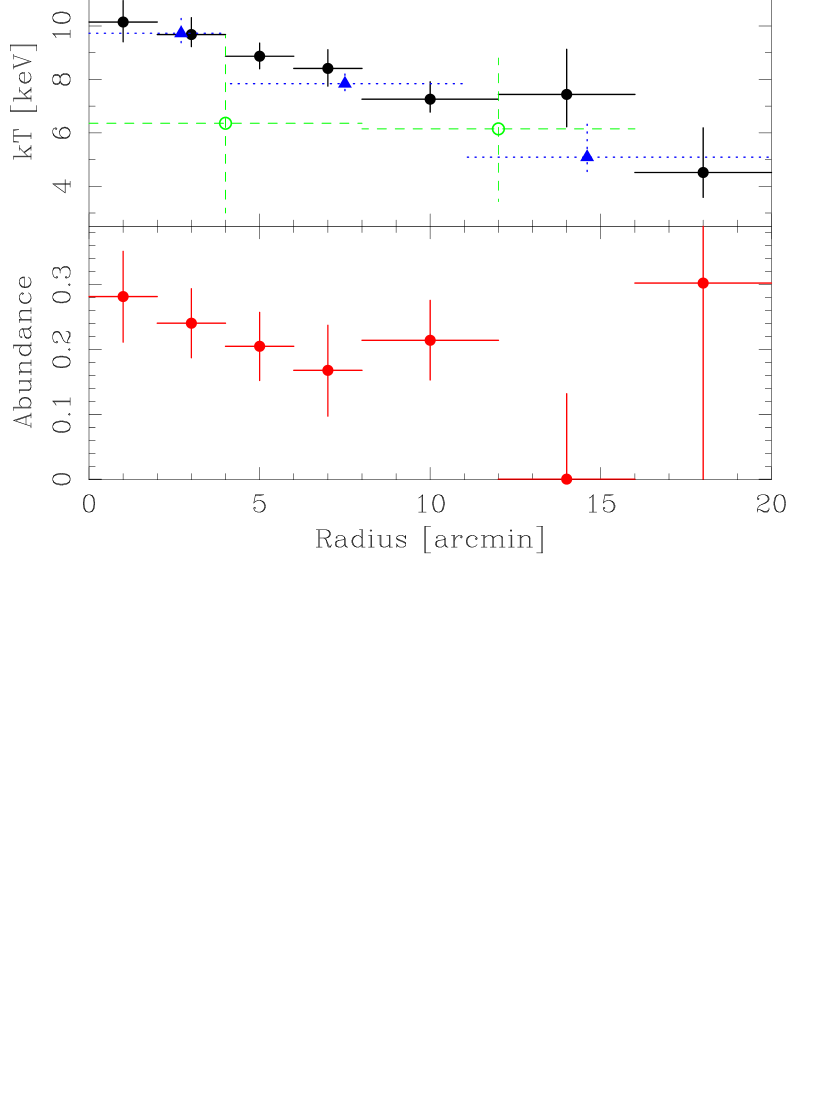
We have fitted each spectrum with a MEKAL model absorbed by the galactic , of 1.6 cm-2. In figure 2 we show the temperature and abundance profiles obtained from the spectral fits. By fitting the temperature and abundance profiles with a constant we derive the following average values: 0.3 keV and 0.210.03, solar units. A constant does not provide an acceptable fit to the temperature profile. Using the statistics we find: 17.7 for 6 d.o.f., corresponding to a probability of 0.007 for the observed distribution to be drawn from a constant parent distribution. A linear profile of the type, kT = a b r, where kT is in keV and r in arcminutes, provides a much better fit, 0.75 for 5 d.o.f. The best fitting values for the parameters are a keV, b keV arcmin-1. A constant provides an acceptable fit to the abundance profile, 4.4 for 6 d.o.f. (Prob.0.6).
As in M99, we have used the Fe Kα line as an independent estimator of the ICM temperature. Briefly we recall that the centroid of the observed Fe Kα line depends upon the relative contributions of the He-like Fe line at 6.7 keV, and the H-like Fe line at 7.0 keV. Since the relative strength of these two lines is a function of the gas temperature, the centroid of the observed line is also a function of the gas temperature. Moreover, the position of the centroid of the Fe Kα line is essentially unaffected by the spectral distortion introduced by the energy dependent PSF and depends only weakly on the the adopted continuum model. Thus it can be used to derive an independent and robust estimate of the temperature profile. Considering the limited number of counts available in the line we have performed the analysis on 2 annuli with bounding radii, 0′-8′ and 8′-16′. We have fitted each spectrum with a bremsstrahlung model plus a line, both at a redshift of z=0.055 (ZBREMSS and ZGAUSS models in XSPEC), absorbed by the galactic . A systematic negative shift of 40 eV has been included in the centroid energy to account for a slight misscalibration of the energy pulseheight-channel relationship near the Fe line. To convert the energy centroid into a temperature we have derived an energy centroid vs. temperature relationship. This has been done by simulating thermal spectra, using the MEKAL model and the MECS response matrix, and fitting them with the same model, which has been used to fit the real data. In figure 2 we have overlaid the temperatures derived from the centroid analysis on those previously obtained through the thermal continuum fitting. The two measurements of the temperature profile are in agreement with each other. Unfortunately, the modest statistics available in the line does not allow us to say much more than that.
4.2. Maps
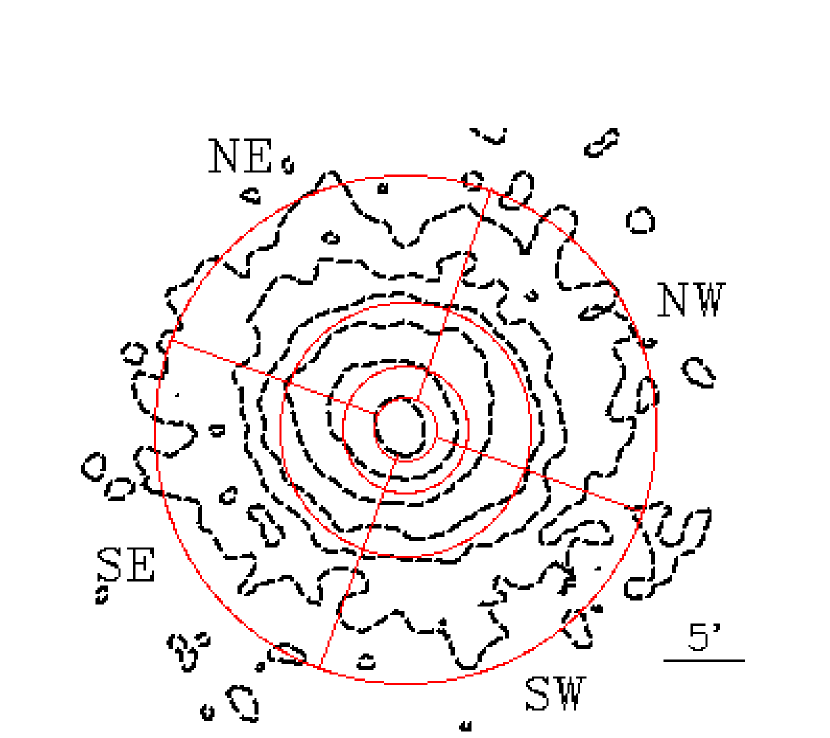
We have divided A3266 into 4 sectors: NW, SW, SE and NE. Each sector has been divided into 3 annuli with bounding radii, 2′-4′, 4′-8′ and 8′-16′. The orientation of the sectors has been chosen so that the North-South division roughly coincides with the apparent major axis of the X-ray isophotes. In figure 3 we show the MECS image with the sectors overlaid. A correction for the absorption caused by the strongback supporting the detector window has been applied for the sectors belonging to the 8′-16′ annulus. For the sectors in the 2′-4′ and 4′-8′ annuli, we used the 2-10 keV energy range for spectral fitting, while for the 8′-16′ annulus we adopted the 2-8 keV range. We have fitted each spectrum with a MEKAL model absorbed by the galactic .
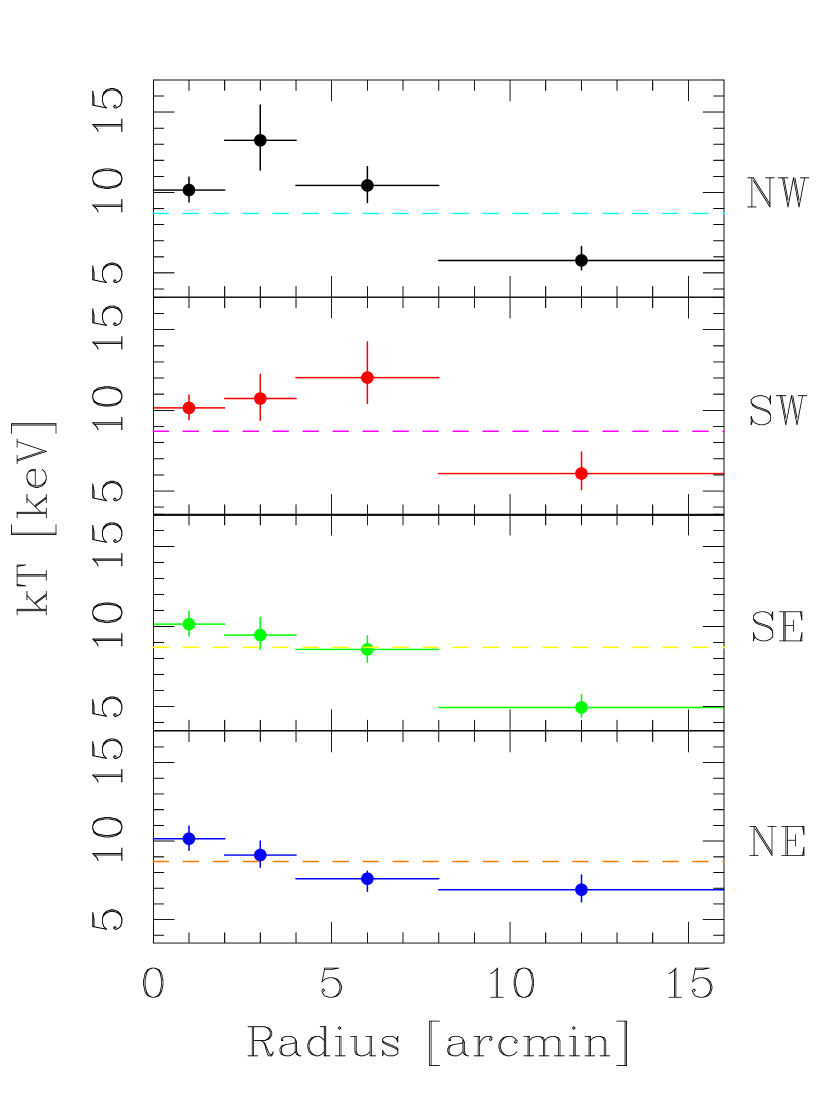
In figure 4 we show the temperature profiles obtained from the spectral fits for each of the 4 sectors. Note that in all the profiles we have included the temperature measure obtained for the central circular region with radius 2′. Fitting each radial profile with a constant temperature we derive the following average sector temperatures: 8.80.5 keV for the NW sector, 9.60.5 keV for the SW sector, 8.10.5 keV for the SE sector and 8.20.4 keV for the NE sector. For all sectors we find a statistically significant temperature decrease with increasing radius. From the statistics we find for 3 d.o.f. (Prob.) for the NW sector, for 3 d.o.f. (Prob.) for the SW sector, for 3 d.o.f. (Prob.) for the SE sector and for 3 d.o.f. (Prob.) for the NE sector. In the SE and NE sectors the temperature decreases continuously as the distance from the cluster center increases. In the NW and SW sectors the temperature first increases, reaching a maximum in either the second (NW sector) or third (SW sector) annulus, and then decreases. Interestingly, a fit to the temperatures of the 4 sectors in the third annulus (bounding radii 4′-8′) with a constant, yields for 3 d.o.f., with an associated probability for the temperature to be constant of 0.03, indicating that an azimuthal temperature gradient may be present near the core of the cluster. More specifically the eastern side of the cluster appears to be somewhat cooler than the western side. From the analysis of the abundance map we find that all sector averaged abundances are consistent with the average abundance for A3266 derived in the previous subsection The values derived from the fits indicate that all abundance profiles are consistent with being constant.
5. Discussion
Previous measurements of the temperature structure of A3266 have been performed by Markevitch et al. (1998), using ASCA data, and by Irwin, Bregman & Evrard (1999), using ROSAT PSPC data. Markevitch et al. (1998) find a decreasing radial temperature profile. In figure 2 we have overlaid the temperature profile obtained by Markevitch et al. (1998) using ASCA data, to our own BeppoSAX profile. The agreement between the two independent measurements is clearly very good. A linear profile of the type, kT = a b r, where kT is in keV and r in arcminutes, which provides an acceptable fit to the ASCA profile ( for 1 d.o.f.) yields best fitting values: a keV, b keV arcmin-1. These values are in good agreement with those derived from the BeppoSAX data. Recently Irwin, Bregman & Evrard (1999) have used ROSAT PSPC hardness ratios to measure temperature gradients for a sample of nearby galaxy clusters, which includes A3266. In their analysis they find evidence of a radial decrease in one of the two hardness ratios sensitive to temperature variations. The authors do not attribute this variation to a temperature decrement, because a similar variation is also seen in an another hardness ratio, which is not sensitive to temperature gradients.
Optical studies by various authors (e.g., QRW, Teague et al. 1990), have shown that A3266 is characterized by a large velocity dispersion, 1000 km s-1. Moreover both QRW and Girardi et al. (1997) find evidence of a decrease of the velocity dispersion with increasing distance from the cluster core. QRW measure a velocity dispersion of 1600 km s-1 within 200 kpc from the core of the cluster and a velocity dispersion of 1000 km s-1 at a radial distance of 18′ (1.5 Mpc). Thus, it would seems that both the hot X-ray emitting gas and the galaxies visible at optical wavelengths are characterized by a decrease in their specific kinetic energy with increasing radius. From the velocity dispersion profile produced by QRW and our own temperature profile, we have computed the radial profile of the so-called parameter (Sarazin 1988), which is defined as: , where is the mean molecular weight in amu, mp is the proton mass and is the velocity dispersion. The derived profile is consistent with being flat, with an average value of , indicating that, although the specific kinetic energy of the galaxies is greater than that of the hot gas, the rate at which it decreases, with increasing radius, is the same for the galaxies and the hot gas. QRW have proposed that the velocity dispersion gradient and the presence of a distorted central dumb-bell galaxy may have resulted from a recent merger between two clusters. Evidence of a merger event can also be found from the X-ray data. The ROSAT PSPC image (Mohr, Mathiesen & Evrard 1999), shows isophotes elongated in the NE-SW direction on the few hundred kpc scale, while on the few Mpc scales the elongation shifts to the E-W direction. In the picture proposed by QRW the two clusters started colliding about 4 Gyr ago, with the central cores coming together in the last 1-2 Gyr. Incidentally a fit with a -model to the PSPC radial profile (see Mohr, Mathiesen & Evrard 1999) yields a large value for the core radius, Mpc, as might expected in the case of recent merger in the core of A3266. The radial temperature gradient found by ASCA and BeppoSAX lends further strength to the merging scenario proposed by QRW.
The map we present in figure 3 shows that the radial temperature gradient is present in all sectors. We also find an indication of an azimuthal temperature gradient occurring in the annulus with bounding radii 4′-8′ (0.35 Mpc - 0.7 Mpc); the data suggests that the eastern side of the cluster may be somewhat cooler than the western side. Very recently Henriksen, Donnelly & Davis (1999), from the analysis of an ASCA observation of A3266, find evidence of a temperature gradient in the SWNE direction indicative of an ongoing merger. The azimuthal temperature gradient found in our data corroborates the ASCA result.
The average metal abundance we find from the MECS data, , solar units, is in agreement with the value 0.40.2 derived by Mushotzky (1984), using HEAO1 A2 data, and with the average metallicity, , derived by Allen & Fabian (1998) for a sample of non-cooling flow cluster. The radial abundance profile (see the bottom panel of figure 2), does not show any strong evidence of a decrease in the abundance with increasing radius. Thus, A3266 would seem to conform to the general rule that non-cooling flow cluster do not present metallicity gradients.
References
- (1) Allen, S., W., & Fabian, A., C. 1998, MNRAS, 297, L63
- (2) Boella, G., Butler, R. C., Perola, G. C., Piro, L., Scarsi, L., & Bleeker, J. A. M. 1997a, A&AS, 122, 299
- (3) Boella, G., et al. 1997b, A&AS, 122, 327
- (4) D’Acri, F., De Grandi, S., & Molendi S. 1998, Nuclear Physics, 69/1-3, 581 (astro-ph/9802070)
- (5) David, L. P., Slyz, A., Jones, C., Forman, W., Vrtilek, S. D., & Arnaud, K. A. 1993, ApJ, 412, 479
- (6) Dickey, J. M., & Lockman, F., J. 1990, ARA&A, 28, 215
- (7) Fabian, A.C., Willingale, R, Pye, J.P., Murray, S. S, & Fabbiano, G, 1980, MNRAS, 193, 175
- (8) Frontera, F., Costa, E., Dal Fiume, D., Feroci, M., Nicastro, L., Orlandini, M., Palazzi, E., & Zavattini G. 1997, A&AS 122, 357
- (9) Girardi, M., Escalera, E., Fadda, D., Giuricin, G., Mardirossian, F., & Mezzetti, M. 1997, ApJ, 482, 41
- (10) Henriksen, M., Donnelly, R., & Davis, D. S., 1999, ApJ in press, (astro-ph/9909243)
- (11) Irwin, J. A., Bregman J. N., & Evrard A. E. 1999, ApJ in press, (astro-ph/9901406)
- (12) Markevitch, M., Forman, W.R., Sarazin, C.L., & Vikhlinin, A. 1998, ApJ, 503, 77
- (13) Markevitch, M., & Vikhlinin, A. 1997, ApJ, 474, 84
- (14) Mohr, J. J., Fabricant, D.G., & Geller, M.J. 1993, ApJ, 413, 492
- (15) Mohr, J. J., Mathiesen, B., & Evrard, A.E. 1999, ApJ, 517, 627
- (16) Molendi, S., De Grandi, S., Fusco-Femiano, R. et al., 1999, ApJL in press (astro-ph/9909228) (M99)
- (17) Mushotzky, R. F. 1984, Phys Scripta T7, 157
- (18) Peres, C. B., Fabian, A. C., Edge, A. C., Allen, S. W., Johnstone, R. M., & White, D. A. 1998, MNRAS, 298, 416
- (19) Quintana, H., Ramirez, A., & Way, M.J. 1996, AJ, 112, 36 (QRW)
- (20) Sarazin, C. L. 1988, X-ray emission from clusters of galaxies (Cambridge: Cambridge University Press)
- (21) Teague, P. F., Carter, D., Gray, P. M. 1990, ApJS, 72, 715