2 Observatoire Midi-Pyrénées, Laboratoire d’Astrophysique, UMR 5572, 14 Avenue E. Belin, F-31400, France
3 Institut d’Astrophysique, 98 bis Bd. Arago, F-75014 Paris, France
4 Observatoire de Paris, DEMIRM, 61 avenue de l’Observatoire, F-75014 Paris, France
The X-ray Morphology of the Lensing Galaxy Cluster Cl0024+17
Abstract
We report the analysis of a very deep ROSAT HRI observation on one of the most interesting, distant lensing clusters, Cl0024+17. Using the X-ray surface brightness we analyse the cluster morphology and constrain the gas and gravitational mass of the cluster. We confirm the small core radius of the mass halo of kpc for this cluster inferred previously from a detailed strong lensing analysis by Tyson et al. (1998) and Smail et al. (1997). Using estimated gas temperatures we find a cluster mass of about M⊙ for a fiducial radius of Mpc. This mass is lower than the mass implied by the weak lensing result of Bonnet et al. (1994) and inconsistent with a virial analysis based on the high observed galaxy velocity dispersion. The lower gravitational mass found in the present study implies, however, a gas mass fraction of the cluster e.g. at Mpc radius of well consistent with the general observations in rich clusters. This favours a lower mass value for the relaxed part of Cl0024+17 which could still be embedded in a larger structure achieving a consistency with the weak lensing observations.
Key Words.:
dark matter - gravitational lensing - Galaxies: clusters: individual: Cl0024+17 - Xrays: galaxies1 Introduction
Cl0024+17 is one of the most interesting distant (, Gunn & Oke 1975) galaxy clusters featuring gravitational lensing effects. In this cluster eight, partly very detailed images of a single background galaxy have been identified (Colley, Tyson, & Turner 1996, Tyson, Kochanski, & Dell’Antonio 1998) which allows very detailed modeling of the underlaying mass distribution of the cluster center. It is also the cluster in which the first very large scale gravitational shear field has been detected and characterized (Bonnet, Mellier, & Fort 1994) with a significant shear signal out to a radius of almost 3 Mpc (the typical virial radius of very rich clusters).
The cluster has been discovered by Humason & Sandage (1957) and was one of the first targets to display the so-called Butcher-Oemler effect (Butcher & Oemler 1978). Dressler & Gunn (1982), Dressler, Gunn, & Schneider (1985) and Schneider, Dressler, & Gunn (1986) have found that the cluster is very rich, but has a large number of blue galaxies, confirming now with a redshift survey the earlier found Butcher-Oemler effect.
Gravitational arcs were discovered in the cluster by Koo (1988) and subsequently studied by a number of authors (Mellier et al. 1991, Kassiola, Kovner, & Fort 1992, Kassiola et al. 1995, Smail et al. 1997, Wallington, Kochanek, & Koo 1995, Colley et al. 1996, Tyson et al. 1998). The most impressive arc system is located at a radius of about 35 arcsec ( kpc) presumably very close to the critical radius of the cluster lens. The redshift of the lensed background galaxy, which is very difficult to determine due to the lack of covenient emission lines for the redshift of the source (e.g. Mellier et al. 1991), has recently been measured by Broadhurst et al. (1999) to be .
Various mass estimates have been conducted for the cluster. From the measured line-of-sight velocity dispersion of km s-1 and an optical core radius of kpc, Schneider, Dressler & Gunn (1986) calculate a gravitational mass of M⊙ within a radius of Mpc. On a much larger scale Bonnet et al. (1994) find a lensing mass of about M⊙ within a radius of Mpc. A recent analysis of the shear field of Cl0024+17 is also included in the work by van Waerbeke et al. (1997). Mass estimates for the central region of the cluster are discussed in section 4.
In the following we will be using a Hubble constant of km s-1 Mpc-1 and and indicate the scaling of important parameters with km s-1 Mpc-1. For this cosmology 1 arcmin at the cluster redshift corresponds to a comoving scale of kpc. In Section 2 we describe the observations and the morphological analysis. Section 3 provides mass estimates and in Section 4 we discuss these results in comparison with the lensing properties of the cluster.
2 ROSAT Observations
Cl0024+17 was observed with the ROSAT HRI in January 1994, July 1994, July 1995, and June to July 1996 with a total effective exposure time of 116.5 ksec. Fig. 1 shows the ROSAT HRI image of the cluster in the form of a contour plot. The image was divided by the exposure map, background subtracted, and corrected for vignetting effects. The image has been smoothed with a variable Gaussian filter, with a filter sigma varying from arcsec for the brightest to arcsec for the fainter regions, in order to provide a large dynamical range for the display of structural features. There are several point sources discussed in detail by Soucail et al. (1999).
Significant diffuse emission is detected from the cluster source out to a radius of about 1.5 arcmin ( Mpc). The total source count rate within a radius of 2 arcmin is cts s-1 where the count rate of the closest point source with cts s-1 has been subtracted. Assuming a temperature of 3.6 keV (this assumption is justified in Section 3) and considering the measured galactic hydrogen column density, cm-2 (Dickey & Lockman 1990), this corresponds to a flux of erg s-1 cm -2 and a rest frame X-ray luminosity of erg s-1 in the ROSAT band (0.1 - 2.4 keV). These results are very insensitive to the assumed temperature, would we have adopted a temperature of 7 keV for example the derived X-ray luminosity would be erg s-1. These values are consistent with the X-ray data quoted in Smail et al. (1998).

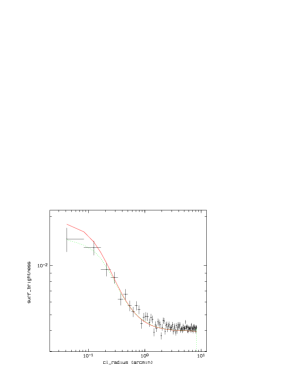
We have determined an azimuthally averaged surface brightness profile for the HRI observation of Cl0024+17. A fit of a -model (e.g. Cavaliere & Fusco-Femiano 1976, Jones & Forman, 1984) of the form
| (1) |
to the data is found to provide a good description of the surface brightness profile. Note, however, that the fit is restricted to the inner Mpc where we see significant X-ray emission. First we fitted the model directly to the photon data binned in concentric rings. Alternatively we took the smoothing effect of the HRI point spread function (PSF) into account by performing a 2-dimensional convolution of the -models with the HRI on-axis PSF (David et al. 1995) before fitting to the observational data. The cluster has a surprisingly small core radius – only kpc in physical scale. In this case accounting for the PSF has a significant effect. The fitting results are summarized in Table 1 and the best fitting model is shown in Fig. 2 along with the observed data. In the fits the parameters for the core radius and are correlated and therefore have large individual uncertainties. For a 68% uncertainty level we find the following constraints for the two parameters: and .
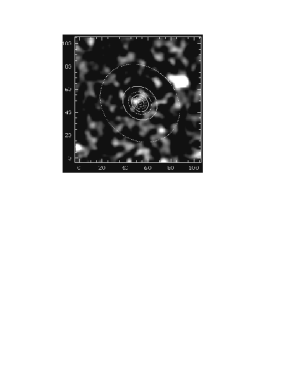
As can be seen in Fig. 1, the cluster has a slight elongation in a northeast-southwest direction. To further quantify the cluster shape we have fitted a global elliptical model with one global slope parameter, . The best fitting ellipse has an orientation with a position angle of 41.5 degrees measured counter-clockwise from the north with a major axis core radius of 15″ and a minor axis core radius of 13″ (yielding an ellipticity of %). The slope parameter, , is well consistent with the fit of the spherically symmetric model. Note that in this analysis the profile was not deconvolved. The good agreement with the spherical model allows us to base the further analysis on the spherical model, as the effect of the ellipticity will almost average out as shown in Neumann & Böhringer (1996).
The residual image obtained by subtracting the elliptical model from the observed cluster image (smoothed with a Gaussian of ) is shown in Fig. 3. Two significant features can be noted in this image: i) there is a residual peak of the central maximum just north of the center of the elliptical model and ii) there is some more faint emission in the south than there is emission in the north (in addition to the possible faint point source which is located in the southern cluster area). Both features are easily explained as the result of a displacement of the central maximum with respect to the center of symmetry of the overall cluster. It results in an imperfect subtraction of the central maximum and the offset maximum shifts the center of the fitted ellipse slightly north with respect to the large-scale cluster center leaving residual emission in the southern part. The only significant trace of cluster substructure that can be observed in the X-ray image of Cl0024+17 is this center shift of the cluster core by about 12″ ( kpc) to the north approximately in the direction of the position angle of the ellipse model. The two residuals, the small peak at the north of the center of symmetry and the southern extension are about features. The disturbance is therefore not very large, as far as the X-ray emission can be traced ( Mpc). The bright residual feature at the upper right of Fig. 3 is a point source not related to the cluster ICM (source S1 identified in Soucail et al. 1999).
It is also important to note that the analysis of the X-ray surface brightness profile together with an assumed gas temperature of 3.6 - 8 keV yields a central cooling time of the gas of about 7 - 8 Gyr. This is probably larger than the age of the cluster at the given redshift. Thus there was not enough time to develop a steady state cooling flow and we should expect a very marginal effect due to cooling of the gas in the cluster center.
3 Cluster Mass
To determine the cluster mass we need information on the cluster gas temperature in addition to the gas density profiles which can be calculated from the observed surface brightness profiles. One possibility to infer the cluster temperature is to use the well known and reasonably tight luminosity temperature relation for X-ray clusters as given for example by Markevitch (1998) based on recent ASCA observations. Using his relation (uncorrected for the luminosity effect of cooling flows), keVerg s-1)0.5, we find a temperature of 3.6 keV as used above.
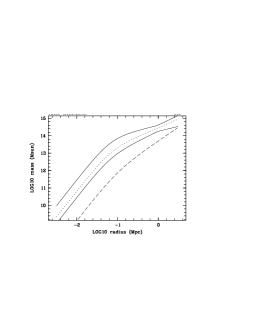
We have constructed a range of mass profiles for the cluster allowing for a large temperature range from 3.6 - 8 keV (with a best value of 6 keV) and a range from 3 - 4.5 keV (with a best value of 3.6 keV) as implied by the -relation. We are allowing for different shapes of the temperature profiles using polytropic models with a range of -parameters from 0.9 to 1.3, roughly accounting for the observed temperature variations. The temperature profile for the polytropic models were normalized such as to give the nominal emission measure weighted average temperatures. The results of the mass modeling are given in Table 2 and Fig. 4. For comparison with masses estimated from a lensing analysis two-dimensional mass profiles were also calculated assuming a cut-off radius of Mpc with results also given in Table 2. The choice of the cut-off radius has little influence on the exact result. Taking for example an outer radius of Mpc, much larger than the expected virial radius of the cluster, the projected mass increases by only about 25%.
4 Discussion and Conclusion
Comparing the gas mass fraction for Cl0024+17 with the typical values of 20 - 30% at larger radii for nearby clusters (e.g. Böhringer 1994, David, Jones, & Forman 1995, White & Fabian, 1995) we find that the 6 - 8 keV models give quite consistent results. At temperatures lower than about 5 keV the gas mass fractions are becoming too high, larger than 35% (In the sample of White & Fabian of 19 well studied nearby clusters for example non of the clusters has an observed gas mass fraction larger than 26% and even the values extrapolated to large radii never exceed 35%). We should note, however, that the gas masses at the outer radii are obtained from largely extrapolated X-ray surface brightness profiles.
Compared to the weak lensing mass of M⊙ within Mpc (Bonnet et al. 1994) and the virial mass (Schneider et al. 1986) of M⊙ within Mpc the mass deduced here from the X-ray observations is lower by a factor of 4. This discrepancy cannot be reconciled by a moderate increase of the gas temperature, we would rather have to make this the hottest cluster ever observed to obtain consistency. The X-ray gas temperature has actually been determined from ASCA observations by Soucail et al. (1999) with some uncertainty due to contaminating sources yielding keV. Note, that in comparing with the result on large scales by Bonnet et al., we have extrapolated the gas density profile from the observed outer radius of Mpc to Mpc. Since a temperature increase at large radii is phyically unlikely (see e.g. Markevitch et al. 1998) a larger mass could be obtained if the slope of the gas density profile steepens significantly. A steepening of the value by about a factor of 1.5 from the small value observed at small radii is not impossible. On the other hand the result by Bonnet et al. (1994) is derived on the assumption of spherical symmetry up to large radii. Clumping in the mass distribution can help to reduce the mass required to reproduce the observations. Another source of uncertainty is the assumed redshift of the lensed objects. All these effects could reduce but not remove the discrepancy between the two results.
A comparison with the central lensing masses is more encouraging. The lensing mass from the strong lensing model of Kassiola et al. (1992) and Smail et al. (1997) with kpc M⊙ and the weak shear estimate by Smail et al. (1996) with kpc M⊙ are roughly consistent with the upper limit of the X-ray results, while the result of Tyson et al. (1998) is a bit higher with kpc M⊙. Since in these models the most probable distance to the source was generally assumed to be slightly lower than now measured the masses reduce insignificantly for our discussion by of the order of 10%. Broadhurst et al. (1999) who also applied a lens model for a mass estimate with the newly measured arc redshift find kpc M⊙ very similar to the earlier results by Kassiola et al. (1992) and Smail et al. (1997).
While the X-ray mass may be consistent with the mass of the cluster core, there could be much more mass in an unrelaxed state surrounding the cluster. Thus the cluster could well be a somewhat scaled-up version of the Virgo cluster for which a core mass of M⊙ has been deduced from X-ray observations but a much larger mass is indicated by the large diffuse and irregular X-ray halo (Böhringer et al. 1994) and a mass of M⊙ is deduced from the Virgo infall velocity.
The most interesting morphological result is the small core radius of the cluster. In some cases equally small core radii in the X-ray surface brightness have been measured for other massive clusters with cooling flows (e.g. Perseus (Schwarz et al. 1992) or some of the the clusters analyzed by Durret et al. 1994 and Mohr et al. 1997). In this case the central surface brightness peak is related to the mean temperature drop of the gas in the cooling flow region and does not necessarily reflect a small core radius of the cluster potential. This can for example be compared to a large sample of mostly nearby clusters analysed by White, Jones, & Forman (1997) in which the core radius of the gravitational potential of the clusters was estimated such that consistent image deprojection and hydrostatic solutions were obtained. For none of the clusters a core radius smaller than 100 kpc was implied (the only exception in the sample is the radio galaxy Fornax A which is not a proper cluster). Smaller core radii for the distant lensing clusters have on the contrary often been implied by lensing studies (e.g. Miralda-Escude 1991, Mellier, Fort, & Kneib 1993). In the present case we do not expect a significant influence of central cooling. The small core radius is therefore most certainly reflecting the shape of the gravitational potential. The clusters with small core radii and cooling flows usually have dominant, central cD galaxies, which is also not found for Cl0024+17. Therefore it is very assuring that we recover a very similar core radius as the lensing models of kpc, while Tyson et al. (1998) find kpc and Smail et al. (1996) find kpc. It is probably this small core radius of the gravitational potential rather than the overall mass which makes Cl0024+17 such a spectacular gravitational lens.
Acknowledgements.
P.S. acknowledges support by the Verbundforschung under grant number 50 OR 970835. G.S. and Y.M. acknowledge support by the TMR network “Gravitational Lensing: New Constraints on Cosmology and the Distribution of Dark Matter” of the EC under contract No. ERBFMRX-CT97-0172.References
- (1) Böhringer, H., 1994, in Cosmological Aspects of X-ray Clusters of Galaxies, NATO ASI Series Vol. 441, W.C. Seitter (ed.), Kluwer, Dordrecht, p. 123
- (2) Böhringer, H., Briel, U.G., Schwarz, R.A., Voges, W., Hartner, G., & Trümper, J., 1994, Nat, 368, 828
- (3) Bonnet, H., Mellier, Y., & Fort, B., 1994, ApJL, 427, L83
- (4) Broadhurst, T., Huang, X., Frye, B., & Ellis, R.S., preprint, astro-ph 9902316
- (5) Butcher, H. & Oemler, A., 1978, ApJ, 219, 18
- (6) Cavaliere, A. & Fusco-Femiano, R., 1976, A&A, 49, 137
- (7) Colley, W.N., Tyson, J.A., & Turner, E.L., 1996, ApJL, 461, L83
- (8) David, L.P., Harnden, F.R., Kearus, K.E., & Zombeck, M.V., 1995, The ROSAT High Resolution Imager, US ROSAT Science Data Center/SAO, Cambridge MA, Feb. 1995
- (9) David, L.P., Jones, C., & Forman, W., 1995, ApJ, 445, 578
- (10) Dickey, J.M. & Lockmann, F.J., 1990, ARAA, 28, 215
- (11) Dressler, A. & Gunn, J.E., 1982, ApJ, 263, 533
- (12) Dressler, A., Gunn, J.E., & Schneider, D.P., 1985, ApJ, 294, 70
- (13) Durret, F., Gerbal, D., Lachièze-Rey, M., Lima-Neto, G., & Sadat, R., 1994, A&A, 287, 733
- (14) Gunn, J.E. & Oke. J.B., 1975, ApJ, 195, 255
- (15) Humason, M.L. & Sandage, A., 1957, in Carnegie Yearbook 1956 (Carnegie Institution of Washington), p 61
- (16) Jones, C. & Forman, W., 1984, ApJ, 276, 38
- (17) Kassiola, A., Kovner, I., & Fort., B., 1992, ApJ, 400, 41
- (18) Kassiola, A., Kovner, I., Fort., B., & Mellier, Y., 1994, ApJL, 429, L9
- (19) Koo, D.C., 1988, in Large-Scale Motions in the Universe, Rubin, V.G. & Cayne, G.V. (eds.), Princeton Univ. Press, p. 513
- (20) Markevitch, M., 1998, ApJ, 504, 27
- (21) Markevitch, M., Forman, W.R., Sarazin, C.L., & Vikhlinin, A., 1998, ApJ, 500, 138
- (22) Mellier, Y., Fort, B., Soucail, G., Mathez, G., & Cailloux, M., 1991, ApJ, 380, 334
- (23) Mellier, Y., Fort, B., & Kneib, J.-P., 1993, ApJ, 407, 33
- (24) Miralda-Ecudé, J., 1991, ApJ, 370, 1
- (25) Mohr, J.R., Mathiesen, & Evrard, A.E., 1999, ApJ, 517, 627
- (26) Neumann, D.M. & Böhringer, H., 1996, MNRAS, 289, 123
- (27) Schneider, D.P., Dressler, A., & Gunn, J.E., 1986, AJ, 92, 523
- (28) Schwarz, R.A., Edge, A.C., Voges, W., Böhringer, H., Ebeling, H., & Briel, U.G., 1992, A&A, 256,L 11
- (29) Smail, I., Dressler, A., Kneib, J.-P., Ellis, R.S., Couch, W.J., Sharples, R.M., & Oemler, A., 1996, ApJ, 469, 508
- (30) Smail, I., Ellis, R.S., Dressler, A., Couch, W.J., Oemler, A., Sharples, R.M., & Butcher, H., 1997, ApJ, 479, 70
- (31) Smail, I., Edge, A.C., Ellis, R.S., & Blandford, R.D., 1998, MNRAS, 293, 124
- (32) Soucail, G., Ota, N., Böhringer, H., Czoske, O., Hattori M., & Mellier, Y., 1999, A&A, in preparation
- (33) Tyson, J.A., Kochanski, G.P., & Dell’Antonio, I.P., 1998, ApJL, 498, L107
- (34) van Waerbeke, L., Mellier, Y., Schneider, P., Fort, B., Mathez, G., 1997, A&A, 317, 303
- (35) Wallington, S., Kochanek, C.S., & Koo, D.C., 1994, ApJ, 426, 60
- (36) White, D.A. & Fabian, A.C., 1995, MNRAS, 273, 72
- (37) White, D.A., Jones, C., & Forman, W., 1997, MNRAS, 292, 419