New X-ray Constraints on Starburst and Seyfert Activity in the Barred Spiral Galaxy NGC 1672
Abstract
The nearby barred spiral galaxy NGC 1672 shows dramatic starburst activity and may also host a Seyfert 2 nucleus. We present new X-ray observations that set constraints on starburst and Seyfert activity in NGC 1672. Two ROSAT HRI exposures, taken in 1992 and 1997, are used to investigate long-term variability of the known X-ray sources and to search for new sources of X-ray emission. We find large-amplitude (%) variability from X-3, one of the off-nuclear sources located near an end of the galactic bar. X-3 has a peak observed 0.2–2.0 keV luminosity of erg s-1, and it is probably a luminous X-ray binary or young supernova remnant. We do not observe variability of the nuclear source X-1 or the strong off-nuclear source X-2. Our analyses also reveal two new off-nuclear sources, one of which is associated with a bright region along a spiral arm, and we find evidence for large-scale diffuse X-ray emission throughout part of the disk of NGC 1672.
Furthermore, we use ASCA data taken in 1995 to constrain the hard X-ray properties of NGC 1672. While the nuclear source X-1 is the dominant soft X-ray source in NGC 1672, we find that the bulk of the 2–10 keV and 5–10 keV emission is spatially coincident with the off-nuclear source X-3, giving it an apparent 0.2–8 keV luminosity of erg s-1. A power-law plus Raymond-Smith model provides an acceptable fit to the full-band ASCA spectra. We do not find any evidence for a luminous but absorbed nuclear X-ray source. If there is a luminous Seyfert 2 nucleus in NGC 1672, it must be obscured by a ‘Compton-thick’ torus with a column density of cm-2.
1 Introduction
NGC 1672 is a barred spiral galaxy in the Southern hemisphere that is viewed nearly face on. It shows dramatic nuclear and extranuclear star-formation activity including starburst regions near the ends of its strong bar (e.g., Pastoriza 1967; Osmer, Smith & Weedman 1974; Baumgart & Peterson 1986). It may have a Seyfert 2 nucleus (e.g., Véron, Véron & Zuiderwijk 1981; Brandt, Halpern & Iwasawa 1996, hereafter BHI96), but at present this has not been firmly established. NGC 1672 is at a distance of 16.3 Mpc ( km s-1 Mpc-1), and the Galactic neutral hydrogen column density in its direction is cm-2 (Heiles & Cleary 1979).
X-ray emission is powerful for probing both the endpoints of stellar evolution and Seyfert activity, and NGC 1672 is known to be a prodigious source of X-rays. BHI96 presented a detailed ROSAT Position Sensitive Proportional Counter (PSPC) and High Resolution Imager (HRI) study of NGC 1672, and they found several sources of X-ray emission coincident with the galaxy. The nucleus showed the strongest emission. This emission was slightly resolved, suggesting at least some starburst X-ray activity, but the ROSAT data were unable to determine whether the bulk of the emission was from a starburst region or hidden Seyfert. Awaki & Koyama (1993) claimed a hard X-ray detection of a erg s-1 Seyfert nucleus with the Ginga Large Area Counter (LAC), but concerns about source confusion were present (the LAC was a non-imaging detector and had a field of view). In addition to the nuclear X-ray emission, BHI96 also found luminous X-ray sources coincident with the starburst regions near the ends of the galactic bar. It was difficult to determine the nature of these sources due to limited photon statistics. They could be consistently modeled as superbubbles, collections of X-ray binaries, or ‘super-Eddington sources’ (e.g., Fabbiano 1998).
To investigate the X-ray properties of NGC 1672 further, we performed a second ROSAT HRI observation of it in 1997. Our goals for this observation were (1) to study the long-term X-ray variability properties of the currently known sources, (2) to search for new X-ray sources that were not detected before due to their variability, and (3) to obtain better photon statistics for investigation of any weak point sources or large-scale diffuse X-ray emission. Here we present the results from our second HRI observation as well as an improved analysis of the original 1992 HRI observation. We also use ASCA data from 1995 to constrain the hard X-ray properties of NGC 1672.
2 ROSAT HRI Observations, Data Reduction, and Analysis
2.1 Observations and Basic Analysis
NGC 1672 was observed with the ROSAT HRI (e.g., David et al. 1999) during the period 27 January 1997 to 2 March 1997 (35.0 ks exposure time). The observation went smoothly, and reduction and analysis of the data were performed with the asterix software system (Allan & Vallance 1995). We created three images for subsequent analysis: (1) an image from the 1997 HRI observation, (2) an image from the original 1992 HRI observation (24.5 ks; see BHI96), and (3) a ‘combined’ image using the data from both the 1992 and 1997 observations (59.5 ks of total exposure time). All images were made with per pixel resolution so that the HRI point spread function (PSF) was oversampled by a factor of . We also used only HRI channels 3–8, since this channel range provides maximum sensitivity for detecting point sources and low-surface-brightness diffuse emission (see §3.4 of David et al. 1999).
2.2 Point Source Searching, Parameterization, and Variability
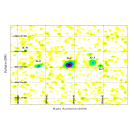
The three images described in §2.1 were analyzed using the point source searching software pss (Allan 1995). pss locates point sources by convolving an HRI image with a position-dependent model for the HRI PSF, and it calculates point source significances using the Cash (1979) statistic. We used constant backgrounds for each of the three images, and our manual background analyses showed that this is valid in the region around NGC 1672. We consider for further study point sources that are within of the center of NGC 1672 (this corresponds to the main optical extent of the galaxy) and are found to be significant at in at least one of the three images. Given these criteria, we expect false sources in total. pss also creates a ‘significance map’ showing the HRI image after it has been convolved with the PSF model; we show the significance map for the 1997 observation in Figure 1.
In Table 1 we give (background-subtracted) source counts, mean count rates, fluxes, and luminosities for all sources. We have adopted the source naming convention of BHI96 but have also added sources X-7, X-8 and X-9.222Sources X-4 and X-6 of BHI96 are omitted from Table 1 and all subsequent discussion because they are outside the main optical extent of the galaxy and the regions of strongest star formation. In addition, X-6 is probably associated with a bright foreground star. Source counts were calculated using circular regions chosen to fit the morphology of each source. When sources were not detected in one of the images, we calculated upper limits. We used the pimms (Mukai 1997) software package to convert the mean count rates for each source into 0.2–2.0 keV fluxes and luminosities. For X-1, we adopted the Raymond-Smith thermal plasma model of BHI96 to perform this conversion. For all other sources, we adopted a power-law model with a photon index of and the Galactic column density.
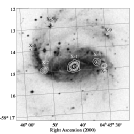
The 1997 observation has revealed a new probable X-ray source (X-8) within the optical extent of NGC 1672. This source lies near the edge of one of the prominent spiral arms. It is detected at the level, so there is a small but non-negligible chance that it is due to a statistical fluctuation. In addition, our analyses of all three images show that the extended source X-3 of BHI96 actually appears to be two separate sources (labeled here as X-3 and X-7; see Figures 1 and 2). This difference between BHI96 and our analysis is understandable because our HRI data have been through a revised processing that includes better filtering as well as satellite aspect information from the ROSAT Wide Field Camera (M. Corcoran 1998, private communication). These factors improve the spatial resolution. In addition, BHI96 used the full HRI band while we only use channels 3–8 (see §2.1). Finally, searching the 59.5 ks combined image reveals another new point source, X-9 (see Figure 2). This X-ray source is spatially coincident with a bright region along one of the spiral arms that contains three large H ii regions (numbers 31, 34 and 39 in Table 2 of Evans et al. 1996). The alignment of the X-ray and optical emission supports the reality of the X-ray detection.
To check the X-ray spatial extent results of BHI96, we have performed spatial extent analyses for X-1 and X-2 using both the 1992 and 1997 observations. Our results are in general agreement with those of BHI96: X-2 does not show any clear evidence for spatial extent while X-1 is extended on about the scale of the nuclear ring. X-1 is more extended than X-2, and this strongly suggests that its apparent extent is not an artefact of aspect solution errors (see Morse 1994).
We have compared the mean count rates between the 1992 and 1997 observations to search for long-term source variability.333The effective area of the HRI has been stable to within % during this time period (see §2.3.3 of David et al. 1999). X-3 shows significant mean count rate variability with an % increase between 1992 and 1997. The Poisson probability that this variability is merely due to a statistical fluctuation is %. We have searched for rapid variability of X-3 within the 1997 data, and we do not find any highly significant variability. The source X-5, which is thought to be associated with a foreground star (see BHI96), also shows significant variability.444On 18 October 1998 we obtained optical spectra of this star with the 1.5-m Ritchey-Chretien telescope at the Cerro Tololo Inter-American Observatory. It appears to be a G5 main-sequence star with , and it is thus at a distance of pc. The observed X-ray-to-optical flux ratio is consistent with that expected for a G5 star (see Figure 1 of Maccacaro et al. 1988), and the observed X-ray variability is not implausibly large for such a star. X-1 and X-2 do not show significant variability. We place upper limits of % and % on the variability of X-1 and X-2, respectively.
2.3 Diffuse X-ray Emission
We have used the adaptive kernel smoothing algorithm asmooth (Ebeling, White & Rangarajan 1999) to search for diffuse X-ray emission in the 59.5 ks combined image. asmooth convolves a Gaussian of variable, position-dependent size with an image to allow detection of spatial structure on a wide range of scales, and it provides a quantitative assessment of the significances of observed features. We find evidence for an area of diffuse X-ray emission between X-1 and X-2 (see Figure 3). We have examined if this emission can be explained as ‘spill over’ from X-1 and X-2, and the observed emission appears to significantly exceed that expected from these two sources (even after taking into account reasonable ROSAT aspect solution errors; see Morse 1994). Note that similar emission is not seen between X-1 and X-3 even though these two sources are closer together than X-1 and X-2 ( versus separation). asmooth indicates that the diffuse emission is significant at the level, and our manual calculations using rectangular regions give similar significances. We estimate counts in total from the diffuse emission, so the count rate is count s-1. This emission may be associated with hot, diffuse gas in the interstellar medium of NGC 1672. If we adopt a 0.55 keV Raymond-Smith model with solar abundances and the Galactic column density, we estimate a total 0.2–2.0 keV flux of erg cm-2 s-1 and a 0.2–2.0 keV luminosity of erg s-1 (the flux and luminosity values depend fairly strongly upon the unknown abundances of the gas). Of course, we are not able to prove that this emission must be from truly diffuse hot gas. It could also plausibly arise from several weak point sources that are individually below our detection threshold.
3 ASCA Observations, Data Reduction, and Analysis
3.1 Observations and Basic Analysis
NGC 1672 was observed with ASCA (Tanaka, Inoue & Holt 1994) on 23–24 November 1995. Both Solid-state Imaging Spectrometer CCD detectors (SIS0 and SIS1) and both Gas Imaging Spectrometer scintillation proportional counters (GIS2 and GIS3) were operated. The SIS were operated in 1 CCD mode, and the GIS were operated in PH mode. We have used the Revision 2 processed data from Goddard Space Flight Center for the analysis below, and we have adopted the standard Revision 2 screening criteria (see Pier 1997). After data screening, the exposure times were 33 ks for SIS0/SIS1 and 40 ks for GIS2/GIS3. Data reduction was performed using xselect (Ingham & Arnaud 1998).
The spatial resolution of ASCA is a significant limiting factor when studying NGC 1672, so we will present only the main results of our ASCA imaging analysis. The PSFs of the ASCA X-ray Telescopes have half-power diameters of (compare with Figures 1–3 and note that X-1 and X-3 are only separated by ). However, they also have fairly sharp cores that allow two point sources as close as to be resolved. In the case of the GIS, the final spatial resolution is worsened somewhat further by the detectors’ spatial responses, and the GIS cannot effectively study structure on scales smaller than . For sources observed in an approximately on-axis manner, the ASCA SIS and GIS positional uncertainties are and , respectively (90% confidence; Gotthelf 1996 and E. Gotthelf 1999, private communication).
We have created full (0.6–10 keV for SIS and 1.0–10 keV for GIS), soft (0.6–2.0 keV for SIS and 1.0–3.0 keV for GIS), hard (2–10 keV for SIS and GIS), and ultra-hard (5–10 keV for SIS and GIS) images for each of the four ASCA detectors. We also created summed SIS0+SIS1 and GIS2+GIS3 images in all bands. These images will be used in the spatial analysis below. SIS images were made with per pixel resolution, and GIS images were made with per pixel resolution.
3.2 Spatial Analysis
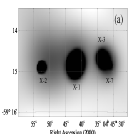
We have used ximage (Giommi, Angelini & White 1997) and idl to inspect the images created in §3.1. At low energies our results are consistent with those expected based upon the ROSAT data. X-1 is observed to be the dominant X-ray source in NGC 1672 (see Figure 4a), and we also detect X-3 and probably X-2 in the SIS images. We have compared the ASCA and ROSAT data to examine source variability. We do not find any strong evidence for variability, although source confusion (see §3.1) significantly limits our variability analyses.
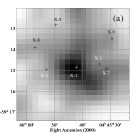
In the harder 2–10 keV and 5–10 keV images, however, NGC 1672 has a considerably different appearance (see Figure 4b). The dominant 2–10 keV emission is observed to be coincident with the HRI sources X-3 and X-7 (in both the SIS0+SIS1 and GIS2+GIS3 images), and we detect only weak 2–10 keV emission from X-1. Note that X-3 was also found to be the hardest source in the ROSAT PSPC band by BHI96. In the 5–10 keV GIS2+GIS3 image, the only detectable emission from NGC 1672 is coincident with X-3 and X-7. NGC 1672 is not detected in the 5–10 keV band by the SIS detectors, probably due to their smaller effective areas in this energy range (see Tanaka, Inoue & Holt 1994).
3.3 Spectral Analysis
Due to the limited spatial resolution of ASCA (see §3.1), we have only been able to perform reliable spectral analyses for NGC 1672 as a whole (see §7.4 of The ASCA Data Reduction Guide). At energies above 3–5 keV, X-3 is the dominant source, but at lower energies our spectra contain contributions from X-1, X-2 and X-3. We have extracted spectra from each detector using all of the acceptable exposure time, and we have only used data where NGC 1672 is reliably detected (0.6–5 keV for the SIS and 1–8 keV for the GIS). We have grouped our spectra so that there are 15 photons per spectral data point, to allow the use of fitting techniques. We have first performed preliminary spectral fitting for each of the ASCA detectors separately, and although the errors were large we obtained consistent results. We have therefore jointly fitted the spectra from all four detectors, and we detail these results below. Aside from the absolute model normalizations, we tied together the fit parameters across the four ASCA detectors. We use xspec (Arnaud 1996) for all spectral fitting below.
We start by fitting the data in the 2–8 keV band, where X-3 is the dominant source. We use a basic power-law model with the Galactic absorption column. This model provides an acceptable fit with for 56 degrees of freedom. We obtain a power-law photon index of (fit parameter errors are for ), and there is no evidence for systematic positive residuals near the 6.4–6.97 keV iron K lines. The 2–8 keV flux is erg cm-2 s-1, corresponding to a 2–8 keV luminosity for NGC 1672 of erg s-1. We have then applied this same model to the full 0.6–8 keV band. We obtain a steeper power law with and for 153 degrees of freedom. The fit is statistically acceptable, although we observe systematic positive residuals from 0.6–1.0 keV and systematic negative residuals from 1.1–1.6 keV. These are understandable in the context of the ROSAT spectral fitting presented in §2.3 of BHI96; the emission from NGC 1672 below keV appears to be largely from hot, diffuse gas that is associated with X-1, X-2 and X-3 (i.e., it is not primarily the diffuse emission discussed in §2.3). If we take the best fitting 2–8 keV model and extrapolate it downward in energy, we see clear positive residuals that are likely to be associated with the thermal gas emission (see Figure 5). We note that such emission is commonly seen from galaxies with starburst activity (e.g., Ptak et al. 1999). We have added a Raymond-Smith component to our basic power-law model, and this provides a highly significant improvement in overall fit quality. We obtain a plasma temperature of keV, a photon index of , and for 151 degrees of freedom ( compared to the basic power-law model; fit parameter errors are for ). The plasma temperature from our fit is consistent with that of BHI96, and the underlying photon index agrees better with that seen in the 2–8 keV band. The derived plasma temperature is also in good agreement with the temperatures obtained for other starburst galaxies (e.g., Figure 3 of Ptak et al. 1999). The plasma abundances are poorly constrained, and we have adopted solar abundances in the fit above. The derived plasma temperature, power-law photon index, and X-ray luminosity do not depend sensitively upon the abundance assumptions for abundance enhancements up to a factor of , and we note that Storchi-Bergmann et al. (1996) argue for moderately supersolar abundances in the nucleus of NGC 1672. In reality, we believe that the thermal emission below keV is likely to arise from gas with a range of temperatures and abundances, and our single Raymond-Smith component model should not be taken too literally (see Ptak et al. 1999 for further discussion on this matter). Comparison of the soft and hard X-ray luminosities of X-3 suggests that this source may suffer from significant intrinsic absorption (see §4 for further discussion), and we have examined if our data constrain an absorption column affecting only the power-law spectral component. Unfortunately, our data do not tightly constrain such absorption, and column densities ranging from 0 cm-2 to cm-2 are allowed by our data. Due to significant ASCA-ROSAT cross-calibration uncertainties (e.g., Iwasawa, Fabian & Nandra 1999) as well as the time variability of X-3, we have not performed detailed joint spectral fitting of the data from these two missions.
The 2–8 keV flux we measure from NGC 1672 is times smaller than the 2–10 keV flux of erg cm-2 s-1 given by Awaki & Koyama (1993), and our image analyses in §3.2 show that most of the 2–10 keV flux originates outside the nucleus. Thus, the ASCA data do not provide evidence for a highly absorbed nuclear X-ray source as might be expected for a Seyfert 2. However, the ASCA data do not rule out a Seyfert 2 nucleus where the torus has a large enough column density to absorb almost all X-rays below 8 keV. Given the emission at other wavelengths (see §3.1 of BHI96), a nuclear X-ray source with a luminosity up to erg s-1 appears plausible. We can estimate the required torus column density for a plausible scenario using our spectral fits above. We have added an extra power law to our best 0.6–8 keV fit and assumed an unabsorbed 2–8 keV flux of erg cm-2 s-1 for this power law (corresponding to a 2–8 keV luminosity of erg s-1). To represent absorption by the torus, we added an extra absorption component acting only on this power law. To allow for consistency between data and model, the fit requires the extra absorption component to have a column density of cm-2. About half of the Seyfert 2 population has torus column densities as large as this (e.g., Risaliti, Maiolino & Salvati 1999). Many Seyfert 2s with large torus column densities show strong iron K emission lines. While we do not see evidence for iron K lines in our data, our constraints are not tight. For a narrow iron K line at 6.4 keV, our 90% confidence upper limit on the equivalent width is 750 eV.
4 Discussion, Conclusions, and Future Observations
We have presented new ROSAT HRI and ASCA data that constrain starburst and Seyfert activity in NGC 1672. Notably, we do not find any evidence for hard X-ray emission associated with the nuclear source X-1 despite the claims for Seyfert activity made based upon optical emission-line, infrared emission-line, X-ray, and radio data (see BHI96 for a review). We also find no evidence for long-term soft X-ray variability of X-1. If NGC 1672 indeed has a luminous Seyfert 2 nucleus, it must have been heavily obscured during the ASCA observation by a ‘Compton-thick’ torus. Our X-ray spectral results stand in contrast to those of Awaki & Koyama (1993), who claimed to detect luminous power-law emission from an obscured Seyfert nucleus with cm-2. While it is perhaps possible that the torus column density along our line of sight has increased by a factor of between the Ginga and ASCA observations, the simplest explanation for the discrepant results is that the Ginga data suffered from source confusion. The other arguments for Seyfert activity in NGC 1672, while entirely plausible, lack robustness. The reasoning based upon the composite nature of the nuclear optical emission lines (Véron et al. 1981) relies upon fairly subtle effects, and we note that Storchi-Bergmann et al. (1996) have recently found that the nuclear emission-line ratios can be explained via ionization by hot ( K) stars. In this case NGC 1672 may be an example of a non-AGN LINER. Furthermore, Moorwood & Oliva (1988) failed to detect the broad Brackett line claimed by Kawara, Nishida & Gregory (1987), and we are not aware of any confirmation of the radio variability suggested by Tovmassian (1968). While we must still admit the possibility of a luminous, highly obscured Seyfert nucleus in NGC 1672, the physical interpretation of its optical emission lines is not yet clear, and the balance of evidence appears to be shifting away from this.
The most interesting extranuclear source in NGC 1672 is X-3. We have demonstrated that X-3 shows large-amplitude soft X-ray variability on a timescale of years, suggesting that it is a single (or at most a few) object. X-3 has a peak observed soft X-ray luminosity of erg s-1, and it probably has an even larger hard X-ray luminosity. If the hard X-ray emission of §3.2 and Figure 4b originates from X-3 (the most probable possibility in our opinion), its 0.2–8 keV X-ray luminosity is erg s-1. The fairly large ratio of hard to soft X-ray flux could be explained if X-3 suffers from some absorption within NGC 1672; the hard spectral components of starburst galaxies are often absorbed by column densities of cm-2 (e.g., Ptak et al. 1999). The variability, luminosity, and extranuclear location of X-3 suggest that it is a powerful X-ray binary, young supernova remnant, or young hypernova remnant. No supernovae are listed for NGC 1672 in the Asiago Supernova Catalogue (Barbon et al. 1999). If X-3 is an accreting compact object that emits isotropically, the mass required by the the Eddington limit is M⊙. To our knowledge, the only source in our Galaxy with a comparable X-ray luminosity is GRS 1915+105 (e.g., Greiner, Morgan & Remillard 1998), and X-3 ranks among the more luminous of the ‘super-Eddington sources’ seen in nearby galaxies (e.g., Fabbiano 1998; Colbert & Mushotzky 1999; and references therein). The new X-ray sources we find in NGC 1672 (X-7, X-8 and X-9) are also quite luminous and exceed the Eddington limit for a 1.4 M⊙ object. They too are probably X-ray binaries or supernova remnants, and sources with comparable luminosities are seen fairly frequently in nearby spiral galaxies (e.g., Read, Ponman & Strickland 1997, hereafter RPS97). We have compared the number and the luminosity distribution of our extranuclear X-ray sources with those of the nearby galaxies studied by RPS97, and NGC 1672 shows a moderately large although not extreme amount of extranuclear X-ray source activity. There are almost certainly many more X-ray binaries and supernova remnants lying below our current X-ray sensitivity threshold ( erg s-1).
A moderate-length Chandra observation holds particular promise for improving our understanding of NGC 1672. Separation of the diffuse nuclear X-ray emission from any point-like central source would provide a sensitive probe for low-level Seyfert activity. In addition, Chandra would allow an excellent imaging study of the nuclear starburst X-rays, and like the radio emission the X-rays might trace the nuclear ring (e.g., Lindblad & Jörsäter, in preparation). Furthermore, Chandra would provide much better spectral constraints upon X-3 and would detect X-ray binaries and supernova remnants down to erg s-1 in this nearby starburst galaxy.
References
- (1) Allan, D. J. 1995, asterix User Note 004: Source Searching and Parameterisation. University of Birmingham, Birmingham
- (2) Allan, D. J. & Vallance, R. J. 1995, asterix X-ray Data Processing System. University of Birmingham, Birmingham
- (3) Arnaud, K. A. 1996, in Astronomical Data Analysis Software and Systems V: ASP Conference Series 101, ed. Jacoby, G. & Barnes, J. (ASP Press, San Francisco), p. 17
- (4) Awaki, H. & Koyama, K. 1993, Adv. Space Res., 13, 221
- (5) Barbon, R., Buondí, V., Cappellaro, E. & Turatto, M. 1999, A&AS, in press (astro-ph/9908046)
- (6) Baumgart, C. W. & Peterson, C. J. 1986, PASP, 98, 56
- (7) Brandt, W. N., Halpern, J. P. & Iwasawa, K. 1996, MNRAS, 281, 687 (BHI96)
- (8) Cash, W. 1979, ApJ, 228, 939
- (9) Colbert, E.J.M. & Mushotzky, R.F. 1999, ApJ, 519, 89
- (10) David, L. P., Harnden, F. R., Kearns, K. E. & Zombeck, M. V. 1999, The ROSAT High Resolution Imager Calibration Report. U.S. ROSAT Science Data Center, Cambridge
- (11) Ebeling, H., White, D. A. & Rangarajan, F. V. N. 1999, MNRAS, submitted
- (12) Evans, I. N., Koratkar, A. P, Storchi-Bergmann, T., Kirkpatrick, H., Heckman, T. M. & Wilson, A. S. 1996, ApJS, 105, 93
- (13) Fabbiano, G. 1998, The Hot Universe: Proceedings of IAU Symposium 188, ed. Koyama, K., Kitamoto, S. & Itoh, M. (Kluwer, Dordrecht), p. 93
- (14) Giommi, P., Angelini, L. & White, N. 1997, The ximage Users’ Guide: Version 2.53. NASA/GSFC, Greenbelt
- (15) Gotthelf, E. V. 1996, ASCA News, 4, 31
- (16) Greiner, J., Morgan, E. H. & Remillard, R. A. 1998, New Astronomy Reviews, 42, 597 (astro-ph/9806323)
- (17) Heiles, C. & Cleary, M. N. 1979, Aust. J. Phys. Astrophys. Suppl., 47, 1
- (18) Ingham, J. & Arnaud, K. 1998, The xselect Users’ Guide. NASA/GSFC, Greenbelt
- (19) Iwasawa, K., Fabian, A. C. & Nandra, K. 1999, MNRAS, in press (astro-ph/9904071)
- (20) Kawara, K., Nishida, M. & Gregory, B. 1987, ApJ, 321, L35
- (21) Maccacaro, T., Gioia, I. M., Wolter, A., Zamorani, G. & Stocke, J. T. 1988, ApJ, 326, 680
- (22) Moorwood, A. F. M. & Oliva, E. 1988, A&A, 203, 278
- (23) Morse, J. A. 1994, PASP, 106, 675
- (24) Mukai, K. 1997, The pimms Users’ Guide. NASA/GSFC, Greenbelt
- (25) Osmer, P. S., Smith, M. G. & Weedman, D. W. 1974, ApJ, 192, 279
- (26) Pastoriza, M. G. 1967, The Observatory, 87, 225
- (27) Pier, E. A. 1997, ASCA Getting Started Guide for Revision 2 Data: Version 6.1. NASA/GSFC, Greenbelt
- (28) Ptak, A., Serlemitsos, P., Yaqoob, T. & Mushotzky, R. 1999, ApJS, 120, 179
- (29) Read, A. M., Ponman, T.J. & Strickland, D. K. 1997, MNRAS, 286, 626 (RPS97)
- (30) Risaliti, G., Maiolino, R. & Salvati, M. 1999, ApJ, in press (astro-ph/9902377)
- (31) Storchi-Bergmann, T., Wilson, A. S. & Baldwin, J. A. 1996, ApJ, 460, 252
- (32) Tanaka, Y., Inoue, H. & Holt, S. S. 1994, PASJ, 46, L37
- (33) Tovmassian, H.M. 1968, The Observatory, 88, 227
- (34) Véron, M. P., Véron, P. & Zuiderwijk, E. J. 1981, A&A, 98, 34
| Source | Source | Mean Count | ||||||
|---|---|---|---|---|---|---|---|---|
| Name | Image | Counts | Rate/( s-1) | erg cm-2 s-1) | erg s-1) | |||
| X-1 | 1992 | 04 45 42.2 | 14 50.3 | 22.4 | 20.9 | 7.4 | ||
| 1997 | 04 45 41.9 | 14 50.0 | 24.5 | 19.6 | 7.0 | |||
| Comb. | 04 45 42.1 | 14 50.3 | 33.1 | 19.8 | 7.0 | |||
| X-2 | 1992 | 04 45 53.0 | 14 56.5 | 10.1 | 6.6 | 2.6 | ||
| 1997 | 04 45 52.5 | 14 55.0 | 11.6 | 5.2 | 2.1 | |||
| Comb. | 04 45 52.8 | 14 55.4 | 14.6 | 5.6 | 2.2 | |||
| X-3 | 1992 | 04 45 33.9 | 14 41.3 | 7.7 | 3.6 | 1.4 | ||
| 1997 | 04 45 33.6 | 14 42.0 | 9.9 | 6.2 | 2.5 | |||
| Comb. | 04 45 33.7 | 14 42.1 | 12.8 | 5.3 | 2.1 | |||
| X-5 | 1992 | 04 45 49.6 | 12 49.0 | 5.8 | 2.7 | — | ||
| 1997 | — | — | — | |||||
| Comb. | 04 45 49.6 | 12 49.2 | 6.1 | 1.4 | — | |||
| X-7 | 1992 | 04 45 31.8 | 14 54.8 | 4.7 | 2.0 | 0.77 | ||
| 1997 | 04 45 31.0 | 14 54.0 | 6.6 | 2.3 | 0.94 | |||
| Comb. | 04 45 31.3 | 14 53.7 | 7.4 | 2.1 | 0.82 | |||
| X-8 | 1992 | — | — | |||||
| 1997 | 04 45 57.1 | 14 54.0 | 4.0 | 0.86 | 0.35 | |||
| Comb. | 04 45 57.3 | 14 54.9 | ||||||
| X-9 | 1992 | — | — | |||||
| 1997 | — | — | ||||||
| Comb. | 04 45 29.5 | 13 27.3 | 4.0 | 0.70 | 0.29 |

![[Uncaptioned image]](/html/astro-ph/9910361/assets/x6.png)
