Clustering of high-redshift galaxies: relating LBGs to dark matter halos
Abstract
We investigate the clustering properties of high-redshift galaxies within three competing scenarios for assigning luminous galaxies to dark matter halos from N-body simulations: a one galaxy per massive halo model, a quiescent star formation model, and a collisional starburst model. We compare these models to observations of Lyman-Break galaxies at . With current data and the simple statistic used here, one cannot rule out any of these models, but we see potential for finding distinguishing features using statistics that are sensitive to the tails of the distribution, and statistics based on the number of multiple galaxies per halo, which we explore in an ongoing study.
1. Introduction
Recent years have seen a new wealth of data on high-redshift galaxies. In particular, Steidel and collaborators have pioneered an efficient technique for identifying a population of galaxies between redshifts of , and more recently out to . These galaxies are known as the Lyman-break galaxies (LBGs) due to their color-selection at the Lyman-break.
One of the first things noticed about these galaxies was that they are highly clustered, and several workers have investigated whether the clustering properties of these galaxies could be used to distinguish between various cosmologies. In Wechsler et al. (1998, hereafter W98) we compared the clustering of LBGs observed by Steidel et al. (1998, hereafter S98) to N-body simulations of 4 different CDM cosmologies. W98 and a number of other authors (e.g., Katz et al. 1998, Adelberger et al. 1998, hereafter A98) have found that the clustering properties of Lyman-break galaxies can be well matched by most reasonable cosmologies.
Although it may be difficult to distinguish between cosmologies with this high-redshift data, there is still the hope that these galaxies may have much to teach us about galaxy formation. Most of the previous investigations of this subject have made simple assumptions about the relation between dark matter halos and visible galaxies, and found that the data can be well-matched by assuming a one-to-one correspondence between galaxies and the most massive halos. However, the detailed relationship is probably not this simple; in this proceeding we investigate the effects of relaxing this assumption, and focus on the question of how the clustering properties of the LBGs can help us to understand their relation to dark matter halos and constrain models of galaxy formation. In this proceeding, we use N-body simulations to calculate the expected clustering properties of high-redshift galaxies under different assumptions for their halo occupation, motivated by several popular models of galaxy formation. Before doing this, however, it is useful to investigate a simple model in order to gain understanding of how varying assumptions can affect the LBG clustering properties.
There have been two general scenarios proposed for the nature of the LBGs. In one, known as ’Central Quiescent’ (see, e.g., S98, A98, Governato et al. 1998, Baugh et al. 1998) the LBGs form only at the centers of the most massive galaxies, which slowly accrete gas and form stars. In the other, known as ’Collisional Starburst’ (e.g., Lowenthal et al. 1997, Somerville, Primack & Faber 1999, hereafter SPF, Kolatt et al. 1999) most of the LBGs are formed by small colliding galaxies that trigger a burst of star formation. Consider two simple models for the halo occupation in the above scenarios: first, for central quiescent LBGs, allow one LBG per halo above a mass threshold , and second, for collisional starburst LBGs, let the average number of LBGs per halo of mass , scale like , where — this choice is motivated further in §4. In the first case, since LBGs are found only in the most massive halos, their clustering will be biased with respect to the underlying dark matter distribution. In the second case, although collisions can be found in small-mass halos (typically ), they will preferentially be located within large halos, and the distribution of collisions should be also strongly biased.
A quantitative estimate of this bias can be obtained using the model of Mo & White (1996), who give an expression for the halo bias . The appropriate bias factor for a population of galaxies within halos more massive than is an average of weighted by the abundance of halos as a function of mass, (e.g., as estimated by the Press-Schechter 1974 approximation), and the average number of galaxies per halo :
| (1) |
where . For the simple central quiescent scenarios discussed above, and we obtain the standard expression for halo bias. We use expressions for and supplied by Sheth & Tormen (1999).
In Figure 1a, we plot at for both scenarios assuming the CDM cosmology discussed below. Because high-mass halos are weighted more strongly in the collisional starburst model, we expect galaxies to be more biased for fixed . If we are free to set the mass threshold, we see that typical collisional starburst scenarios () and central quiescent scenarios () can yield similar clustering properties. This is shown explicitly using N-body simulations by Kolatt et al. (1999).

2. Data
In the present analysis, we compare to the most recent published data of A98, who have found 376 galaxies in six fields with redshifts between 2.5 and 3.5. In analyzing this data, and ’observing’ the simulations, we use a selection function fit to a histogram of all data, assume that 100% of galaxies with are photometric candidates at , and assume that of candidates have spectroscopic redshifts.
3. Simulations
The results we present here are based on N-body simulations of the GIF collaboration, which were carried out at the Max-Planck-Institut für Astrophysik, Garching and the Edinburgh Parallel Computing Centre using codes kindly made available by the Virgo Supercomputing Consortium. The halo catalogues have been used for other purposes in, e.g., Kauffmann et al. 1999. Here we focus on one cosmology, an CDM model with and . We use dark matter halos at from a simulated box which is 141 Mpc on a side. We then test a series of models for populating these dark matter halos with visible galaxies, detailed in the following section.
Once the halos have been populated with galaxies, we observe these galaxies exactly as the data is observed, making the same assumptions about the selection function mentioned above. We normalize each model to get the correct number density of observed galaxies. This normalization is different for each type of model, and is discussed further below.
4. Models for populating halos
(1) One LBG per massive halo: This simple model for populating halos with Lyman-Break galaxies is motivated by the assumption that the luminosity of these galaxies is directly proportional to mass, and has been considered by several authors (e.g., W98, Jing & Suto 1998). In this model the number density is fixed to match the data by choosing an appropriate .
(2) Semi-analytic models with quiescent star formation: Since clearly the model discussed above is somewhat simplistic, we consider a more accurate way to fill halos with quiescently star-forming galaxies, using the semi-analytic models of SPF, which give the probability of observing galaxies of various luminosities given the mass of the halo. Here we only consider one model, referred to as SFR-M in SPF; see Wechsler et al. (1999, hereafter W99) for consideration of a wider range of models. In this class of models, the number density of objects is normalized using an adjustable dust parameter described in SPF & W99. The dust parameter we use is slightly greater than that estimated by Steidel et al. (1999) for these galaxies.
(3) A toy model for collision-driven starbursts: In the collisional starburst picture, most of the visible high-redshift galaxies are starbursting due to recent collisions. We have analyzed a very high-resolution (ART) N-body simulation of the same CDM model within a 30 Mpc box (Kravstov, Klypin & Khokhlov 1997) where halo substructure and mergers have been identified (for details see Bullock et al. 1999, Kolatt et al. 1999). Using collisions identified in this simulation, we have found that the number of collisions per host halo, , follows a power law with host halo mass , with . For further details on how this model is fit from simulations and how it might be explained, see W99. We use this power-law model to populate the GIF dark matter halos with collisional starburst galaxies. We take the minimum mass for a halo to host a collision to be ; the number density for this model is set by adjusting the constant in front of the power law.
5. Comparison of models with data
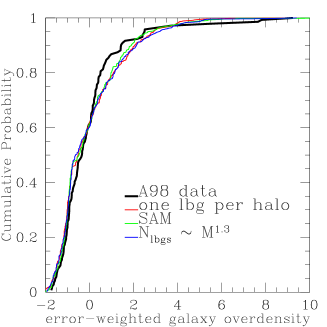
Here we just consider one statistic for comparing our models with the current data; for a more thorough analysis see W99. A standard statistic for measuring the clustering of a population is the overdensity in some region; here we consider the overdensity in cells that are in redshift and in angle. In order to minimize the contribution of cells where the selection function is very small, we instead look an error-weighted overdensity per pixel, defined as:
| (2) |
where is the number per pixel and = (.
For each model, we compare the cumulative distribution of this
statistic with that of the data (Figure 1b), and there is some
indication that the collisional model has an excess of both overdense
and underdense cells relative to the data. A detailed
Kolmogorov-Smirnov test for each model, which gives the probabilities
that the data and the model came from the same underlying
distribution, yields:
model (1):
model (2):
model (3):
In this analysis, there are 144 data pixels and 720 simulation pixels;
we do the assignment of galaxies to halos and ’observation’ of LBGs 10
times for each model to get an error estimate.
6. Discussion
The results above show that none of the three models can be rejected with this statistic and the current data, but there are indications that the different models may provide distinguishable clustering properties. In W99, we consider both a wider range of models and more discriminating statistics, including the number of close pairs and a Kuiper test, sensitive to distribution tails.
Acknowledgments.
We thank Kurt Adelberger, Sandy Faber, & Ari Maller for useful discussions. We thank Andrey Kravtsov & Anatoly Klypin for running and providing access to the ART simulations. This work has been supported by a GAANN fellowship to R.H.W., and by NSF & NASA grants at UCSC.
References
Adelberger, K. L., Steidel, C. C., Giavalisco, M., Dickinson, M., Pettini, M., & Kellogg, M. 1998, ApJ, 505, 18 (A98)
Baugh, C. M., Cole, S., Frenk, C. S., Lacy, C. G. 1998, ApJ, 498, 504
Bullock, J. S., Kolatt, T. S., Sigad, Y.,Somerville R. S., Kravtsov, A. V., Klypin A. A., Primack, J. R., Dekel, A 1999, MNRAS, submitted
Governato., F. Baugh, C. M., Frenk, C. S., Cole, S., Lacey, C. G., Quinn, T. & Stadel, J.,1998, Nature, 392, 359
Jing, Y. P. & Suto, Y. 1998, ApJ, 494, L5
Kauffmann, G., Colberg, J. M., Diafero, A., & White, S. D. M., 1999, MNRAS, 303, 188
Katz, N, Hernquist, L, & Weinberg, D. H., 1999, ApJ, 523, 463
Kolatt, T. S., Bullock, J. S.,Sigad, Y.,Somerville R. S., Kravtsov, A. V., Klypin A. A., Primack, J. R., Dekel, A 1999, ApJ, 523, 109
Kravstov, A. V., Klypin, A. A., & Khokhlov, A. M.1997, ApJS,111,73
Lowenthal, J. D., et al. 1997, ApJ, 481,673
Mo, H. J. & White, S. D. M. 1996, MNRAS, 282, 347
Sheth, R. K. & Tormen, G. 1999, MNRAS, 308, 119
Somerville, R. S., Primack, J. R., & Faber, S. M. 1999, MNRAS, in press (SPF)
Steidel, C. C., Adelberger, K. L., Dickinson, M., Giavalisco, M., Pettini, M., & Kellogg, M. 1998, ApJ, 492, 428 (S98)
Steidel, C. C., Adelberger, K. L., Giavalisco, M., Dickinson, M., Pettini, M.1999, ApJ, 457, 645
Wechsler, R. H., Gross, M. A. K., Primack, J. R., Blumenthal, G. R. & Dekel, A. 1998, ApJ, 506, 19 (W98)
Wechsler, R. H., Somerville, R. S., Bullock, J. S., Kolatt, T. S., Primack, J. R., Blumenthal, G. R. & Dekel, A. in preparation (W99)