Interstellar and Circumstellar Optical & Ultraviolet Lines Towards SN 1998S11affiliation: Based in part on observations obtained with the NASA/ESA Hubble Space Telescope, obtained at STScI, which is operated by the Association of Universities for Research in Astronomy, Inc., under contract with the National Aeronautics and Space Administration, NAS5-26555.
Abstract
We have observed SN 1998S which exploded in NGC 3877, with the Utrecht Echelle Spectrograph ( km s-1 FWHM) at the William Herschel Telescope and with the E230M echelle of the Space Telescope Imaging Spectrograph (8 km s-1 FWHM) aboard the Hubble Space Telescope. Both data sets were obtained at two epochs, separated by 19 (optical) and seven days (UV data).
From our own Galaxy we detect interstellar absorption lines of Ca II K, Fe II , Mg I , and probably Mn II , at km s-1 arising from the outer edge of the High Velocity Cloud Complex M. We derive gas-phase abundances of [Fe/H] and [Mn/H], values which are very similar to warm disk clouds found in the local ISM. This is the first detection of manganese from a Galactic HVC, and we believe that the derived gas-phase abundances argue against the HVC material having an extragalactic origin.
At the velocity of NGC 3877 we detect interstellar Mg I , Mn II , Ca II K and Na I D2,D1 absorption lines, spanning a velocity range of to km s-1 from the systemic velocity of the galaxy (910 km s-1). Surprisingly, the component at km s-1 is seen to increase by a factor of dex in (Na I) between 20-March-1998 and 8-April-1998, and in (Mg I) between 4-April-1998 and 11-April-1998.
Unusually, our data also show narrow Balmer, He I, and metastable UV Fe II P-Cygni profiles, with a narrow absorption component superimposed on the bottom of the profile’s absorption trough. Both the broad and narrow components of the optical lines are seen to increase substantially in strength between March-20 and April-8. The broad absorption covers km s-1 and is seen in Mg II absorption as well, although there is no evidence of narrow Mg II emission forming a P-Cygni profile. There is some suggestion that this shelf has decreased in strength over seven days between April-4 and April-11.
Most of the low-ionization absorption can be understood in terms of gas co-rotating with the disk of NGC 3877, providing the supernova is at the back of the disk as we observe it, and the H I disk is of a similar thickness to our own Galaxy. However, the variable component seen in all the other lines, and the accompanying emission which forms the classic P-Cygni profiles, most likely arise in slow moving circumstellar outflows originating from the red supergiant progenitor of SN 1998S.
1 Introduction
Supernovae which explode in galaxies other than our own Milky Way offer a unique opportunity to study in detail an extragalactic interstellar medium (ISM), since the supernova acts a bright background source against which absorption from gas along the sightline can be observed. Supernovae have been used successfully to probe galaxy ISMs both from the ground (e.g. Wallerstein et al. (1972); Jenkins et al. (1984); D’Odorico et al. (1985); Vidal-Madjar et al. (1987); Steidel et al. (1990); Meyer & Roth (1991)) using Ca II and Na I absorption lines, and more recently, from space with IUE (Pettini et al. (1982); Blades et al. (1988)). Since the launch of HST, we have been using the high resolution spectrographs to study the ISMs of nearby galaxies in more detail. Although a uniformity in the absorption line properties from an extragalactic ISM might be expected, considering that multiple sightlines through the Galactic ISM show very similar Mg II profiles, the characteristics observed have, in fact, been quite diverse. Towards SN 1992A, which exploded in the elliptical galaxy NGC 1380 in the Fornax Cluster, we detected no Mg II absorption to sensitive equivalent width limits (Bowen et al. (1995)), suggesting that the galaxy was devoid of neutral hydrogen, and that elliptical galaxies are unlikely to contribute significantly to the numbers of Mg II absorption systems seen at high redshift. Conversely, toward SN 1993J which arose in M81, we detected individual absorption components spanning a velocity range of km s-1, grouped into 3 subcomplexes arising in gas from the disk of M81, from our own Galaxy, and from intergalactic tidal debris from interactions between M81 and M82 (Bowen et al. (1994)). In this paper we add another sightline to our sample, that of SN 1998S, and once again find unexpected absorption line properties in the supernova’s spectrum.
The type II-L supernova SN 1998S exploded in the outer regions of NGC 3877, an edge-on Sc galaxy in the Ursa Major cluster with a heliocentric velocity of km s-1 (Broeils & van Woerden (1994)). The SN sightline lies at a projected distance of 48 arcsec from the center of the galaxy, or 3.6 kpc, assuming a distance of 15.5 Mpc to NGC 3877 (Sanders & Verheijen (1998)). An image of the supernova and its host galaxy is shown in Figure 1. In this paper we present high-resolution UV and optical spectra of the supernova, taken to probe the ISM of the host galaxy.
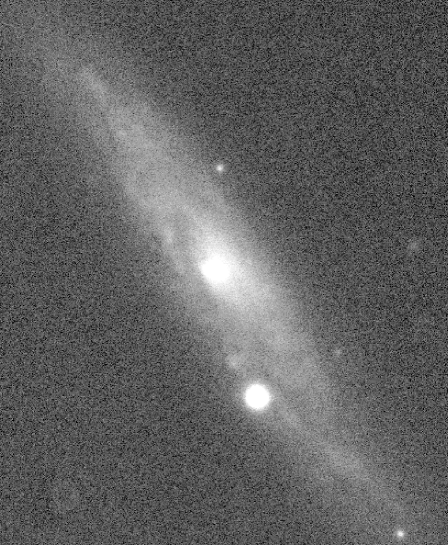
SN 1998S
2 Observations and Results
Details of the observations are given in Table 1, which lists dates of observations, wavelength ranges covered, exposure times, and spectral resolutions. HST observations of SN 1998S were made at two epochs, each with the Space Telescope Imaging Spectrograph (STIS) and E230M echelle through the 0.2x0.06 slit using the NUV-MAMA detector. We used the orders extracted by the STSDAS pipeline calibration; however, the subtraction of the extracted background spectrum resulted in a poor signal-to-noise for the final spectra, since the background count rate was a significant fraction of the total count rate. For each order, we therefore replaced the background spectrum with a single value obtained from averaging the data values in the background spectra, and subtracted this from the gross extracted counts, thereby improving the signal-to-noise of the data. Where necessary, overlapping orders were summed after weighting pixels by the inverse of the noise derived from the pipeline extractions. Optical spectra were obtained with the Utrecht Echelle Spectrograph at the William Herschel Telescope: data acquired 20-March-1998 were taken with the E31 (31.6 lines mm-1) echelle and a 2.0 arcsec slit, centered at 5430 Å; spectra taken 8-April-1998 were made with the E79 grating (79.0 lines mm-1) and a 1.0 arcsec slit, centered at 5900 Å and 4280 Å. For both data sets, a SITe1 2048x2048 CCD detector was used, and both were reduced with the NOAO echelle IRAF package.111The Image Reduction and Analysis Facility (IRAF) software is provided by the National Optical Astronomy Observatories (NOAO), which is operated by the Association of Universities for Research in Astronomy, Inc., under contract to the National Science Foundation. The Space Telescope Science Data Analysis System (STSDAS) is distributed by the Space Telescope Science Institute.
| Table 1. Chronology of Observations | ||||||
| Exp time | FHWM | T+ | ||||
| UT Date | Obsv. | Instrument | (Å) | (min) | (km s-1) | (days)a |
| 20-Mar-1998 | WHT | UES | 41906610 | 20 | 6.0 | 0 |
| 4-Apr-1998 | HST | STIS+E230M | 22773115 | 195 | 8.3 | +15 |
| 8-Apr-1998 | WHT | UES | 36205860 | 60 | 7.4 | +19 |
| 45309050 | 60 | 7.4 | ||||
| 11-Apr-1998 | HST | STIS+E230M | 22773115 | 349 | 8.3 | +22 |
| a Days after maximum light, assumed to be 20-March-1998. Discovery was 3-March-1998. | ||||||
2.1 Cold interstellar gas in the Milky Way & from HVC Complex M
Fortuitously, at Galactic co-ordinates of , , the sightline to SN 1998S intercepts the group of High Velocity Clouds (HVCs) designated as MI in Complex M (Wakker & van Woerden (1991)). The complex is thought to lie at a height of kpc above the Galactic plane (Ryans et al. (1997); Danly et al. (1993); Keenan et al. (1995)) and is the highest latitude conglomerate of HVCs known. In fact, the sightline passes through the very edge of the complex (as measured at 21 cm), but data from the Leiden/Dwingeloo 21 cm Survey (Hartmann & Burton (1997)) show that there exists strong emission at km s-1, at least over the 36 arcmin beam centered at , .
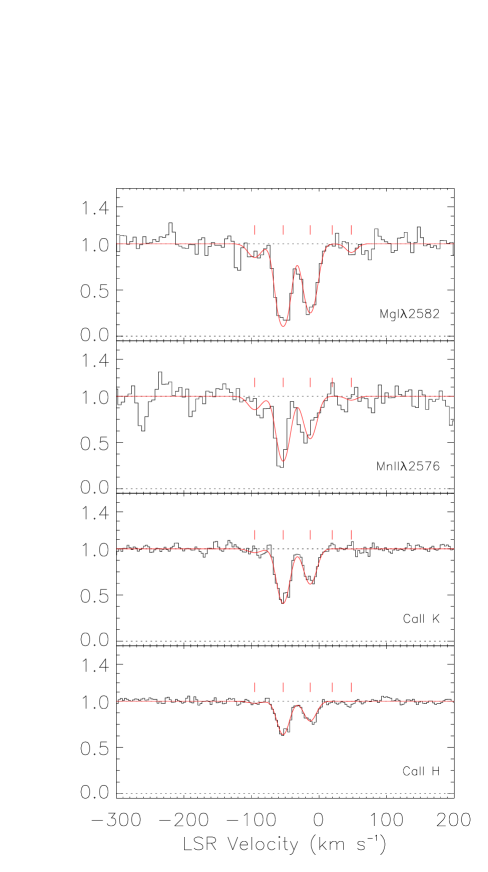
In our STIS spectra, we detect Fe II , Mg I , and, probably, Mn II absorption lines at km s-1 (Figure 2). This velocity agrees well with the 21 cm emission from Complex M, which we reproduce at the bottom of Figure 2a. This is the first detection of manganese in an HVC (Wakker & van Woerden (1997)). The Fe II line from the Milky Way is also covered by our STIS spectra, but the HVC absorption is blended with redshifted Fe II from NGC 3877 and is disregarded in our analysis. Similarly, Mn II and Mn II absorption which might arise from the HVC are blended with other redshifted Fe II lines. Figure 2b shows that in the optical, weak Ca II K is also detected (at a statistically more significant level that the Mg I, since the signal-to-noise of the optical data is so much higher than the STIS data), but the Ca II H line is absent. Galactic Na I D1,D2 is badly contaminated by He I absorption and emission at the redshift of NGC 3877 (see §2.3), making it impossible to derive reliable measurements of absorption from the HVC. Equivalent widths, , and errors, (), to the HVC lines are given in Table 2, derived from standard methods (e.g. Bowen et al. 1995 and refs. therein) — the Mn II is detected at exactly the 3 level. The Fe II lines from the HVC are heavily blended with lower velocity absorption, so their measured equivalent widths are given as lower limits in Table 2.
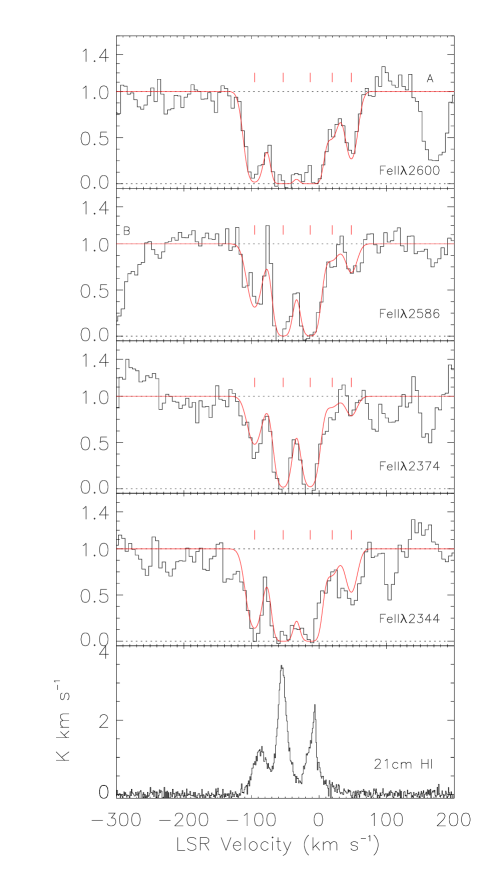
As can be seen in Figure 2, we also detect Fe II and possibly Mg I at km s-1. These lines are highly unusual given that there is no 21 cm emission seen at this velocity. The absorption must arise either in gas with unusual ionization conditions or else must represent dense gas whose size is very much smaller than the width of the 21 cm beam, and whose contribution to the emission is therefore too weak to be detected.
To estimate column densities of these clouds, we used our absorption line fitting routine MADRIGAL (Bowen et al. (1995)) to best fit theoretical Voigt profiles to Fe II , Mn II , Mg I , and Ca II H, K lines simultaneously. We used the sum of the April-4 and April-11 STIS data to improve the signal-to-noise of the UV lines, and adopted a Gaussian Line Spread Function (LSF) with a Doppler width of km s-1 for the E230M echelle, as described in the STIS Instrument Handbook. We assumed that all ions would have a single value of and Doppler width ; the values of for individual ions would be different if the widths of the lines are dominated by kinetic temperatures rather than bulk turbulent motions (since , where is the atomic mass of the species, the kinetic temperature of the gas, and represents the turbulence in the gas). However, the lines are clearly resolved in our data, show no obvious substructure, and have values which would not be expected for the low-ionization lines seen if representative of kinetic temperatures. It therefore seems likely that the width of the lines are dominated by turbulent motions, and we adopted a single value for all species.
The data are of insufficient quality to properly derive column densities for the absorption from the Milky Way near zero velocity; nevertheless, since absorption at these velocities contributes to the higher velocity lines, we need to include lower velocity components, even though the fits will not be precise. The results are given in Table 2, and fits to the Fe II, Mg I and Ca II lines are shown in Figure 2. The values of are indicated by tick marks. We find a velocity of km s-1 for the HVC, and derive km s-1, which agrees well with a simple Gaussian fit to the 21 cm emission feature shown in Figure 2a, km s-1. For the cloud at positive velocities we measure km s-1, km s-1. We have derived errors in the column densities by re-fitting 500 synthetic lines generated from the initial fit to the data, each spectrum given the same signal-to-noise as the original data (see Bowen et al. 1995). The errors quoted in Table 2 refer to the value of derived from a Gaussian fit to the distribution of and measured from the synthetic data, and hence refer only to errors associated with the noise in the spectra. Errors in both and arising from these Poisson statistics are small, km s-1. In reality, the error in will be dominated by the wavelength calibration of the STIS spectrum, while the value of will be affected by uncertainties in the STIS LSF. In the first case, the error in the dispersion solution and zero-point for the MAMAs is no more that pixel, or km s-1, while for the optical data, the residuals of the fits to the echelle arc lines suggests an error of only km s-1. In the second case, the accuracies of the STIS LSFs still remain largely unexplored.
| Table 2. Column densities towards Galactic Clouds | ||||||||||
| Complex M | ||||||||||
| km s-1, km s-1 | km s-1, km s-1 | |||||||||
| a | () | a | () | |||||||
| Ion | (mÅ) | (mÅ) | () | (mÅ) | (mÅ) | () | ||||
| Mn II | 13 | 0.11 | … | |||||||
| Fe II | 300 | 15 | 13.85 | 0.01 | 110 | 6 | 13.27 | 0.05 | ||
| Fe II | 138 | 8 | 60 | 9 | ||||||
| Fe II | 140 | 25 | 97 | 15 | ||||||
| Fe II | 204 | 10 | 159 | 12 | ||||||
| Mg I | 29 | 8 | 11.45 | 0.09 | 6 | … | ||||
| Ca II K | 13 | 3 | 11.15 | 0.12 | … | … | ||||
| Ca II H | … | |||||||||
| aMeasured values are lower limits since the lines are blended with components nearer zero km s-1. | ||||||||||
| Limits are 3() | ||||||||||
With no detection of H I towards the cloud at km s-1, we can derive little about the physical conditions of the absorbing gas. However, for the absorption by the HVC in Complex M, we can make crude estimates of the metallicity of the HVC. The H I column density estimated from the Leiden/Dwingeloo 21 cm Survey is cm-2. Adopting the cosmic meteoritic abundance ratios and (Anders & Grevesse (1989)), we derive gas-phase depletion values of Fe and Mn and respectively.222 In the Galactic interstellar medium both Mn and Fe are heavily depleted onto dust grains, and in fact, the values of [Fe/H] and [Mn/H] are remarkably similar to those seen in the local ‘warm disk’ clouds discussed by Savage & Sembach (1996). However, dust depletion is not the only explanation for sub-solar gas-phase depletions — a combination of low metallicity and less dust depletion within the HVC cloud could give similar values. Stellar abundance measurements toward moderately metal-poor (FeH) halo stars find Mn underabundant with respect to Fe with an average MnFe (Ryan, Norris, & Beers 1996). High redshift measurements in damped Ly QSO absorption systems find values consistently below zero, which has been interpreted as resulting from a combination of a warm Galactic disk-like dust depletion pattern superposed on a slightly sub-solar MnFe abundance ratio (Vladilo (1998)). We present the ISM, stellar, damped Ly QSO measurements, and our new HVC value, in Figure 3. The derived [Fe/H] and [Mn/H] ratios give a gas-phase depletion value of for the HVC, quite different from the values in metal-poor stars or extragalactic DLy systems.
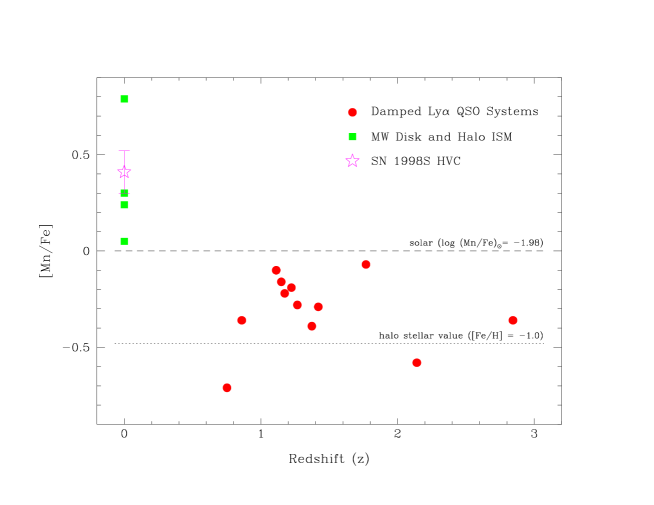
Although not conclusive, (since the point may only be an upper limit if the detection of Mn II is erroneous) our data are consistent with the HVC material at km s-1 having a solar MnFe abundance ratio and a dust depletion pattern similar to that observed in warm disk clouds in the Galactic ISM. This interpretation argues against the HVC material having an extragalactic origin as has been proposed for some HVCs (e.g. Blitz et al. (1999)).
2.2 Cold interstellar gas in NGC3877
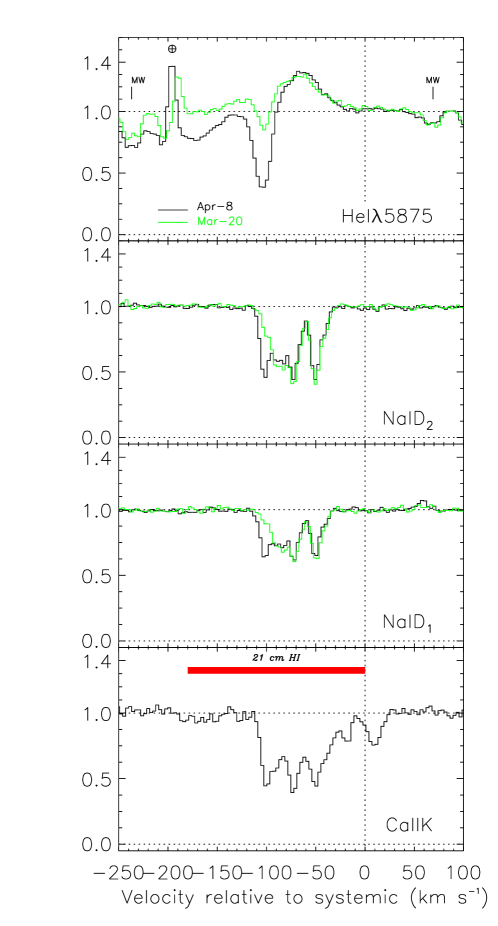
The optical, and UV data in particular, show a wealth of absorption lines arising from NGC 3877, and in this section we focus on the low-ionization species detected. Figure 4a shows the optical Na I and Ca II K lines, with the abscissa showing the velocity of the components relative to the systemic velocity of the galaxy (taken to be 910 km s-1). Ca II H is clearly detected at the velocity of NGC 3877, but is contaminated by H emission & absorption (see §2.3). The absorption spans a range of velocities covering a total spread of km s-1 for Na I and km s-1 for Ca II, each complex clearly made up of a number of components. The range of absorption is consistent with the observed H I emission along the sightline, as deduced from the 21 cm emission maps of Broeils & van Woerden (1994), and marked by a bar in the bottom panel. We have plotted data taken at the two different epochs (Ca II was only observed April-8); the most striking thing about the difference between the two profiles is the increase in the most negative component of the Na I absorption over an interval of 19 days. This increase in absorption corresponds to an increase in a narrow absorption line at the bottom of the absorption trough of the He I P-Cygni profile. Although these profiles are discussed in more detail in §2.3, we introduce this feature, shown in the top panel of Figure 4a, to highlight the unusual nature of the variable Na I component.

In Figure 4b we show absorption line profiles of Mg I and the Mn II triplet centered on Mn II . We show only April-4’s data for the sake of clarity, but there is evidence that the strength of the blue wing of the Mg I absorption has increased, which would correspond to the same increase seen in the Na I component. The same may true for the Mn II lines, but the increase in each of the multiplet lines is small, and within the variations from the low signal-to-noise of the data. We note too that Fe II and Fe II are also detected at the velocity of NGC 3877 in the STIS data. However, the lines are heavily blended with either zero-redshift Milky Way absorption from various species, or metastable Fe II absorption from the host galaxy. For these reasons we choose not to include the lines in our analysis.
2.2.1 Derivation of column densities and Doppler parameters
To derive column densities, , and Doppler parameters, , of the low-ionization gas, we applied MADRIGAL to the Na I D2,D1 and Ca II K lines taken 8-Apr-1998. A minimum of nine components were required. We initially attempted to fit both optical and UV absorption lines simultaneously. However, it was clear that the lower resolution and lower signal-to-noise of the STIS data meant that the spectra offered few data points with which to constrain the fits. Most of the information on the velocity structure in the extragalactic absorption is only evident in the optical data. We therefore first used a simultaneous fit to the Ca II and Na I complexes to derive velocities for individual components. Since the atomic masses of both calcium and sodium are different, in principle, the values of derived from a fit need not be the same for each ion if the line widths are dominated by the kinetic temperature of the gas. Hence with constrained, we refit both the Ca II and Na I allowing & to vary for most of the components. (Obviously, we assume that is the same for each ion, although this assumption depends on the geometry and physical conditions in the cloud.) In fact, the Ca II components are poorly determined without the availability of the Ca II H line; a fit to both Ca II and Na I simultaneously, with set to be the same for both species (but varying during the fit), merely results in nearly the same values derived for Na I, along with adjusted column densities for Ca II. We thus re-considered the values of (Ca II) derived by using only the values from Na I, but found little change in the resulting Ca II column densities.
With plausible values of and established for Na I and Ca II, we then fit the Mg I and Mn II lines taken with STIS on Apr-11. Magnesium has an atomic mass next to sodium, so we kept and fixed to the values derived from the Na I fits — again, only the depth of the Mg I line is constrained in the line profile, and fixed values are necessary to produce a meaningful fit. Manganese has an atomic mass closer to calcium, so we fit the Mn II line using the values derived for the Ca II lines. The fits to the manganese lines have the advantage that we used two lines of the multiplet, which help constrain and , but the low resolution and poor signal-to-noise still make the fits uncertain. The fits are shown in Figure 5a.
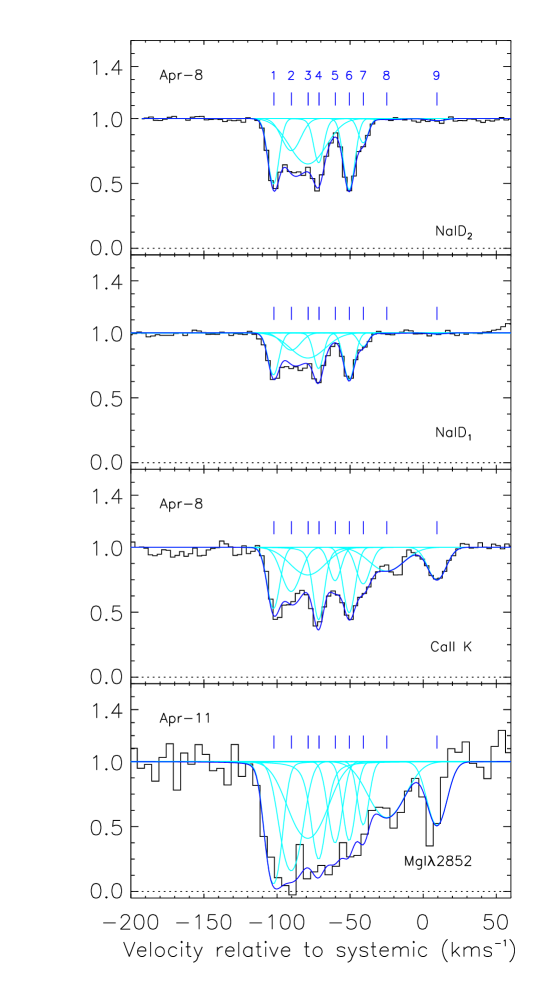
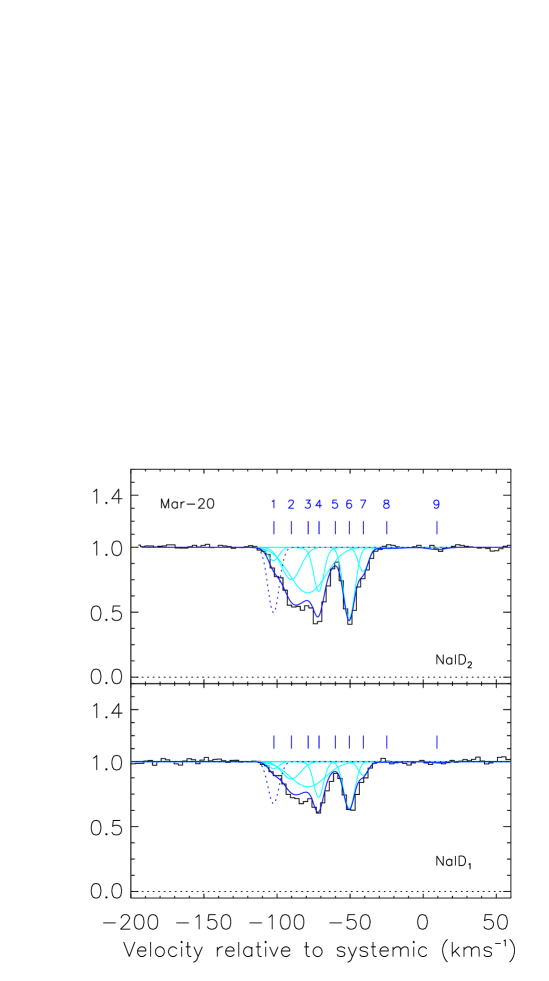
and were then derived for Na I D2,D1 data taken March-20. We found that we were able to well fit the data using exactly the same values of , , and (Na I) derived from April’s data, except for component 1, where (Na I) appears to have varied by nearly 1 dex in the space of 19 days. The profiles are shown in Figure 5b. Finally, we refit 4-April’s Mg I again using the values derived from April’s data but allowing (Mg I) to vary for component 1. Formally, our fits suggest that (Mg I) has increased by a factor of . In these data, however, the component is close to being saturated, and with the low signal-to-noise of the data, large increases in can occur with very small variations in the noise of the line. Nevertheless, some constraint on the fit comes from the fact that the line has widened slightly as well as increased in depth. Hence although (Mg I) may be over-estimated, an increase over dex still seems probable. All the derived physical parameters are given in Table 3.
![[Uncaptioned image]](/html/astro-ph/9910356/assets/x9.png)
Ignoring the variable component (which contributes Å), the equivalent widths of the optical lines seen in NGC 3877 are (Ca II), (Na I), and (Na I) (Ca II H is blended with H from the host galaxy). The Na I equivalent widths are entirely consistent with the distribution measured along sightlines to O- and B-type stars in the Galaxy (Sembach et al. (1993)) while the Ca II equivalent widths are slightly higher than the median of the equivalent width distribution seen along extragalactic sightlines through the Milky Way [0.10.2 Å for Ca II (Bowen (1991))]. Similarly, the total column densities measured in NGC 3877 [(Na I), (Ca II)], again excluding the variable component, are close to those measured through the entire length of the Galactic plane (Sembach & Danks (1994)). In this sense, the optical lines suggest that the ISM of NGC 3877 along the line of sight is similar to our own.
In Figure 6 we show the (Mg I)/(Na I), (Ca II)/(Na I), and (Ca II)/(Mg I) ratios from the fits in Table 3. The use of the first of these, (Mg I)/(Na I), as a diagnostic of gas temperature has been discussed by Pettini et al. (1977), who showed that low ratios in the Galactic disk could be explained if absorption occurred only in cool ( K) H I clouds. The ratios found towards SN 1998S show a mixture of values, suggesting both cool quiescent clouds and warmer halo structures. Similarly, the (Ca II)/(Na I) ratio, usually interpreted as an indicator of the calcium gas-phase abundance, also shows a wide range; both, however, suggest a difference in physical conditions above and below km s-1. We consider these ratios more fully below.

2.2.2 Interpretation
At the position of the SN sightline, the observed H I from 21 cm emission in NGC 3877 is measured from km s-1 (Broeils & van Woerden (1994)), or of to 0 km s-1. The galaxy is highly inclined, , yet the distance of the SN from the major axis is still non-negligible, which suggests that the true radial distance, , of the object from the center of the galaxy is large, as much as 10.3 kpc, assuming it lies in the galactic plane. If so, the SN is near the edge of the H I radius of the galaxy, measured to be kpc (Sanders & Verheijen (1998)). The question remains, however, whether the SN sits at the front or back of the disk, and whether the low-ionization absorption can be understood in terms of disk-gas along the line of sight. If the true distance of the SN in the disk is 10 kpc, then the de-projected angle between it and the major axis of the galaxy is . The true radial velocity, , of gas in the disk of NGC 3877 at 10 kpc is 175 km s-1, as measured from the rotation curve (Sanders & Verheijen (1998)). Hence the projected velocity, , along the line of sight of gas close to the supernova’s environment would be km s-1, where is the angle between a point in the disk along the sightline and the center of the disk. This is true whether the SN is in the edge of the disk closest or furthest from us, and the velocity lines up well with the red edge of the Na I complex in Figure 4. Perhaps the simplest argument to suggest that the SN must lie on the trailing side of the galaxy is to point out that at 10 kpc, the rotation curve is flat, and were the SN to lie on the leading edge, all the disk gas which lies between the probe and us would essentially be at the same velocity, km s-1. From Figure 4, this does not appear to be the case. If the galaxy were exactly edge-on to us, and the SN occurred at the back of the disk, we might expect to see absorption from gas through the entire disk. The most negative velocity gas would occur where the sightline passes closest to the center of the galaxy (i.e. ). This value (essentially the projected distance of the SN from galaxy center) is kpc , and is still km s-1. The projected velocity of the gas would then be km s-1 from systemic, and we do not see any absorption at these velocities. In fact, given that the galaxy is not edge-on, and assuming that the H I disk has a height similar to that in our own Galaxy, kpc, the sightline never intercepts gas near the center of the galaxy — it probes the ISM over perhaps only half a disk radius, depending on where exactly the supernova sits at the back of the disk. Then for kpc, and km s-1, km s-1, which is, remarkably, the same as the most blueward non-variable component we see.
If this simple model of absorption by the back quarter or so of the galactic disk is correct, then it also explains to a large degree the distribution of column density ratios vs. velocity as plotted in Figure 6. The components between and km s-1 (i.e. numbers and ) all lie in the disk of the galaxy and have (Ca II)/(Na I) and (Mg I)/(Na I) ratios similar to those seen in the disk of the Milky Way. Two other components, numbers 8 and 9, have velocities which do not fit in with the rotation of the galaxy — these components have high peculiar velocities, relative to the gas in the disk, similar to those seen in our own galaxy, and have correspondingly high (Ca II)/(Na I) and (Mg I)/(Na I) values. Component 5 would then be interpreted perhaps as arising from a warmer intercloud medium. This just leaves us to explain the origin of the variable component 1, which has no apparent relation to the co-rotating ISM gas in NGC 3877. This component corresponds to many other unusual features, however, which we now discuss.
2.3 Circumstellar absorption and emission from SN 1998S
Although the initial aim of our observations was to examine the UV absorption from the interstellar medium of NGC 3877, our data have revealed unusual absorption line profiles which have more to do with the environment of the supernova itself. In Figure 7 we show the Mg II absorption both from our own Galaxy and from NGC 3877. The system is complicated by Mg II at the velocity of NGC 3877 being contaminated with Mg II from our Galaxy at rest. To highlight the possible degree of contamination, we have shifted and overplotted the Galactic Mg II profile at the position expected for Galactic Mg II , as shown by the hatched region in the top panel. Hence the absorption seen in this region is a superposition of saturated lines from both Mg II absorption in NGC 3877 and Mg II from the Milky Way. This same blend of absorption is also seen in the middle panel, with Mg II from the Galaxy now at rest, but contaminated with Mg II from NGC 3877.
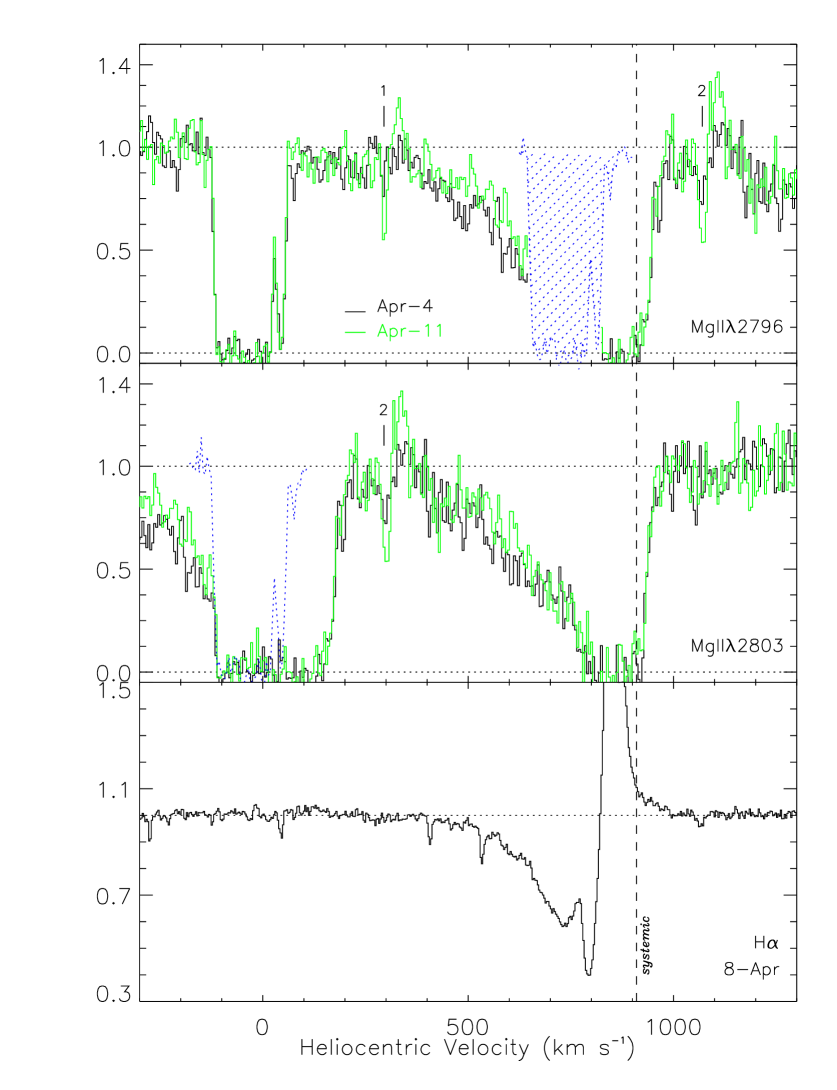
Despite this confusion, it is clear that there exists a ‘shelf’ of absorption spanning km s-1 in addition to the saturated components expected from the ISM of NGC 3877 itself at km s-1. We see a smooth decline in the strength of the absorption as the velocity from systemic increases. There is also some evidence that the strength of the absorption in this region has declined between April-4 and April-11, although we note that defining the continuum in regions of wide absorption is difficult.
Features in the optical data also show unusual conditions. At the bottom of Figure 7 we overplot the H profile taken April-8th. The ‘shelf’ seen in Mg II can also be seen in H absorption, but now part of a classic P-Cygni profile defined by H emission to the blue. This absorption can be seen in other Balmer lines too, in H, H, H and H. The absorption lines do not result from incorrect background subtraction of emission from other parts of the galaxy filling the slit—extraction of the supernova signal without background subtraction also shows the P-Cygni profiles. We show these profiles in Figure 8, with the data from the two different epochs plotted over each other. (H is also present, but blended with Ca II H from the ISM of NGC 3877, so is not shown in Figure 8.) There is no doubt that the absorption complex has strengthened significantly between March-20 and April-8, in contrast to the Mg II which has declined. This suggests that the gas forming the Mg II has increased in ionization, with more of the magnesium forming Mg III.
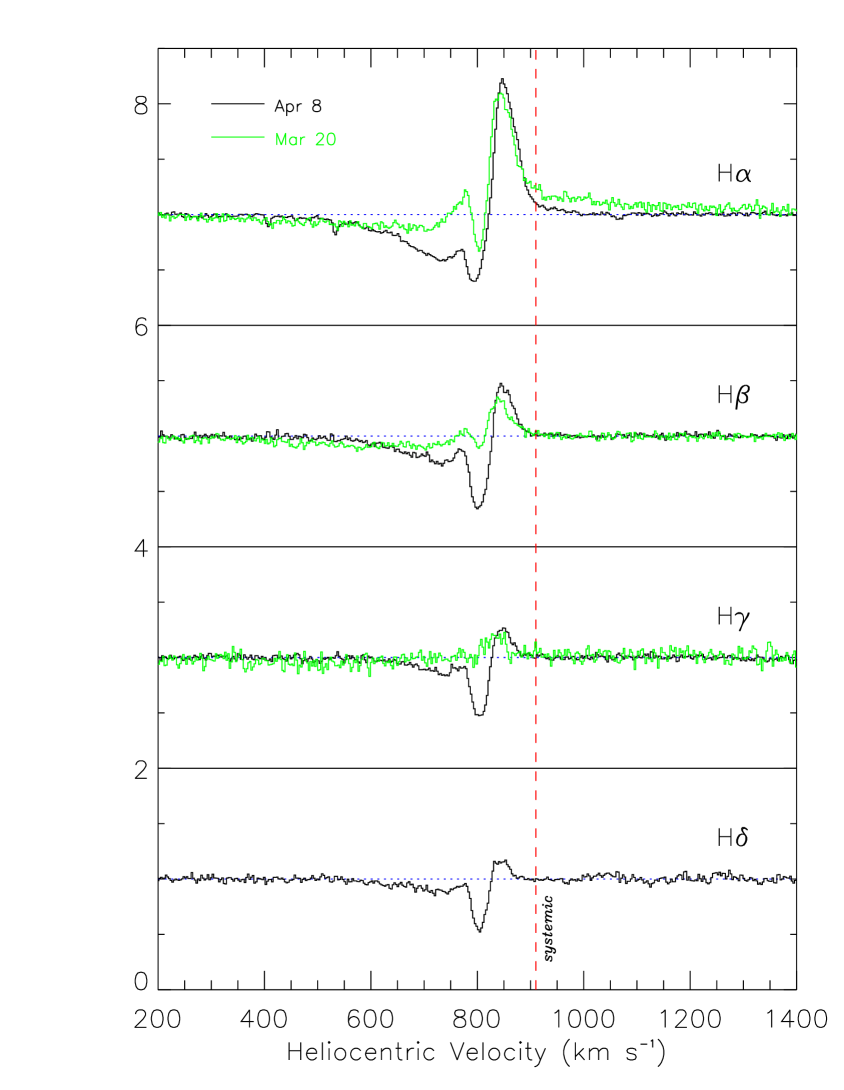
The exact level of H taken March-20 is uncertain, because no flux calibrators are available, and there is difficulty in defining where best to fit the continuum. There is, however, a possibility that the H shows weak excess emission as a wide red wing covering km s-1 on March-20, emission which has disappeared by April-8. These P-Cygni profiles, so well displayed in Balmer lines, can also be seen in many He I lines (e.g. He I in Figure 4); we list all the identified emission lines in April-8’s data in Table 4, and note whether the lines show the P-Cygni profile. Some do not, and these emission lines are likely to be due to either the H II region in which the supernova exploded (see below), or from other emission line regions along the line of sight not directly connected with the supernova’s environment.
| Table 4. Emission lines identified | |
|---|---|
| in 8-Apr-1998 optical data | |
| Line | P-Cygni |
| [Ne III] | n |
| He I | n |
| He I + H 8 | y |
| He I | y |
| H | y |
| He I | y |
| H, H | y |
| [O III] | n |
| He I | y |
| He I | y |
| He I | ? |
| [Fe III] | n |
| H | y |
| [O III] | n |
| [O III] | n |
| He I | y |
| [Fe III] | n |
| [N II] | n |
| He I | y |
| H | y |
| [N II] : | n |
| O I | n |
What is also clear from these P-Cygni profiles is that there exists strong, narrow absorption in addition to the weaker, wider shelf already described, located at the bottom of the P-Cygni trough. Although the exact center of this absorption is hard to measure, because it is superimposed on the emission line, it seems clear that it lies at the same velocity as the variable Na I component at km s-1 discussed in §2.2. This can best be seen in Figure 4 where the sharp absorption in He I is coincident with the varying Na I component. Further, there are other absorption lines in our HST spectra which coincide with this varying component. For example, there are the rarely seen Mg II and Mg II lines (labelled ‘1’ and ‘2’ in Figure 7) which arise at this same velocity.
Even more unusual are the many uv1, uv2, uv62, uv63, uv158 and uv159 multiplet Fe II lines seen in the STIS spectra, also with P-Cygni profiles. All the transitions we detect arise from the , , and states. Examples of these lines are shown in Figure 9, where we have plotted all the lines of a given multiplet shifted from rest to a velocity of 850 km s-1. Both the broad shelf and the narrow absorption is seen in these profiles, as detected in the other species. There is no clear difference between the profiles between April-4 and April-11. Although the data are of too low a signal-to-noise, and the continuum of the P-Cygni profiles too ill-defined, to measure physical parameters accurately, the narrow component is clearly resolved in the data. Crudely, the lines appear to be a factor of 2 wider than the instrumental resolution, which gives a lower limit of km s-1, assuming that the spectra have a resolution of 1.7 pixels FWHM, as given by the STIS Instrument Handbook. This is much wider than that deduced from the Na I component alone, ( km s-1, Table 3) which suggests a much more complicated structure to the narrow component than a single absorbing cloud.


It seems clear that all these features — the emission lines and the narrow, variable absorption component superimposed on a broader shelf of absorption — are unlikely to have anything to do with the supernova ejecta itself. Typically, ejecta material is moving at km s-1 at the epochs at which we observed SN 1998S, hence the P-Cygni profiles would be considerably wider than the km s-1 FWHM observed here. Indeed, the far-UV G140L spectra show the expected broad P-Cygni profiles from the expanding photosphere of the supernova in a variety of ions.
Instead, it seems likely that the P-Cygni profiles arise from circumstellar material, blown off from the progenitor star. Such an interpretation is not unprecedented. Narrow Balmer lines and He I have been seen before in a supernova spectrum, towards SN 1984E in NGC 3169 (Dopita et al. (1984)). Their detection was cited as evidence of a superwind flowing out from the precursor star. In this case, the wind had a velocity of some 3000 km s-1, much greater than we observe towards SN 1998S. UV emission lines towards SN 1979C in M 100 were also interpreted as being due to a UV-emitting shell of compressed gas from pre-existing circumstellar material (Panagia et al. (1980)), and indeed, a narrow H P-Cygni profile may also have been seen (Branch et al. (1981)). Again, however, the width of these UV emission lines ranged from being unresolved at a limit of 1000 km s-1 to a maximum of 4000 km s-1, larger than we see towards SN 1998S.
The circumstellar absorption detected towards SN 1998S is obviously far more quiescent than these superwinds. Stellar winds from, e.g., O- & B-type stars, or Population I Wolf-Rayet stars, are known to have high mass-loss rates and strong outflows, giving rise to the classic P-Cygni profiles. However, these outflows move with a speed of a few km s-1 (see, e.g. Lozinskaya (1992)), again, much higher than we observe towards SN 1998S. Perhaps the most interesting comparison is the detection of the same Fe II UV multiplets seen in the winds of A-type supergiants (Talavera & Gómez de Castro (1987); Verdugo et al. (1999)). Although not all A-type stars show these absorption lines, those that do are characterized by outflows moving at only a few hundred km s-1, along with variability in the absorption. It seems likely that this type of outflow is responsible for the complicated emission and absorption seen in NGC 3877.
Another possibility is that at least some component of the absorption arises from a proto-planetary disk surrounding the progenitor. Observations towards -Pictoris and other A-type and late O-type stars show the same Fe II metastable lines as we find towards SN 1998S, as well as variable absorption (e.g. Lagrange et al. (1996), Kondo & Bruhweiler (1985), Cheng et al. (1997)). If so, the absorption we see might well mark the presence of an early solar system shortly before its destruction by the supernova. The most obvious argument against this interpretation is simply that the absorbing shell or wind is probably much further away from the progenitor than would be expected from a proto-planetary disk. The existence of the Fe II lines in our last STIS spectra taken April-11 means that the ejecta from the supernova had not yet reached the absorbing material, some 39 days after the supernova was detected. Assuming simply that the ejecta moved with a constant velocity after outbreak, at, e.g., 5,000 km s-1, then for the absorbing material to remain undisturbed (i.e, assuming that the ejecta would have catastrophic effects on the absorbing material), the distance of the material from the progenitor would be AU. This is much larger than the few AU postulated for the -Pictoris disk.
We also note that the shell has a velocity relative to the progenitor in our simple model of where the supernova sits in the galaxy, discussed in §2.2.2. We associated the progenitor to be at a radius in the galaxy where the ISM gas has a projected velocity along the line of sight to be km s-1; if this gas forms a reference frame for the progenitor, then the variable absorption occurring at km s-1 is km s-1 different, a value which could therefore be taken to be the shell’s speed. This, combined with the broader absorption shelf, would suggest a dense shell with a speed of about 50 km s-1 and a more highly ionized shell moving at km s-1.
There are obvious complications in trying to interpret the observed data with stellar outflows. First, the material does not necessarily form a single bubble of gas; towards SN 1987A, for example, it is believed that the slowly expanding wind from the red supergiant phase of the progenitor is being caught by a faster wind from its blue supergiant phase, producing two shock fronts. There is also the obvious fact that the wind must hit the ambient ISM surrounding the progenitor, producing another type of shock front. These process are not well understood in our own Galaxy, and applying them to the features observed towards SN 1998S is clearly not easy. Second, towards a supernova, the ionization structure of the gas is complicated by the addition of the UV flash occurring at the initial explosion of the supernova. The effects of this ionizing source are superimposed on the ionization of the winds and shells caused by the progenitor and the earlier mechanical interactions. Third, in attempting to link the variability of the narrow absorption with the types of variations seen in the outflows of type-A supergiants, there is the added complication that the UV source against which the absorption is seen is expanding. This could in principle produce—apparently—variable absorption features, depending on the density structure within the outflow (whether clumps exist in the outflow) and the covering factors of the clumps. Finally, although the Fe II lines can be found in the spectra of A-type stars and their circumstellar material, they rarely show the well defined P-Cygni profiles we see towards SN 1998S.
Hence, although we believe that we are seeing unique signatures of the outflows from the supergiant progenitor of SN 1998S, the exact details of the structure of the circumstellar material are beyond the scope of this paper.
3 Summary
We have observed SN 1998S which exploded in NGC 3877 with the UES (67 km s-1 FWHM) at the WHT and with the E230M echelle of the STIS (8 km s-1 FWHM) aboard HST. Both data sets were obtained at two epochs, separated by 19 (optical) and seven days (HST data) (see Table 1). We summarize our results as follows. From our own Galaxy we detect:
-
•
interstellar Ca II K, Fe II , Mg I , and probably Mn II , absorption lines at km s-1 arising from the outer edge of the High Velocity Cloud Complex M. We derive gas-phase abundances of [Fe/H] and [Mn/H], values which are very similar to warm disk clouds found in the local ISM.
This is the first detection of manganese from a Galactic HVC, and we believe that the values of the iron and manganese gas-phase abundances argue against the HVC material having an extragalactic origin.
At the velocity of NGC 3877 we detect:
-
•
interstellar Mg I , Mn II , Ca II K and Na I D2,D1 absorption lines, spanning a velocity range of to km s-1 from the systemic velocity of the galaxy (910 km s-1). In particular, the component at km s-1 is seen to increase by a factor of dex in (Na I) between March-20 and April-8, and in (Mg I) between April-4 and April-11;
-
•
Balmer and He I P-Cygni profiles in the optical, with a narrower absorption component superimposed at the bottom of the absorption trough of the profile. Both the broad and narrow components are seen to vary substantially in their absorption strength between March-20 and April-8;
-
•
a broad shelf of Mg II absorption spanning a velocity range of km s-1, with an apparent optical depth gently declining towards more negative velocities. This shelf covers the same velocity extent as the Balmer and He I lines in the optical (which form the blue side of a P-Cygni profiles) but there is no evidence of any narrow emission forming a Mg II P-Cygni profile. There is some suggestion that this shelf has decreased in strength over seven days between April-4 and April-11;
-
•
metastable Fe II absorption lines from the UV multiplets uv1, uv2, uv62, uv63, uv158 and uv159. These too show the same P-Cygni profiles seen in the optical, and are again superimposed with the narrow component at the trough of the broad absorption part of the profile. These lines do not obviously vary over the seven days between the two STIS observations;
-
•
rarely seen Mg II and Mg II lines. These show P-Cygni profiles on April-11 which do not exist on April-4.
Most of the low-ionization absorption (the Ca II, Na I, Mg I, Mn II lines) can be understood in terms of gas co-rotating with the disk of NGC 3877, providing the supernova is at the back of the disk as we observe it, and the H I disk is a few kpc thick. However, the variable component seen in all the other lines, and the accompanying emission which goes to form the classic P-Cygni profiles, most likely arises in slow moving circumstellar outflows originating from the red supergiant progenitor of SN 1998S.
References
- Anders & Grevesse (1989) Anders, E., & Grevesse, N. 1989, Geochim. Cosmochim. Acta, 53, 197
- Blades et al. (1988) Blades, J. C., Wheatley, J. M., Panagia, N., Grewing, M., Pettini, M. & Wamsteker, W. 1988, ApJ, 334, 308
- Bowen (1991) Bowen, D. V. 1991, MNRAS, 251, 649
- Bowen et al. (1994) Bowen, D. V., Roth, K. C., Blades, J. C. & Meyer, D. M. 1994, ApJ, 420, L71
- Bowen et al. (1995) Bowen, D. V., Blades, J. C., & Pettini, M. 1985, ApJ, 448, 634
- Blitz et al. (1999) Blitz, L., Spergel, D. N., Teuben, P. J., Hartmann, D., & Burton, W. B. 1999, ApJ, 514, 818
- Branch et al. (1981) Branch, D., Falk, S. W., Uomoto, A. K., Wills, B. J., McCall, M. L. & Rybski, P. 1981, ApJ, 244, 780
- Broeils & van Woerden (1994) Broeils, A. H. Van Woerden, H. 1994 A&AS, 107, 129
- Cheng et al. (1997) Cheng, K.-P., Bruhweiler, F. C., & Neff, J. E. 1998, ApJ, 481, 866
- Danly et al. (1993) Danly, L., Albert, C. E., & Kuntz, K. D. 1993, ApJ, 416, L29
- D’Odorico et al. (1985) D’Odorico, S., Pettini, M. & Ponz, D. 1985, ApJ, 299, 852
- Dopita et al. (1984) Dopita. M. A., Evans, R., Cohen, M., & Schwartz, R. D. 1984, ApJ, 287, L69
- Hartmann & Burton (1997) Hartmann, D. & Burton, W. B. 1997, Atlas of galactic neutral hydrogen, Cambridge University Press.
- Jenkins et al. (1984) Jenkins, E. B., Rodgers, A. W., Harding, P., Morton, D. C. & York, D. G. 1984, ApJ, 281, 585
- Keenan et al. (1995) Keenan, F. P., Shaw, C. R., Bates, M., Dufton, P. L., & Kemp, S. N. 1995, MNRAS, 272, 599
- Lagrange et al. (1996) Lagrange et al. 1996, å, 310, 547
- Lozinskaya (1992) Lozinskaya, T. A. 1992, in Supernovae and Stellar Wind in the Interstellar Medium, (American Institute of Physics), p 279.
- Lu, Sargent, & Barlow (1996) Lu, L., Sargent, W. L. W., & Barlow, T. A. 1996, ApJS, 107, 475
- Lu et al. (1995) Lu, L., Savage, B. D., Tripp, T. M., & Meyer, D. M. 1995, ApJ, 447, 597
- Meyer et al. (1995) Meyer, D.M., Lanzetta, K.M., & Wolfe, A.M. 1995, ApJ, 451, L13
- Meyer & Roth (1991) Meyer, D.M., & Roth, K. C. 1991, ApJ, 383, L41
- Panagia et al. (1980) Panagia, N. et al. 1980, MNRAS, 192, 861
- Pettini et al. (1977) Pettini, M., Boksenberg, A., Bates, B., McCaughan, R. F. & McKeith, C. D. 1977, A&A, 61, 839
- Pettini et al. (1982) Pettini, M., et al. 1982, MNRAS, 199, 409
- Pettini et al. (1999) Pettini, M., Ellison, S. L., Steidel, C. C., & Bowen, D. V. 1999, ApJ, 510, 576
- Roth & Songaila (1999) Roth, K. C. & Songaila, A. 1999, in preparation
- Ryans et al. (1997) Ryans, R. S. I., Keenan, F. P., Sembach, K. R., & Davies, R. D. 1997, MNRAS, 289, 83
- Ryan, Norris, & Beers (1996) Ryan, S. G., Norris, J. E., & Beers, T. C. 1996, ApJ, 471, 254
- Savage & Sembach (1996) Savage. B. D. & Sembach, K. M. 1996, ARA&A, 34, 279
- Sanders & Verheijen (1998) Sanders, R. H. & Verheijen M. A. W. 1998, ApJ, 503, 97
- Sembach et al. (1993) Sembach, K. R., Danks, A. C., & Savage, B. D. 1993, A&AS, 100, 107
- Sembach & Danks (1994) Sembach, K. R. & Danks, A. C. 1994, A&A, 289, 539
- Steidel et al. (1990) Steidel, C. C., Rich, R. M. & McCarthy, J. K. 1990, AJ, 99, 1476
- Steidel et al. (1995) Steidel, C. C., Bowen, D. V., Blades, J. C., & Dickinson, M. 1995, ApJ, 440, L45
- Talavera & Gómez de Castro (1987) Talavera, A., & Gómez de Castro, A. I. 1987, å, 181, 300
- Verdugo et al. (1999) Verdugo, E., Talavera, A., & Gómez de Castro, A. I., 1999, A&AS, 137, 351
- Vidal-Madjar et al. (1987) Vidal-Madjar, A., Andreani, P., Cristiani, S., Ferlet, R., Lanz, T. & Vladilo, G. 1987, A&A, 177, L17
- Vladilo (1998) Vladilo, G. 1998, ApJ, 493, 583
- Kondo & Bruhweiler (1985) Kondo, Y., & Bruhweiler, F. C. 1985, ApJ, 291, L1
- Wallerstein et al. (1972) Wallerstein, G., Conti, P. S., Greenstein, J. L. 1972, Astrophysical Letters, 12, 101
- Wakker & van Woerden (1991) Wakker, B. P. & van Woerden, H. 1991, A&A, 250, 509
- Wakker & van Woerden (1997) Wakker, B. P. & van Woerden, H. 1997, ARA&A, 35, 217