Hubble Space Telescope Observations of the Associated Absorption Line Systems in Q0122+033811affiliation: Based on observations with the NASA/ESA Hubble Space Telescope, obtained at the Space Telescope Science Institute, which is operated by the Association of Universities for Research in Astronomy, Inc., under NASA contract No. NAS5-26555.
Abstract
We have studied a spectrum of Q0122+0338 () obtained by the Faint Object Spectrograph (FOS) on board the Hubble Space Telescope (HST). We present the analysis of three associated () absorption systems at , 1.199 and 1.166. The most complex of these at shows strong absorption from the highly ionized transitions of Ly, Ly, N V, O VI, Si III, Si IV, and possibly P V. We derive (minimal) ionic column densities for this system of H I cm-2, N V cm-2, O VI cm-2, Si III cm-2, and Si IV cm-2. By comparing the derived column densities with those predicted from numerical photoionization models, we find that conditions in the absorbing gas are consistent with an absorber with a metallicity and a total absorbing column density of cm-2. The kinematics of the absorption lines in the system suggest that a correlation exists between the relative velocity and the creation ionization potential energy for each transition. This is evidence that a complex, multi-component absorber exists. Althought the location of the absorber is uncertain (intrinsic versus intervening), we consider the origin of this absorption system using the available data and discuss how the high-ionization, and high-metallicity indicate that the absorber may be intrinsic to Q0122+0338.
Subject headings:
quasars: absorption lines — quasars: individual (Q0122+0338)1. Introduction
Absorption lines in QSO spectra offer a direct means of tracing the nature and distribution of gaseous matter in the Universe. The presence of metal lines in these systems ties the absorbing gas to the processes of galaxy formation and evolution. Associated absorption systems — those with the absorption redshift, , close to the QSO emission redshift, — have been classified separately from the general class of () narrow-line absorption systems, and their origin remains uncertain. These systems are characterized by highly ionized absorption lines and are generally defined by the convention that the relative velocity between the emission redshift and the absorption redshift is km s-1 (Weymann et al. (1979); Foltz et al. (1986); Anderson et al. (1987); Foltz et al. (1988)). Identifying the mechanism for associated absorption has potentially important implications for galactic formation and evolution. If the associated systems originate in regions local to the QSO, then they provide a direct probe into the inner regions of active galaxies.
Associated systems may arise in the halos of neighboring galaxies or the host galaxy of the QSO itself with a scale length of tens of kiloparsecs. Foltz et al. (1986) observed a correlation between associated systems and radio-loud QSOs. The fact that the environments surrounding radio-loud QSOs tend to have more nearby galaxies (Smith & Heckman (1990)) may be construed as evidence that systems originate in neighboring galactic structures. However, Anderson et al. (1987) report that although a high incidence of associated systems occur in radio-loud QSOs, there is no statistically significant correlation between the two. Barthel, Tytler, & Thomson (1990) combined a study with previous work (Barthel et al. (1988)) and found systems biased towards neither radio-loud nor radio-quiet QSOs.
Some associated absorption systems show evidence of being intrinsic to the QSO engine. These systems are typically highly ionized given the presence of lithium–like O VI, N V, and C IV which implies the gas is photoionized by the QSO. In several studies with high quality data, the metallicities of these systems have been solar to several times solar (Wampler, Bergeron, & Petitjean (1993); Møller, Jakobsen, & Perryman (1994); Petitjean, Rauch, & Carswell (1994); Hamann (1997); Hamann et al. 1997b ). If these systems originate near the central regions of the QSO host galaxy, then the high metallicities agree with predictions of galactic chemical evolution (Hamann & Ferland (1993); Matteucci & Padovani (1993); Hamann et al. 1997d ; see Hamann & Ferland 1999 for a recent review) and with the metallicities of QSO environments derived from studies of broad absorption line (BAL) systems and QSO emission lines (Hamann & Ferland (1993); Ferland et al. (1996); Turnshek et al. (1996); Hamann (1997)). However, the poorly understood effects of the covering fraction of the source by the absorber, and inherent line saturation effects produce systematic uncertainties in converting the observed column densities to metallicities.
More evidence for a class of intrinsic, narrow-lined absorption systems comes from dynamical observations. Studies of some BAL and associated systems show time variability in their absorption profiles. Assuming the QSO is the ionizing source, time variability in the absorber implies either that a variable QSO flux has changed the ionization state of the cloud, or that the density has changed due to motions not along the line of sight. Either scenario requires small distance scales (Barlow et al. (1992)). Multi-epoch observations of Q0835+5804 and Q1157+0128 by Aldcroft, Bechtold, & Foltz (1997) show line strength variability in intrinsic absorption features on the time scale of a few years. In Q2343+125, Hamann et al. (1997a) observe temporal variations in the absorber between two epochs separated by yr. Furthermore, they derive covering factors less than unity which indicates that the absorber does not completely occult the emission source. Partial coverage of small, dense absorbers produce shallow absorption features with multiplet line equivalent width strength ratios of order unity (Petitjean et al. 1994; Hamann et al. (1995); Barlow & Sargent (1997); Hamann, Barlow, & Junkkarinen 1997c ). Both multi-epoch variations and partial covering factors give strong support to the idea that the absorption originates near the QSO emission source.
Q0122+0338 is a radio-quiet QSO (Véron-Cetty, & Véron (1998)) at , with magnitude, (). Arp & Duhalde (1985) first observed Q0122+0338 as part of a search for quasars in the field of NGC 520 (their object 40), and the QSO was used by Norman et al. (1996) to search for UV absorption lines from the outflow of the galaxy. X-ray surveys by Yuan et al. (1998) show Q0122+0338 to be a typical radio-quiet QSO with a steep-spectrum slope and an X-ray flux, erg cm-2 s-1.
In this paper, we report the detection of three associated systems in Q0122+0338 at , 1.199, and 1.207. The corresponding relative velocities to the emission redshift are , , and km s-1, respectively. The relative velocity is defined as
| (1) |
such that a negative relative velocity indicates motion towards us with respect to the emission redshift.
In §2, we discuss the procedure used to obtain and reduce the HST/FOS data. In §3, we present the analysis of the absorption lines including the line detection procedure and the column density derivations. In §4, we describe the characteristics of each of the three associated absorption systems. Using arguments based on ionization, metallicity, and kinematics, we constrain the origin of each system.
2. Data Acquisition and Reduction

The spectrum of Q0122+0338 was taken by Norman et al. (1996) with the Faint Object Spectrograph (FOS) and pre-COSTAR optics on 9-Sept-1993 and 22-Nov-1993. The observations were obtained using the G270H grating with the Red Digicon detector through the ACCUM mode. The observed wavelength range is Å with a dispersion of 0.51 Å pixel-1 and a corresponding resolution of km s-1. Each diode was sampled by four (NXSTEPS=4) pixels with a total of five (OVERSCAN=5) overscan steps. The total exposure time was 5760 seconds (96 minutes).
The general method used to handle the data reduction is outlined by the QSO Absorption Line Key Project (QALKP; e.g., Bahcall et al. (1993)). Reduction of the data was performed using the IRAF/STSDAS111 The Image Reduction and Analysis Facility (IRAF) software is provided by the National Optical Astronomy Observatories (NOAO), which is operated by the Association of Universities for Research in Astronomy, Inc., under contract to the National Science Foundation. The Space Telescope Science Data Analysis System (STSDAS) is distributed by the Space Telescope Science Institute standard pipeline software and the datasets were coadded using standard IRAF routines. The photon noise errors and data quality were calculated and propagated through the pipeline calibration. We utilize a wavelength scale in which the wavelengths of the absorption due to the Galactic Mg II , 2803 doublet equal the vacuum wavelengths of Verner, Bathel & Tytler (1994). A wavelength shift of Å was implemented to remove the offset between them.
We fit the spectrum continuum (including the broad emission lines) using the STSDAS package FIT1D following methods outlined by the QALKP (Schneider et al. (1993)). The spectrum was fit automatically using a minimization of a series of cubic spline curves with interactive manipulation in spectral regions that are poorly fit. The fit was deemed satisfactory after we ensured that residuals in the normalized spectrum were comparable to the Poisson noise. In Figure 1, we present the flux and errors versus the observed wavelength. Normalized flux and error files were generated by dividing the flux and error files from the pipeline by the fitted continuum.
3. Detection and Analysis of Absorption Lines
3.1. Absorption Line Identification
We employed an automatic, objective search for statistically significant absorption features in the normalized spectrum using the algorithm developed for the QALKP (Schneider et al. (1993)). The line-finding algorithm searches for minimum feature widths based on the FOS line spread function for this grating and aperture ( Å). We restricted our line search to features with statistical significance level [] which corresponds to a detection of weak lines with observed equivalent width Å.
| (Å) | (Å) | (Å) | (Å) | SL | (Å) | (Å) | (km s-1) | ID | ||
|---|---|---|---|---|---|---|---|---|---|---|
| 1 | 2234.94 | 0.17 | 1.40 | 0.14 | 9.7 | O VI 1031.93 | 1.16554 | |||
| 2 | 2246.78 | 0.22 | 1.16 | 0.15 | 7.6 | O VI 1037.62 | 1.16554 | |||
| 3 | 2255.91 | 0.27 | 0.90 | 0.15 | 5.9 | H I 1025.72 | 1.19941 | |||
| 4 | 2264.02 | 0.11 | 2.08 | 0.11 | 18.6 | H I 1025.72 | 1.20725 | |||
| 5 | 2273.67 | 0.49 | 0.46 | 0.15 | 3.1 | |||||
| 6 | 2278.05 | 0.09 | 2.56 | 0.10 | 25.7 | O VI 1031.93 | 1.20755 | |||
| 7 | 2290.59 | 0.10 | 2.07 | 0.10 | 20.5 | O VI 1037.62 | 1.20755 | |||
| 8 | 2315.15 | 0.52 | 0.47 | 0.16 | 2.9 | |||||
| 9 | 2319.22 | 0.32 | 0.66 | 0.14 | 4.7 | |||||
| 10 | 2331.08 | 0.54 | 0.41 | 0.15 | 2.8 | |||||
| 11 | 2344.12 | 0.14 | 1.51 | 0.12 | 13.0 | Fe II 2344.21 | ||||
| 12 | 2377.95 | 0.17 | 1.25 | 0.12 | 10.3 | Fe II 2374.46: | 0.00144 | |||
| 13 | 2381.88 | 0.18 | 1.17 | 0.12 | 9.5 | Fe II 2382.76 | ||||
| 14 | 2389.86 | 0.55 | 0.38 | 0.14 | 2.7 | |||||
| 15 | 2466.86 | 0.53 | 0.36 | 0.13 | 2.8 | P V 1117.98: | 1.20659 | |||
| 16 | 2474.00 | 0.32 | 0.61 | 0.12 | 4.8 | |||||
| 17 | 2488.98 | 0.23 | 0.87 | 0.13 | 6.9 | |||||
| 18 | 2506.65 | 0.57 | 0.33 | 0.13 | 2.6 | |||||
| 19 | 2511.17 | 0.15 | 1.22 | 0.11 | 11.5 | |||||
| 20 | 2530.00 | 0.35 | 0.51 | 0.12 | 4.4 | |||||
| 21 | 2565.28 | 0.48 | 0.35 | 0.11 | 3.1 | |||||
| 22 | 2595.22 | 0.13 | 1.24 | 0.09 | 14.2 | |||||
| 23 | 2600.59 | 0.25 | 0.59 | 0.10 | 6.1 | Fe II 2600.17 | 0.00017 | |||
| 24 | 2613.37 | 0.24 | 0.58 | 0.09 | 6.3 | Si III 1206.50 | 1.16614 | |||
| 25 | 2620.84 | 0.12 | 1.12 | 0.08 | 13.9 | |||||
| 26 | 2633.10 | 0.08 | 1.76 | 0.06 | 27.5 | H I 1215.67 | 1.16599 | |||
| 27 | 2662.38 | 0.13 | 0.80 | 0.06 | 12.5 | Si III 1206.50 | 1.20665 | |||
| 28 | 2667.00 | 0.11 | 0.91 | 0.06 | 15.4 | |||||
| 29 | 2673.39 | 0.07 | 1.39 | 0.05 | 26.6 | H I 1215.67 | 1.19910 | |||
| 30 | 2683.14 | 0.04 | 2.80 | 0.03 | 91.6 | H I 1215.67 | 1.20714 | |||
| 31 | 2693.63 | 0.35 | 0.34 | 0.08 | 4.3 | |||||
| 32 | 2705.67 | 0.51 | 0.23 | 0.08 | 3.0 | |||||
| 33 | 2734.14 | 0.07 | 1.63 | 0.06 | 27.3 | N V 1238.82 | 1.20708 | |||
| 34 | 2743.04 | 0.10 | 1.31 | 0.07 | 19.0 | N V 1242.80 | 1.20708 | |||
| 35 | 2763.37 | 0.44 | 0.32 | 0.10 | 3.3 | |||||
| 36 | 2768.35 | 0.30 | 0.45 | 0.09 | 4.9 | |||||
| 37 | 2796.26 | 0.14 | 1.14 | 0.09 | 13.0 | Mg II 2796.35 | ||||
| 38 | 2803.62 | 0.16 | 0.98 | 0.09 | 10.5 | Mg II 2803.53 | 0.00002 | |||
| 39 | 2819.45 | 0.56 | 0.28 | 0.11 | 2.6 | |||||
| 40 | 2899.70 | 0.41 | 0.41 | 0.11 | 3.7 | |||||
| 41 | 2903.07 | 0.53 | 0.32 | 0.11 | 2.8 | |||||
| 42 | 3018.67 | 0.53 | 0.32 | 0.12 | 2.8 | Si IV 1393.76 | 1.16605 | |||
| 43 | 3075.42 | 0.20 | 0.80 | 0.10 | 7.8 | Si IV 1393.76 | 1.20660 | |||
| 44 | 3094.61 | 0.56 | 0.29 | 0.11 | 2.6 | Si IV 1402.77 | 1.20660 | |||
| 45 | 3120.90 | 0.46 | 0.38 | 0.12 | 3.3 |
All absorption lines detected were fit with the IRAF package SPECFIT (Kriss (1994)). The profiles of the absorption lines are modeled with single component Gaussian profiles which is appropriate for marginally resolved absorption features since the centroid of the FOS line spread function is best fit by a Gaussian (Evans 1993). SPECFIT best fits all the specified features by minimizing with an optimal Marquardt routine. Where applicable, we improved the fit by requiring the identified members of line doublets to have identical redshifts and FWHM. We list in columns 2-6 of Table 1 the wavelength, equivalent width (along with errors) and the significance level for each line detected by the search algorithm. The wavelength, equivalent width and FWHM derived by SPECFIT are presented in columns 7-9 designated by the subscript FIT. Line identifications and redshifts are presented in columns 10 and 11. Figure 2 shows the normalized spectrum with the normalized continuum and fitted absorption lines overdrawn. The normalized, errors to the data are also shown. We list in the first column of Table 1 the number assigned to each absorption line by the detection algorithm. These numbers are used to label the corresponding absorption line in Figure 2.


Our detection threshold is below the “complete sample” threshold used by the QALKP, . Since a major goal of the Key Project was the statistical distribution of Ly absorbers, they considered only spectral features above this threshold to ensure no spurious detections. However, in the Bahcall et al. (1993) discussion of individual systems, they include lines of significance level when such lines are expected (their “incomplete sample”). Our choice includes the detection of the weaker doublet member Si IV of the system which we expect given that the stronger doublet member, Si IV , is present with . Therefore, we include lines with in Table 1 for illustrative reasons, but we use lines with when focusing on the properties of individual systems.
3.2. Optical Depths and Column Densities of Absorption Lines
Analyses of the absorption lines suffer from inherent problems arising from uncertainties in the pre-COSTAR FOS Line Spread Function (LSF). Our HST/FOS spectra have only moderate resolution ( km s-1) and the convolution of the line widths with the LSF broadens the FWHM of the line which can hide multiple line components. Both of these limitations tend to underestimate the optical depth (and hence column density) of absorption lines in the standard curve-of-growth analysis.
Therefore, we derived velocities relative to , , Doppler parameters, , and column densities, , using the line profile fitting routine MADRIGAL which compares observed absorption line profiles with theoretical models (Bowen, Blades, & Pettini (1995)). Unlike SPECFIT, MADRIGAL uses the oscillator strength for a given transition and its use is only appropriate for the identified absorption lines. Initial line profiles were computed given initial values for and using the equivalent widths and FWHM of the SPECFIT results. These were convolved with the LSF of the pre-COSTAR aperture, which is a Gaussian profile with a FWHM of 3.36 pixels222 see http://www.stsci.edu/ftp/instrument_news/FOS/fos_curstat.html. A final set of values for , and were derived by varying the initial parameters and minimizing a statistic between the model and the observed data. In all cases the data is of insufficient resolution to differentiate between single and multi–component absorption line profiles and the best fits are obtained with single component absorption lines. As a result, the derived values for the Doppler parameter indicate the spread of observed line profile and it is more useful to report the FWHM of the lines.333For purely Gaussian profiles, . For the three systems, the best values for , and FWHM are shown in Table 2.
| Creation | |||||||
|---|---|---|---|---|---|---|---|
| Energy | bbThese uncertainties represent purely statistical standard deviations and do not include systematic errors due to effects such as proper normalization or extraneous line contamination. | FWHM | bbThese uncertainties represent purely statistical standard deviations and do not include systematic errors due to effects such as proper normalization or extraneous line contamination. | ccDue to the low resolution of the FOS, the derived column densities are lower limits. See text for discussion. | bbThese uncertainties represent purely statistical standard deviations and do not include systematic errors due to effects such as proper normalization or extraneous line contamination. | ||
| Line | (eV) | (km s-1) | (km s-1) | (km s-1) | (km s-1) | (cm-2) | (cm-2) |
| O VI | 113.900 | 20 | 435 | 57 | 15.0 | 0.04 | |
| Si III | 16.346 | 20 | 28 | 125 | 93 | 13.2 | 0.28 |
| H I | 0.000 | 5 | 157 | 93 | 14.5 | 0.01 | |
| Si IV | 33.494 | 9 | 35 | 48 | 85 | 13.3 | 0.02 |
| H I | 0.000 | 18 | 19 | 83 | 120 | 14.6 | 0.04 |
| O VI | 113.900 | 77 | 7 | 325 | 15 | 15.4 | 0.02 |
| Si III | 16.346 | 13 | 143 | 28 | 13.3 | 0.04 | |
| H I | 0.000 | 24 | 3 | 215 | 4 | 15.3 | 0.03 |
| N V | 77.474 | 13 | 6 | 295 | 13 | 14.8 | 0.02 |
| Si IV | 33.494 | 54 | 273 | 72 | 13.7 | 0.12 | |
We estimated the uncertainties on the derived values of , and by using a Monte–Carlo analysis of the spectrum. Using the same procedure as above, we measured the column densities and Doppler parameters in each of artificial spectrum which were constructed with Poisson noise identical to that of the FOS data. The new values differ from the original parameters by , , and and the distribution of these parameters is approximately Gaussian in one dimension. The and are correlated and the strength of this is dependent on the width of the line. For example, narrow lines which cover only a few pixels are more sensitive to changes as a result of Poisson noise and therefore have greater uncertainties for . We adopt the of the one dimensional – distribution as the uncertainty. In general, however, the uncertainty of one parameter should be taken with in the other due to the correlation. These errors only represent the Poisson statistics and do not incorporate systematic effects due to the unknown multi–component composition of the absorption lines and uncertainties in the calibration.
Any unresolved, narrow absorption lines contribute little to the equivalent width but may contain large column densities. Therefore, the derived values of are, strictly speaking, lower limits. Since most of the systems appear to be highly ionized, the absorption lines may be intrinsically broad. In that case the measured column densities are likely to be fairly close to the true values. High–resolution spectra are required to differentiate any unresolved components.
3.3. Absorption Lines in the Ly Forest
The analysis of the absorption lines in the range Å requires special consideration since this region is strongly affected by the Ly forest and is near the peak of the Ly emission line. We have normalized the emission feature using the observed flux and errors, but the true peak in the emission flux may be significantly higher and strongly attenuated by the absorption lines. Equivalent widths derived for absorption lines in the region of the peak (including: Si III, ; Ly, ; Ly, ) are underestimated if this is the case. However, since the theoretical fit reproduces Ly and Ly of the system very well (cf. Figure 3), the attenuation cannot be too severe.
Intervening Ly lines may conspire to produce spurious detections or increase the equivalent width of a detected line. We use the statistical distribution of Ly lines to predict the extent to which this effect interferes with the analysis. Weymann et al. (1998) measure the differential number of Ly forest lines as a function of redshift and rest equivalent width for QSO lines of sight. Using the empirical results of their sample, we expect Ly forest lines with in our spectral range (), and we detect seven such lines (see Table 1). Therefore, these lines are consistent with absorption due to the Ly forest.
3.4. Relative Velocities and Redshifts
The emission redshift of Q0122+0338 was derived by Arp & Duhalde (1985) from observations of the C III] and Mg II emission lines. The reported emission redshift, , is the average from observations of separate nights, and 1.205. However, the relation between the redshift derived from emission lines and the true QSO systemic redshift remains uncertain. Tytler & Fan (1992) demonstrated the statistical existence of velocity shifts in QSO emission lines from the true systemic velocity. The bias velocity shifts for the C III] and Mg II emission lines (the lines used to determine the redshift of Q0122+0338) are statistically blueshifted by km s-1. Similarly, Espey (1993) cites evidence that although the high-ionization emission lines (e.g., Ly, C IV ) are typically blueshifted with respect to forbidden lines (e.g., [O III] ) by km s-1, the velocity difference between the forbidden lines and the Balmer series and low-ionization lines (e.g., Mg II ) are approximately nil. Therefore, a fair estimate for the systemic redshift of Q0122+0338 is probably .
The systemic redshift has important implications for the relation between the absorption system and the QSO host galaxy. The velocity shift between them ranges from slow to moderately rapid infall ( km s-1) depending on the systemic redshift adopted. If the velocity difference is small, then the absorbing gas may be essentially at rest with respect to the QSO and may be produced in the halo of the host galaxy or a close neighboring galaxy. If the velocity difference is large, then either a substantial flow exits, or there are large peculiar velocity dispersions among neighbors, or the absorber is moving as a result of the cosmological expansion.
3.5. Galactic Absorption Features
We observe Galactic absorption in the spectrum of Q0122+0338 from intervening Fe II , , and Mg II 2803.444 We observe a strong absorption feature with Å and Å which corresponds to Galactic Mn II . Based on the oscillator strengths, this ion is expected to produce the a comparable transition, Mn II . Since the latter is absent in the FOS spectrum, this absorption line is most plausibly due to a chance intervening line (probably Ly). The observed features are listed in Table 1. The lines of the Mg II 2803 doublet have equivalent widths Å and an equivalent width ratio of 1:1. Therefore, these lines are probably saturated and are comparable to results from previous studies (e.g., Savage et al. (1993)). The Fe II and Fe II are stronger than expected based on the transition strengths relative to the other lines, and Fe II is redward by Å from the expected wavelength. These lines probably suffer line contamination, most likely from the Ly forest. In the other cases, absorption from the Fe II transitions have equivalent widths and ratios typical compared to Mg II for absorption in the Galactic halo. However, the resolution is inadequate to allow for further improvement over previously published results.
4. Discussion of Individual Absorption Systems
4.1.
Absorption lines identified at are O VI , 1037, Si III , Si IV and Ly. Although no other absorption lines are present in this system at the detection threshold, N V is coincident with the large absorption feature of Ly () observed at Å. Evidence for absorption from the weaker doublet line, N V , may be implied by the complex absorption feature centered around Å (line 31 in Table 1). This wavelength region is in a knotty section of the Ly+N V emission line which does not allow for useful measurements of the column density. If we place an upper limit on the equivalent width of N V at the detection threshold, the column density is N V cm-2. The detection of Si IV is weak, . Since this system contains strong O VI and Si III, Si IV is expected and we consider this line identification real for the remainder of the discussion.
Since the relative velocity between the QSO emission lines and this absorption system is km s-1, we classify this system as associated to Q0122+0338. The detection of O VI indicates a high-ionization level which is usually assumed to indicate that the absorber is ionized by the QSO, a not uncommon feature of systems (Savaglio et al. (1997); Hamann et al. 1997d ; Savage, Tripp, & Lu (1998)). However, O VI absorption is also known (in at least one case) to arise in a low-density halo ionized by the UV-background (Savage et al. 1998).
A consistent model for the absorption must account for the presence of Si III, Si IV, O VI, and lack of N V. As discussed in Hamann (1997), the detection of O VI and absence of singly ionized metals (such at C II and Si II) in a single-zone model requires an ionization parameter in the range, , where is the dimensionless ratio of the density of hydrogen-ionizing photons to the electron density. This range of ionization is expected to produce a substantial fraction of N V relative to other ions, e.g., is expected to produce N VO VI. Therefore, its absence in the single-zone model indicates the nitrogen abundance in the gas must be depleted relative to oxygen and silicon. This implies the absorption may arise in a low metallicity environment which agrees with models of galactic chemical evolution since both oxygen and silicon are produced at early epochs in metal-poor, Population II stars (so called -elements) while nitrogen is dominantly produced in successive generations of Population I stars via the CNO cycle.
Instead of a single value for the ionization parameter, an alternative scenario is that a range of values exists. The next simplest case is a two-zone model where a high value for the ionization parameter, , is responsible for the O VI absorption, while the Si III and Si IV originate in a region with . If we compare the two-zone model to a galactic-like structure, the low ionization lines arise in a disk-like, high-density region (), while the O VI absorption originates in a high-temperature, low-density (), pressure confining halo which corotates with the disk .
The origin of the absorption in this system remains uncertain. It may originate in a neighboring structure, separated in velocity by the cosmological expansion or peculiar motions along the line of sight. An alternative possibility is the absorption arises in a substantial outflow from the QSO engine. However, the latter scenario may be inconsistent with other systems since they typically have enhanced N V with respect to O VI (cf. Hamann et al. 1997d ). The basic arguments show that this system is consistent with the absorption originating in either a metal depleted, low-density halo, or a line of sight passing through multiple zones of a neighboring galaxy. Therefore, the origin remains unclear, and there is insufficient evidence to classify the system as intrinsic to Q0122+0338.
4.2.
We detect Ly and Ly at with rest equivalent widths given in Table 1. The Doppler parameter of Ly is broad, but the observed wavelength of this line is in the vicinity of strong O VI lines from other systems and resides in the low S/N portion of the FOS detector. The residuals from the best fit to the line profile shows an underlying complex structure. The minimum neutral hydrogen column density is H I cm-2. No metal absorption lines are present in this system and the strongest lines expected have equivalent width upper limits at the detection threshold, Å. This is in stark contrast to the metal absorption lines in the system where (H I) is almost identical. The corresponding upper limits on the strongest metal lines are Si II cm-2, O I cm-2, O VI cm-2, and N V cm-2. The absorber is likely metal poor. Since this absorber has a relative velocity of km s-1, it is under the influence of the QSO. However, without stronger knowledge of other lines in this system, it is not possible to determine the ionizing source, e.g., the QSO or the UV background. Evidence for the origin of the system is inconclusive given only the detection of two Lyman series lines. The existence of a metal poor absorber so close in redshift to a high metallicity one remains intriguing, however.
4.3.
The absorption system of is highly ionized given the presence of O VI , 1037, Si III , N V , 1242, Si IV , 1402, Ly and Ly, and the lack of any low-ionization states including C I , C II , N I , N II , O I , and Si II . The expected wavelength of the C IV , 1550 doublet is Å and is redward of the spectral range of the FOS G270H grating. The absorption system has large equivalent widths and the doublets are well resolved. The properties of these lines are listed in Table 1, and the column densities are listed in Table 2. The overall relative velocity of the absorption system is redward of the emission redshift of Q0122+0338 by km s-1 implying infall toward the emission source.
We observe an absorption feature at Å which the line detection software assigns a significance level of . Using a Gaussian fit, SPECFIT calculates a larger value, , and a total equivalent width, Å. Since this line resides in the Ly forest, our original identification was intervening Ly. The observed wavelength of this line also corresponds to P V at . Since the lines in this system are strong, the detection of P V is not necessarily unexpected. This atomic transition occurs as a doublet, and the other doublet member, P V , is redshifted to Å. Based on the oscillator strengths, the P V line is expected to be weaker by up to a factor of two compared to P V . There is a strong absorption line at Å with that exhibits a complex profile. If the P V identification of this line is correct, then the absorption at Å must result from blending of multiple lines (probably from the Ly forest) which are unresolved at the resolution of FOS. Since the detection of P V has potentially important implications for the metal enrichment and ionization states of intrinsic absorption systems (cf. Hamann (1998)), we consider this line a possible identification of P V .
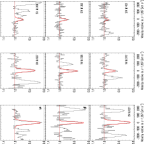
The profiles for the nine lines in this system are shown in Figure 3 as normalized flux versus velocity relative to the nominal redshift value, . The absorption lines may consist of several, narrow components with slightly varying (and indeterminable) relative velocities and covering factors. When observed with the modest seeing of the FOS, they appear as a single, broader (FWHM km s-1) line. This system is a candidate for intrinsic absorption since it is close to the QSO emission in velocity space and is highly ionized.
4.3.1 Ionization
The dimensionless ionization parameter, , is a useful parameterization for the ionization state of the absorbing gas. Given the presence of highly ionized, strong N V and O VI and the absence of Si II and C II, the ionization parameter is in the range .
We can investigate the ionization state of the system by rewriting the ionization parameter as
| (2) |
where is the speed of light, is the Planck constant, is the electron density of the gas, is the luminosity distance from the observer to the ionizing source (QSO engine), and is the distance between the QSO and the absorbing material. The hydrogen ionizing threshold frequency is , and is the observed spectral flux (erg cm-2 s-1 Hz-1). To evaluate the integral, we adopt a spectral energy distribution for the QSO emission source that is similar to a typical radio-quiet AGN (cf. Hamann (1997)),
| (3) |
The value of is chosen to reproduce the ultraviolet peak typically seen in AGN spectra, and eV is an infrared cut-off to prevent free-free heating at low energies. The function is chosen to produce to the correct relative strengths of the UV and X-ray fluxes and incorporates cut-offs in the X-ray producing mechanism at high and low energies.
To emulate the spectral energy distribution of Q0122+0338, we adopt K and spectral indices of , which empirically agrees with the FOS and ROSAT observations (§2; Yuan et al. (1998)). From this, we extrapolate a rest-frame optical flux density of 2500 Å erg cm-2 s-1 Hz-1 and derive an X-ray to optical two-point power law index, [2 keV2500 Å]. Using equation (3) and a fiducial value for the deceleration parameter, Mpc, equation (2) can be evaluated and rewritten as
| (4) |
where is the electron density in units of cm-3, and here, is the dimensionless Hubble parameter, km s-1 Mpc-1.
We investigate the ionization quantitatively with the photoionization code, CLOUDY (v. 90.03, Ferland (1996)). For the ionizing source, we use the spectrum defined above. The absorber is modeled as a plane-parallel slab, illuminated on one side by the QSO. We tested a range of absorber electron densities, cm-3, and observed that the ionization level is approximately constant for a given value of in the range of interest (). Therefore, we used a fixed electron density, cm-3, but note in passing that changes in the electron density do not significantly alter the qualitative results. The metallicity of the gas is normalized to solar values from a compilation of meteoritic, photospheric and coronal abundances (Grevesse & Anders (1989)). To examine the state of the absorbing medium for a range of input parameters, we used CLOUDY to compute the output column densities, ionization fractions, and electron temperatures at a given ionization parameter for gas of specified total hydrogen column density and metallicity. Caution must be used when interpreting the results of the photoionization code since it assumes the absorber is in photoionizational equilibrium. This is not established a priori and may produce misleading results (cf. Krolik & Kriss (1995)).
The column densities which were deduced in §3.2 provide constraints on the permitted conditions of the absorbing material. Assuming these values are a good approximation of the true column densities (i.e. no substantial, hidden columns exist), the conditions of the absorber are almost uniquely reproducible (aside from systematic effects). We show in Figure 4 the CLOUDY results for the single–zone absorption model with a total hydrogen column density, cm-2, and metallicity, . The column densities calculated by the model are shown versus a range of ionization parameters, . Based on the relative velocity–ionization energy relation which we observe in this absorption system (see §4.3.2), it is unlikely that a single-zone model is a completely adequate description. The results presented here are, therefore, a simple paradigm for the ionization in this absorber. The model simultaneously reproduces the observed column densities for and corresponding electron temperature, K.
The derived ionization parameter corresponds to spatial dimensions of pc. However, without a constraint on the electron density of the absorber, the distance to the ionizing source remains unknown. The presence of O VI indicates the lines are highly ionized and is evidence for intrinsic absorption. The supersolar metallicity which is needed to model the column densities in this system is also common in intrinsic absorption systems. However, as discussed in §4.1, these features are not exclusive to intrinsic absorbers. An investigation of the time-variability nature of the absorption lines could provide a useful upper limit on the recombination time, (, where is the recombination coefficient), which in turn would establish a lower limit on the electron density and thus a constraint on the distance from the ionizing source. The ionization state of the system alone does not distinguish the location of the absorber.
Since the derived column densities only provide constraining lower limits, the model depicted in Figure 4 is not unique. ROSAT X-ray observations provide some insight into the total absorbing hydrogen column density lying along the sight line, cm-2 (Yuan et al. (1998)). However, the contribution of neutral hydrogen from the Milky Way is estimated to be H I cm-2, meaning that any further absorption would come from a column of cm-2. Our adopted value of cm-2 is therefore not inconsistent with the X-ray data. Since our derived column densities are only estimates due to the nature of the FOS observations, there is a degeneracy between the total column density and the metallicity in the absorption models. Using our results from CLOUDY, for cm-2, the metallicity must be significantly higher to account for the observed columns. Subsolar metallicities are likewise not completely excluded, but substantially more H I is expected relative to the metallic columns derived from the FOS data in this case.


4.3.2 Relative Velocity of the Gas Flow and Multi-Component Absorption
The positive relative velocity for the absorption system implicitly indicates the absorbing gas is infalling toward the central AGN, yet the systemic redshift could be slightly larger than that adopted for Q0122+0338, and outflow cannot be entirely excluded. Infall has been observed in several other metal systems (Savaglio et al. 1997; Dobrzycki, Engels, & Hagen (1999)) and in several Ly absorption systems in a Ly emission line survey of radio galaxies (van Ojik et al. (1997)).
The absorption lines in this system contain varying velocities relative to the emission redshift ( km s-1) and span a wide range of ionization. Furthermore, these properties are correlated in the sense that the centroids of the more highly excited lines have higher relative velocities. If the absorption system contains multiple components, then the ionization state depends on the density and distance from the ionizing source for each component (in this case the QSO engine).
We quantify this relationship by comparing the relative velocity of each line with the creation ionization potential energy (CIP) required to produce the line. The CIP of ion is defined as the energy required to ionize the state to . The second column of Table 2 contains the CIP for each ion. In Figure 5, we plot the velocity of each ion, relative to the emission redshift, versus the CIP.
An explanation for this correlation is that the more highly ionized absorption line components are shifted blueward of less ionized ones. Clearly, the CIP is related to the ionization parameter since at higher values of , more ionizing photons are available to produce the more highly excited ions. Using the relationship in equation (4), the more blueward line components have lower values of . The simplest model has two absorption components, with higher and lower levels of ionization, and a velocity separation of km s-1. The convoluted sum of these components results in a shift of the observed absorption line centroids. The column densities of the lower ionization species (e.g., Si III, Si IV) result mostly from the less ionized component and the column densities with the highest ionization (e.g., O VI) result mainly from the higher ionized component with little contribution from the other.
It is interesting that the relative velocity of the H I lines do not follow the correlation and are approximately equal to the value of the N V doublet. In the context of a two-component model, most of the H I absorption occurs from the highly ionized line component. This is plausible since, unlike the other elements in this system, there are no higher ionization states for hydrogen. It is also possible that if the more highly ionized component occults the other and is not optically thin, then it may shield the lower ionization component from part of the ionizing continuum. Therefore, there is not necessarily any discrepancy between the observed correlation and the relative velocity of H I.
The correlation between relative velocity and ionization level has not been reported in other systems. We examined 17 other QSO absorption line systems (both associated and intervening) from 11 QSO lines of sight (PKS2135147, Hamann et al. 1997d ; H1821+643, Savage et al. 1998; PKS0123+257, Barlow & Sargent (1997); Q0002619, Savaglio et al. 1997; Q2116358, Wampler et al. 1993; Q0347241, Q2116358, Møller et al. 1994; HS1946+7658, Tripp, Limin, & Savage (1996); Q2343+125, Hamann et al. 1997c; PKS0424131, Q0450131, Petitjean et al. 1994), and none of the intervening absorption systems bear a velocity correlation with CIP. Only one other associated absorption system, Q0450131 (Petitjean et al. 1994), may suggest a similar correlation. In this system, the relative velocity between the emission and absorption system is km s-1 and there is a similar trend between ionization strength and relative velocity. However, the ionization only spans the range Si III to N V (O VI was blueward of the spectral grating) and any correlation among the few identified lines is only suggestive at best. Therefore, the absorption system of Q0122+0338 is possibly the first observation of a CIP–velocity correlation in an associated QSO absorption system. Why only this system should show such an effect is unclear.
The origin of the absorption system remains inconclusive. High-resolution, UV spectroscopy may provide the answer. If the multiple absorbing components are resolved with the improved resolution, this would permit a detailed analysis of the individual constituents. If the line components are well resolved and separated by the few hundred km s-1 then the origin of the system might be from halos of neighboring galaxies moving in the potential of the QSO cluster. However, the presence of significant N V (and possible P V) and high overall metallicity is unusual for extended galactic features. Alternatively, the broad nature of the absorption profiles may remain even when viewed at high resolution. This feature, combined with the high level of ionization and high metallicity, is similar to the BAL phenomenon and may suggest that the absorber consists of many dense components with a small volume filling factor. The problem with this scenario is that broad, intrinsic lines typically show outflow velocities of up to thousands of km s-1 compared to the emission redshift of the QSO. This is in contrast the system which is presented here. It is also possible that both scenarios to contribute to this system. Therefore, the source of this absorber is not clearly evident.
5. Summary
We have analyzed the three associated () absorption systems identified in the spectrum of Q0122+0338 over the wavelength range Å using HST/FOS data. All the systems have relative velocities within km s-1 of the emission redshift and are highly ionized.
The associated system at shows highly ionized O VI, Si III, and weak Si IV. The large deconvolved FWHM ( km s-1) of the O VI lines indicate there are probably unresolved narrow subcomponents with a velocity dispersion along the line of sight of a few hundred km s-1. Since this system is separated from the emission redshift by km s-1 and contains O VI, Si III, and Si IV but is devoid of other highly ionized lines to the limits of detection [e.g., N V cm-2], its origin is unclear.
Only Ly and Ly are identified in the absorption system at , with a neutral hydrogen column density of H I cm-2. No metallic ions are detected in this system and the upper limits on the strongest expected metal lines are Si II cm-2, O I cm-2, O VI cm-2, and N V cm-2. The origin of this system is inconclusive given only the presence of two Lyman-series lines.
The most complex system is at and shows prominent absorption due to Ly, Ly, N V, O VI, Si III, Si IV, and possibly, P V. Comparisons with photoionization simulations show that the minimum column densities derived for the absorption lines of this system are consistent with an absorber of metallicity, , and total hydrogen column density, cm-2, which is ionized by the incident radiation of Q0122+0338. If the identification of P V in this associated system is valid, then this suggests that the ionization and optical depth may be very high. The absorption lines have individual relative velocities km s-1 toward the QSO (e.g., infall) and these are correlated with the creation ionization potential energy for each transition.
The origin of the absorber remains inconclusive. The highly-ionized species of O VI and N V (and possibly P V), with broad absorption profiles and high overall metallicity are common features of intrinsic absorption systems. If the absorption lines remain unresolved at higher resolution, then the relative velocity–ionization energy relationship may indicate the absorber contains many small, dense clumps with a low volume filling factor. However, if the absorption lines result from the convolution of several components, then the data is equally well explained by absorption components from nearby galaxies moving in the potential of the QSO cluster environment. Line-variability investigations could yield constraints on the absorber density and distance from the ionizing source which could definitively yield the location of the absorber. Therefore, the origin of this absorption system will undoubtedly remain uncertain until future observations of Q0122+0338 become available.
References
- Aldcroft, Bechtold, & Foltz (1997) Aldcroft, T., Bechtold, J., & Foltz, C. 1997, in ASP Conf. Prov. 128, Mass Ejection from AGN, ed. R. Weymann, I. Shlosman, & N. Arav (San Fransisco: ASP), 25
- Anderson et al. (1987) Anderson, S. F., Weymann, R. J., Foltz, C. B., & Chaffee, F. H., Jr. 1987, AJ, 94, 278
- Arp & Duhalde (1985) Arp, H., & Duhalde, O. 1985, PASP, 97, 1149
- Bahcall et al. (1993) Bahcall, J. N., et al. 1993, ApJS, 87, 1
- Barlow et al. (1992) Barlow, T. A., Junkkarinen, V. T., Burbidge, E. M., Weynmann, R. J., Morris, S. L., & Korista, K. T. 1992, ApJ, 397, 81
- Barlow & Sargent (1997) Barlow, T. A., & Sargent, W. L. W. 1997 AJ, 113, 136
- Barthel et al. (1988) Barthel, P. D., Miley, G. K., Schilizzi, R. T., & Lonsdale, C. J. 1988, A&A, 73, 515
- Barthel, Tytler, & Thomson (1990) Barthel, P. D., Tytler, D. R., & Thomson, B. 1990, A&A, 82 339
- Bowen, Blades, & Pettini (1995) Bowen, D. V., Blades, J. C., & Pettini, M. 1995, ApJ, 448, 634
- Dobrzycki, Engels, & Hagen (1999) Dobrzycki, A., Engels, D., & Hagen, H.-J. 1999, A&A, 349, L29
- Espey (1993) Espey, B. R. 1993, ApJ, 411, L59
- Evans (1993) Evans, I. N. 1993, FOS Instrument Science Rep. (CAL/FOS-104) (Baltimore: STScI)
- Ferland (1996) Ferland, G. J. 1996, “HAZY: a Brief Introduction to Cloudy,” Univ. Kentucky, Dept. Physics & Astron., Internal Rep.
- Ferland et al. (1996) Ferland, G. J., Baldwin, J. A., Korista, K. T., Hamann, F., Carswell, R. F., Phillips, M., Wilkes, B., & Williams, R. E. 1996, ApJ, 461, 683
- Foltz et al. (1988) Foltz, C. B., Chaffee, F. H., Jr., Weymann, R. J., & Anderson, S. F. 1988, in QSO Absorption Lines: Probing the Universe, ed. J. C. Blades, D. A. Turnshek, & C. A. Norman (Cambridge: Cambridge Univ. Press), 53
- Foltz et al. (1986) Foltz, C. B., Weymann, R. J., Peterson, B. M., Sun, L., Malkan, M. A., & Chaffee, F. H., Jr. 1986, ApJ, 307, 504
- Grevesse & Anders (1989) Grevesse, N., & Anders, E. 1989, in AIP Conf Proc. 183, Cosmic Abundances of Matter, ed. C.I. Waddington (New York: AIP), 1
- Hamann (1997) Hamann, F. 1997, ApJS, 109, 279
- Hamann (1998) Hamann, F. 1998, ApJ, 500, 798
- Hamann et al. (1995) Hamann, F., Barlow, T. A., Beaver, E. A., Burbidge, E. M., Cohen, R. D., Junkkarinen, V., & Lyons, R. 1995, ApJ, 443, 606
- (21) Hamann, F., Barlow, T. A., Cohen, R. D., Junkkarinen, V. T., & Burbidge, E. M. 1997a, in ASP Conf. Proc. 128, Mass Ejection From AGN, ed. R. Weymann, I. Shlosman, & N. Arav (San Fransisco: ASP), 19
- (22) Hamann, F., Barlow, T. A., Cohen, R. D., Junkkarinen, V. T., & Burbidge, E. M. 1997b, in ASP Conf. Proc. 128, Mass Ejection From AGN, ed. R. Weymann, I. Shlosman, & N. Arav (San Fransisco: ASP), 187
- (23) Hamann, F., Barlow, T. A., Junkkarinen, V. T. 1997c, ApJ, 478, 87
- (24) Hamann, F., Beaver, E. A., Cohen, R. D., Junkkarinen, V., Lyons, R. W., & Burbidge, E. M. 1997d, ApJ, 488, 155
- Hamann & Ferland (1993) Hamann, F., & Ferland, G. 1993, ApJ, 418, 11
- Hamann & Ferland (1999) Hamann, F., & Ferland, G. 1999, ARA&A, in press (astro-ph/9904223)
- Krolik & Kriss (1995) Krolik J. H., & Kriss, G. A. 1995, ApJ, 447, 512
- Kriss (1994) Kriss, G. A. 1994, in A.S.P. Conf. Series, Vol. 61, Astronomical Data Analysis Software & Systems III, ed. D. R. Crabtree, R. J. Hanisch, & J. Barnes (San Francisco: ASP), 437
- Matteucci & Padovani (1993) Matteucci, F, & Padovani, P. 1993, ApJ, 419, 485
- Møller, Jakobsen, & Perryman (1994) Møller, P., Jakobsen, P., & Perryman, M. A. C. 1994, A&A, 287, 719
- Norman et al. (1996) Norman, C. A., Bowen, D. V., Heckman, T., Blades, J. C., & Danly, L. 1996, ApJ, 472, 73
- Petitjean, Rauch, & Carswell (1994) Petitjean, P., Rauch, M., & Carswell, R. F. 1994, A&A, 281, 331
- Savage et al. (1993) Savage, B. D., et al. 1993, ApJ, 413, 116
- Savage, Tripp, & Lu (1998) Savage, B. D., Tripp, T. M., & Lu, L. 1998, ApJ, 115, 436
- Savaglio et al. (1997) Savaglio, S., Cristiani, S., D’Odorico, S., Fontana, A., Giallongo, E., & Molaro, P. 1997, A&A, 318, 347
- Smith & Heckman (1990) Smith, E. P. & Heckman, T. M. 1990, ApJ, 348, 38
- Schneider et al. (1993) Schneider, D., et al. 1993, ApJS, 87, 45
- Tripp, Limin, & Savage (1996) Tripp, T. M., Limin, L., & Savage, B. D. 1996, ApJS, 102, 239
- Turnshek et al. (1996) Turnshek, D. A., Kopko, M., Monier, E., Noll, D. Espey, B., & Weymann, R. J. 1996, ApJ, 463, 110
- Tytler & Fan (1992) Tytler, D., & Fan, X.-M., 1992, ApJS, 79, 1
- van Ojik et al. (1997) van Ojik, R., Röttgering, H. J. A., Miley, G. K., & Hunstead, R. W. 1997, A&A, 317, 358
- Verner, Barthel, & Tytler (1994) Verner, D. A., Barthel, P. D., & Tytler, D., 1994, A&AS, 108, 287
- Véron-Cetty, & Véron (1998) Véron-Cetty, M. -P., & Véron, P. 1998, A Catalogue of Quasars and Active Nuclei, 8th ed. to appear in ESO Scientific Report No. 18
- Wampler, Bergeron, & Petitjean (1993) Wampler, E., J., Bergeron, J., & Petitjean, P., 1993, A&A, 272, 15
- Weymann et al. (1998) Weymann, R. J., et al., 1998, ApJ, 506, 1
- Weymann et al. (1979) Weymann, R. J., Williams R. E., Peterson B. M., Turnshek, D. A. 1979, ApJ, 234, 33
- Yuan et al. (1998) Yuan, W., Brinkmann, W., Siebert, J., & Voges, W. 1998, A&A, 330, 108