Galaxy Interactions and Starbursts at High Redshift
Abstract
Using high resolution N-body simulations with hydrodynamics and star formation, we investigate interactions and the resulting starbursts in galaxies with properties typical of . We apply spectral population models to produce mock-HST images, and discuss the observed magnitude, color, and morphological appearance of our simulated galaxies in both the rest-UV and rest-visual bands.
1Racah Institute of Physics, Hebrew University, Jerusalem
2 Physics Department, University of California, Santa Cruz
3 Department of Astronomy, Case Western Reserve University
1. Introduction
An interest in galaxy interactions at high redshift can be motivated from several directions. It has been shown that many of the observed properties of galaxies at –4 (e.g., their number density, luminosity function, colours, sizes, velocity dispersions, etc.) are well-reproduced by a model in which these galaxies are predominantly starbursts triggered by galaxy interactions (Somerville, Primack, & Faber 1999; SPF). In addition, the collision rate of dark matter halos in high-resolution cosmological N-body simulations shows a marked increase at earlier epochs, and the clustering properties of these colliding halos at are similar to those of the observed Lyman-break galaxies (Kolatt et al. 1999).
Previous numerical investigations of starbursts in interacting galaxies (e.g. Mihos & Hernquist 1994a; 1996) have assumed initial properties typical of local galaxies. Many of these properties (e.g., gas content, surface density, disk-to-halo ratio) may be quite different at high redshift. Using the same code as Mihos & Hernquist, we are carrying out an ongoing program of simulations to more fully explore the parameter space with an emphasis on high-redshift galaxies. A more complete version of these preliminary results will be presented in Rosenfeld et al. (in prep.).
2. Simulations
We use the TREESPH code, including star formation using a Schmidt law () as described in Mihos & Hernquist (1994b). We set the proportionality constant in this equation by requiring the isolated galaxies to lie on the relation given by Kennicutt (1998). Masses and mass ratios of typical colliding dark matter halos at were determined using the simulations discussed in Kolatt et al. (1999). For all calculations requiring the assumption of a cosmology, we assume the same cosmological model as those simulations, namely , , and km/s/Mpc. The mass and exponential scale radius of the stars and gas in the galactic disk inhabiting a halo of a given mass at the desired redshift are estimated using the semi-analytic models of SPF, and are consistent with known properties of Lyman-break galaxies at . The disks are assumed to be stable before the start of the interaction. The results presented here are for an interaction between equal mass, bulgeless galaxies, with halo mass , stellar mass , stellar scale radius 1.7 kpc, gas fraction and gas scale radius 3.4 kpc. All other properties (relative inclination, orbit, etc.), are the same as the fiducial case of Mihos & Hernquist (1996; MH96).
3. Results


The star formation rate over the course of the interaction is shown in figure 1 (left panel). The behaviour is qualitatively similar to the results of MH96. We convolve this star formation history with stellar population models (GISSEL98, Bruzual & Charlot in prep.) to obtain the apparent magnitude of the galaxy at (figure 1, right panel). We have used the solar metallicity models with a Salpeter IMF. We show the magnitudes in the WF/PC F606W () and NICMOS F160W () filters (AB system), which probe the rest-frame and part of the spectrum at . The top set of curves in the right panel neglects dust extinction; the bottom set shows the result of including a correction of a factor of at 1500 Å, as suggested by recent observational estimates of typical extinction corrections in bright LBGs (Meurer et al. 1999; Steidel et al. 1999), and assuming a Calzetti attenuation curve (Calzetti et al. 1996). With this level of dust extinction, the bursting galaxy would be visible at present spectroscopic limits for about 200 Myr, whereas in the absence of the burst the galaxy would have been well below the detection limit. Note that in the absence of dust reddening, the color of the galaxy during the burst is quite blue (-0.5 – 0), but after the dust correction, typical values (0.5 to 1.0) are reasonably consistent with observations.
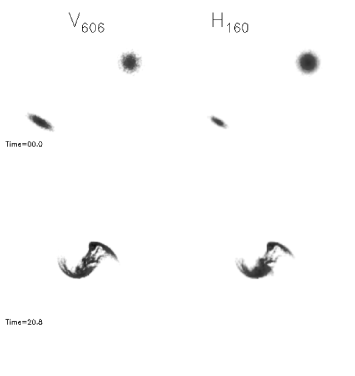
Figure 2 shows how the interacting galaxy would appear if observed at by HST (in the absence of noise or sky background) at various times during the merger. Left panels show the WF/PC filter with a pixel size of 0.04 arcsec; the right panels show the NICMOS filter with 0.08 arcsec pixels. From top to bottom, the galaxies are shown at the beginning of the simulation, during the first interaction of the galaxies, after the galaxies have separated again, and finally after the final merger. These images can be matched up with the star formation and total magnitude curves shown in figure 1 by multiplying the simulation time units shown on the figure by a factor of 8.3 to convert to Myr.
If in fact the observed galaxy population becomes increasingly dominated by merging starburst systems at higher redshifts, one would expect to observe larger fractions of galaxies with disturbed morphologies and significant substructure. We plan to use synthesized images such as figure 2 to develop statistics to quantify these effects, and eventually to test whether the morphological properties of observed high-redshift galaxies are consistent with the collisional starburst scenario.
References
Bruzual, A, & Charlot, S. in preparation
Calzetti, D., Kinney, A.L., & Storchi-Bergmann, T. 1996, ApJ, 458, 132
Kennicutt, R.C. 1998, ApJ, 498, 541
Kolatt, T.S. et al. 1999, ApJ, 523, 109
Meurer, G.R., Heckman, T.M., & Calzetti, D. 1999, ApJ, 521, 64
Mihos, J.C., & Hernquist, L. 1994a, ApJ, 425, 13
Mihos, J.C., & Hernquist, L. 1994b, ApJ, 437, 611
Mihos, J.C., & Hernquist, L. 1996, ApJ, 464, 641 (MH96)
Rosenfeld, G., Somerville, R.S., Kolatt, T.S., Mihos, J.C., Dekel, A. & Primack, J.R. in preparation
Somerville, R.S., Primack, J.R., & Faber, S.M. 1999, MNRAS, accepted (SPF)
Steidel, C.C., Adelberger, K.L., Giavalisco, M., Dickinson, M., & Pettini, M. 1999, ApJ, 519, 1