Horizontal-Branch Models and the Second-Parameter Effect.
III. The Impact of Mass Loss on the Red Giant Branch,
and the Case of M5 and Palomar 4/Eridanus
Abstract
Deep Hubble Space Telescope (HST) photometry has recently been presented for the outer-halo globular clusters Palomar 4 and Eridanus. The new high-precision color-magnitude diagrams obtained for these globulars have allowed a measurement of their ages relative to M5 (NGC 5904), which is a well-observed, much closer cluster. Assuming that the globular clusters share the same chemical composition, Pal 4/Eridanus have been reported to be younger than M5 by Gyr, based on both the magnitude difference between the horizontal branch (HB) and the turnoff and the difference in color between the turnoff and the lower subgiant branch. In the present article, we address the following question: What age difference would be required to account for the difference in HB types between M5 and Pal 4/Eridanus, assuming age to be the “second parameter”? We find that, unless all these clusters (including M5) are younger than 10 Gyr, such an age difference is substantially larger than that based on an analysis of the cluster turnoffs. To reach such a conclusion, six different analytical mass loss rate formulae (reported in an Appendix), all implying a dependence of mass loss on the red giant branch on age, were employed. Our results appear to be in conflict with claims that age can be the only second parameter in the Galactic globular cluster system.
Subject headings:
Hertzsprung-Russell (HR) diagram and C-M diagrams — stars: horizontal-branch — stars: mass loss — stars: Population II — globular clusters: individual: Palomar 4, Eridanus, M5 (NGC 5904)1. Introduction
One of the most important ingredients for the construction of a model of the formation of the Galaxy concerns whether the globular clusters (GCs) in the Galactic outer halo are younger or older than those in the inner halo (e.g., Mironov & Samus 1974; Searle & Zinn 1978; Zinn 1980, 1993; van den Bergh 1993; Majewski 1994).
The outer halo of the Galaxy is not well populated. From Table 7 in Borissova et al. (1997), one finds that in the “extreme” outer halo (galactocentric distances kpc) there are five very scarcely populated and loose clusters with (mostly) red horizontal-branch (HB) morphologies (Palomar 3, Pal 4, Pal 14, Eridanus, and AM-1), and one cluster with a blue HB. This blue-HB globular—NGC 2419—is, however, more massive (by a factor of ) than the sum of all outer-halo GCs with red HBs. Hubble Space Telescope (HST) observations have revealed that NGC 2419 is coeval with M92 (NGC 6341) (Harris et al. 1997), a much closer blue-HB globular which has always been considered to be among the very oldest GCs in the Galaxy (e.g., Bolte & Hogan 1995; Pont et al. 1998; Salaris, Degl’Innocenti, & Weiss 1997; VandenBerg, Bolte, & Stetson 1996).
Until recently, however, little information was available on the ages of the remaining extreme outer-halo GCs. HST observations have again helped remedy the situation. Stetson et al. (1999) have presented additional results of their ongoing HST survey of GCs lying at kpc. In particular, they presented deep WFPC2 F555W, F555W–F814W (, ) color-magnitude diagrams (CMDs) for Pal 4 and Eridanus—both of which have exclusively red HBs.111Stetson et al. (1999) also presented HST observations for Pal 3 and derived its age relative to M3 (NGC 5272). We defer analysis of this pair to a future paper because of the current difficulty in determining “representative” HB morphology parameters for M3, a cluster which appears to show a strong radial gradient in HB type. The latter conclusion can be obtained from a comparison among the datasets presented by Buonanno et al. (1994), Ferraro et al. (1997a) and Ferraro (1998)—the latter referring to HST-WFPC2 data for the innermost cluster regions (Ferraro et al. 1997b). Stetson et al. undertook an analysis of the ages of these GCs, as provided by traditionally employed techniques (e.g., Stetson, VandenBerg, & Bolte 1996 and references therein), and found that, under the assumption that M5 (NGC 5904) and Pal 4/Eridanus share the same chemical composition, these extreme outer-halo GCs with red HBs are younger than M5 ( kpc; Harris 1996) by Gyr.
VandenBerg (1999a) has recently reanalyzed the HST CMDs for the extreme outer-halo GCs with red HBs. Again assuming identical chemical compositions, he supports slightly smaller age differences ( Gyr) between M5 and Pal 4/Eridanus than reported by Stetson et al. (1999). Therefore, 2 Gyr appears to be a safe upper limit on such an age difference.
Fig. 1.— Combined HST CMDs for Pal 4 () and Eridanus (+). As indicated, reddenings of and 0.029 mag have been assumed for Pal 4 and Eridanus, respectively (based on Schlegel et al. 1998). The Eridanus CMD has been shifted by mag, thus accounting for the relative distance moduli of the two clusters (VandenBerg 1999a). The vertical dotted line, in gray, indicates the mean color of the bulk of the HB populations in the two clusters, mag. Note that the Schlegel et al. reddening values imply intrinsically bluer HBs than do the canonical reddening values tabulated by Harris (1996).
Though a lower age for Pal 4 and Eridanus would qualitatively appear consistent with their red HB types, Stetson et al. (1999) did not attempt to provide a reliable quantitative description of how large an age difference would be required to explain the difference in HB morphology between Pal 4/Eridanus and M5. Lee, Demarque, & Zinn (1994) have recently stated: “only a small number of clusters have been dated to sufficiently high precision to test the hypothesis that the second parameter is age, and there is some doubt that the detected age differences are consistent with the HB morphologies of the clusters. If they are not, this would suggest that age cannot be the sole second parameter.” We concur with such a statement and emphasize, therefore, that tests of age as the second parameter cannot be properly carried out without the required comparison with adequate models of the HB morphology of the clusters under consideration.
As we have done in the previous papers of this series (Catelan & de Freitas Pacheco 1993, 1994, 1995), we shall provide here the quantitative estimates of the age difference that is required to explain the HB morphologies of M5 vs. Pal 4/Eridanus. We shall assume that age is the sole second parameter. Using results reported in an Appendix (see also Catelan 1999), we shall examine in detail the effect of an age-dependent red giant branch (RGB) mass loss upon the inferred age differences, since there have been suggestions (e.g., Lee et al. 1994) that such an age dependence may help explain the second parameter phenomenon in terms of age.
We begin in the next section by describing the observational data for M5, Pal 4 and Eridanus employed in the present study. In §3, we describe our technique for obtaining synthetic HB models for these clusters. In §4, we explain how the age difference between Pal 4/Eridanus and M5 that is required to account for their different HB types was obtained from the models, taking into account several different analytical mass loss formulae for the mass loss in red giants. Finally, we present conclusions and provide additional discussion in §5.
2. Observational Data
2.1. HB Morphology of M5
Sandquist et al. (1996) have provided a very extensive account of the CMD morphology of M5. Recently, Sandquist (1998) has kindly readdressed the HB morphology parameters for the cluster. His latest values can be found in Table 1. In column 1, the Mironov (1972) index is given. In column 2, one finds the so-called “Lee–Zinn parameter” , first defined and used by Zinn (1986). In column 3, Buonanno’s (1993) index , where is the number of blue-HB stars bluer than mag, is provided. As usual, , , are the numbers of blue, variable (RR Lyrae–type) and red HB stars, respectively. The final two columns provide two alternative values for Fusi Pecci’s indicator (a “subjective” estimate of the red end of the HB distribution in B V; Fusi Pecci et al. 1993), where the first disregards the presence of a few red-HB stars lying “above the zero-age HB,” and the second takes such stars into account (Sandquist 1998). For additional information and references related to these indices, the reader is referred to Catelan et al. (1998).
It is important to note that Buonanno’s (1993) index is (unfortunately) reddening-dependent. For M5, mag (cf. Sandquist et al. 1996 and references therein). The value of the Buonanno parameter provided in Table 1 corresponds to the assumption that mag. Sandquist (1998) has kindly evaluated the effect of the reddening uncertainty upon this index for M5: he finds that, if the reddening is actually 0.02 or 0.04 mag, then this ratio would have the values or , respectively.
2.2. HB Morphology of Palomar 4 and Eridanus
Pal 4 and Eridanus have exclusively red HBs, making the computation of most of the above HB morphology indices meaningless for our purposes.
From the HST CMDs (see Stetson et al. 1999), it is clear that both Pal 4 and Eridanus share very similar HB morphologies. A combined CMD for the two clusters is shown in Figure 1. The stars were de-reddened by the indicated amounts, based on Schlegel, Finkbeiner, & Davis (1998). The Eridanus data were further shifted by mag, in order to account for the relative distance moduli of the two clusters (VandenBerg 1999a). As indicated by the vertical dotted line, the HB color distribution clearly shows a peak at mag (and little scatter around this point). Eridanus has a few () stars scattered towards brighter magnitudes and redder colors than does Pal 4; however, as shown below, this feature can be accounted for by statistical fluctuations related to the small number of HB stars (a total of ) available in the HST samples and evolution away from the zero-age HB (ZAHB).
3. Theoretical Framework: Synthetic HBs
The HB evolutionary tracks employed in the present project are the same as described in Catelan et al. (1998). The following chemical composition was assumed: main-sequence helium abundance , overall metallicity (see Sneden et al. 1992; Sandquist et al. 1996; Borissova et al. 1999; Stetson et al. 1999; and VandenBerg 1999a for discussions of the metallicities of M5, Pal 4, and Eridanus). Consistent with our working hypothesis that age is the sole second parameter, we assume that M5 and Pal 4/Eridanus have the same chemical composition.
We have assumed throughout this paper that the HB morphology of the studied GCs can be reproduced by unimodal Gaussian deviates in ZAHB mass (see Catelan et al. 1998 for a detailed discussion).
A relevant numerical improvement is the adoption of Hill’s (1982) interpolation algorithm also to interpolate among the evolutionary tracks of different masses in order to infer the physical parameters , of the “stars” in the HB simulations. The synthetic HBs were converted to the observational planes using the prescriptions provided by VandenBerg (1999b).
3.1. The Case of M5
Synthetic HBs have been computed aiming at estimating the optimum parameters (mean mass) and (mass dispersion) required to reproduce the observed HB morphology parameters for M5 (Table 1). The adopted procedure is completely analogous to that employed by Catelan et al. (1998).
We have computed synthetic HBs assuming an overall number of HB stars , as in Sandquist’s (1998) sample. For each (, ) combination, we computed a series of 100 Monte Carlo simulations and obtained HB morphology parameters therefrom. After many such trials varying the above two free parameters, we have converged on a set of models characterized by the following values:
Such a combination leads to the mean HB morphology parameters described in Table 2 (where the numbers in parentheses represent the standard deviation of the mean over the set of 100 simulations with 553 “stars” in each). Note the nice agreement between the observed (Table 1) and theoretical (Table 2) parameters, to within the errors.
It should be remarked that, if Buonanno’s (1993) parameter were bluer (implying a higher reddening; cf. §2.1), our simulations indicate that it would have been easier to account for the overall ratio between blue stars and RR Lyrae variables. Indeed, Schlegel et al. (1998) give mag for this cluster. The value would not differ significantly from the one quoted above though.
It follows that the above value for M5 is a quite robust result for the assumed chemical composition and theoretical framework. In Figure 2, we plot two synthetic HB/upper RGB models for M5, picked at random from the pool of 100 simulations. The plus signs indicate RR Lyrae variables (a strip width of 0.075 in has been assumed). Random scatter has been included following the prescriptions of Robertson (1974), but without any special effort to make the CMD dispersion on the RGB match closely the observed one in Sandquist et al. (1996).
3.2. The Case of Pal 4/Eridanus
To model the HBs of the extreme outer-halo clusters Pal 4 and Eridanus is a significantly more complicated and challenging task than to model that of M5, given the small number of HB stars detected in the HST studies and the total lack of HB stars lying blueward of the red HB.
After trying a few different possibilities, we decided to adopt the following approach. Starting with a mass distribution which, in the mean, would give roughly the same number of stars on the red HB and inside the instability strip, we ran many sets of (twelve) synthetic HB simulations, increasing the mean mass by 0.01 from one set to the next, and holding the mass dispersion (as well as the total number of HB stars—25) fixed (at ) in all cases. The mean mass range covered by our simulations was the following: .
Again, random scatter was added following Robertson (1974). Here, however, we did make an effort to reproduce (approximately) the errors in the HST photometry (Stetson 1999) around the HB level. Upon inspection of each of the plots thus produced, and paying particular attention to their corresponding color distributions in comparison to that shown in Figure 1, we reached the conclusion that the following parameters provide an adequate match to both the Pal 4 and the Eridanus HST CMDs at the HB level:
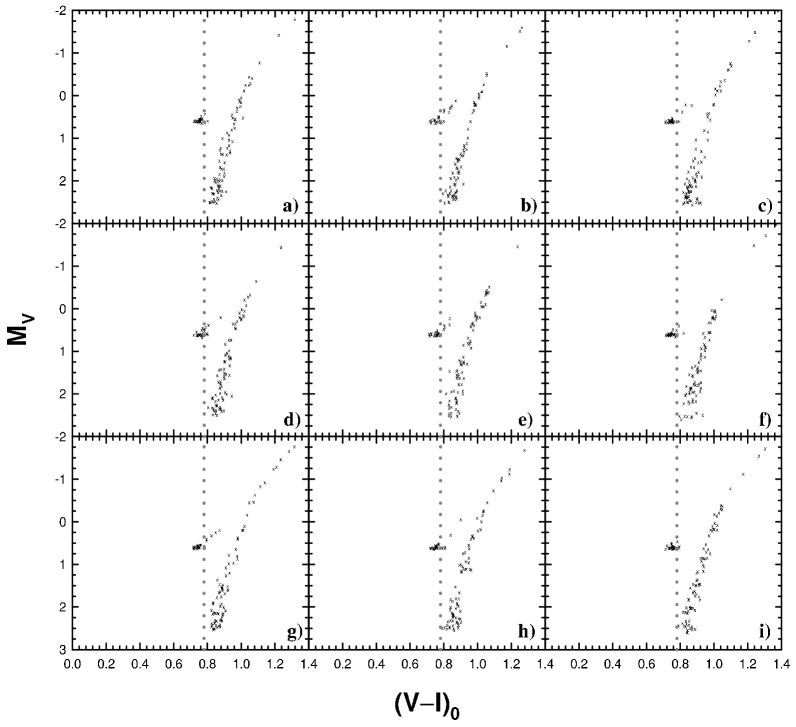
Plots containing the simulations for this case can be found in Figure 3. The vertical dotted lines, as in Figure 1, indicate the color mag. Notice that in some cases even the “bright” red HB stars found (especially) in the Eridanus HST CMD are well reproduced. We interpret these stars as being the result of evolution away from the ZAHB towards the asymptotic giant branch, combined with statistical fluctuations due to the small sample size.
Fig. 2.— Synthetic CMDs for M5 (see text).

![[Uncaptioned image]](/html/astro-ph/9910334/assets/x3.png)
The reddening values from Schlegel et al. (1998) are generally larger than the commonly employed values tabulated by Harris (1996). In the case of Pal 4, one has:
from Schlegel et al. (1998); and
from Harris (1996). In the case of Eridanus, one finds:
from Schlegel et al. (1998); and
from Harris (1996).
The transformation between and was carried out adopting a ratio of between the two (see Stetson et al. 1999). As is apparent, the difference in values between the two sources is smaller in the case of Eridanus.
This uncertainty in the value for Pal 4 may affect the choice of model for the red-HB clusters. The larger reddening from Schlegel et al. (1998) implies an intrinsically bluer HB distribution than what would be inferred from Harris (1996).
Because of possible systematic uncertainties in and in the color transformations, we show, in Figures 4 and 5, synthetic HBs similar to those displayed in Figure 3, but varying by (Fig. 4) and (Fig. 5). The latter case might be considered more appropriate if the canonical reddening value from Harris (1996) were adopted—implying larger relative ages with respect to M5 (see below).
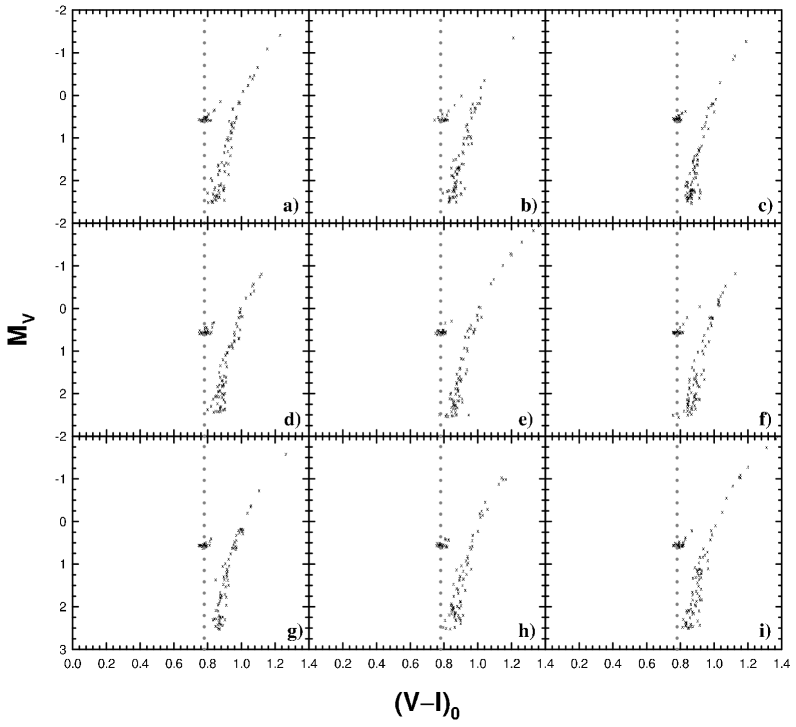
Inspection of Figures 4 and 5 shows that statistical fluctuations can also play a role—though it appears more likely that this would lead to a larger for Pal 4/Eridanus. Indeed, more of the models with larger (Fig. 5) resemble those in Figure 3 in terms of than is the case for models with smaller (Fig. 4). This is because of the decreasing dependence of HB temperature/color on stellar mass towards the red end of the HB. Thus, if important, statistical fluctuations would tend to lead to an underestimate of the age difference between M5 and Pal 4/Eridanus, as derived from HB morphology arguments.
A set of 700 synthetic HB computations shows that changing from to leads to a change in mean HB color equivalent to a reddening error by mag, holding fixed at . Had a larger, “M5-like” value been adopted, we would have been forced to adopt a slightly larger for Pal 4/Eridanus. It is easy to see why: for a given , the low-mass tail of the distributions gets closer and closer to the instability strip region with increasing . This must be compensated for by increasing , also implying a (slightly) larger age difference between Pal 4/Eridanus and M5 than reported in the next sections. However, we have been unable to obtain as satisfactory matches to the HBs of Pal 4/Eridanus using the larger , possibly pointing to a real difference in the mass dispersion among these systems.
4. Estimating Relative Ages from the HB and RGB Models
In order to estimate the relative ages required to produce the relative HB types of M5 and Pal 4/Eridanus, we follow a similar approach as described in previous papers of this series (e.g., Catelan & de Freitas Pacheco 1995). The main difference here is that we shall evaluate the effects of an age-dependent mass loss on the RGB, as implied by the several different analytical formulae discussed in the Appendix, upon the relative ages thus estimated. RGB mass loss is estimated on the basis of the RGB models of VandenBerg et al. (2000) for a chemical composition , . It is important to note that the VandenBerg et al. results for both the RGB and HB phases are in very good agreement with those from A. V. Sweigart (see VandenBerg et al. for a discussion).
From the VandenBerg et al. (2000) models, we first obtained the age–RGB tip mass () relationship for the adopted chemical composition. Then we obtained the age–overall mass loss on the RGB () relationship from the Appendix. The required estimate of values was then accomplished by evaluating, for each given (assumed) age for M5,
| (1) |
where .
Holding the value thus derived fixed, the age that leads to a good fit to the Pal 4/Eridanus HB morphology (as characterized by the mean HB mass value described in the previous section) was easily obtained from the –age and –age relationships. Hill’s (1982) algorithm was used for the interpolations that defined such relationships. The implied age difference between M5 and Pal 4/Eridanus followed immediately from this.
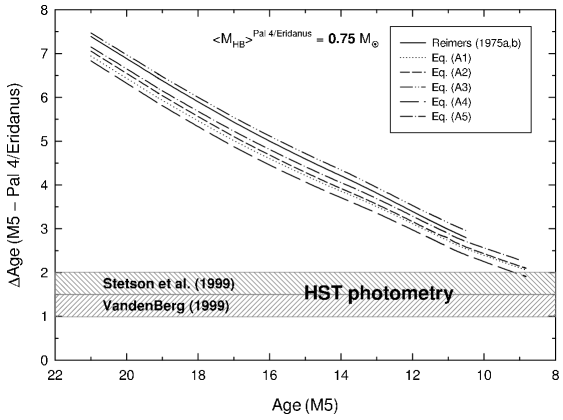
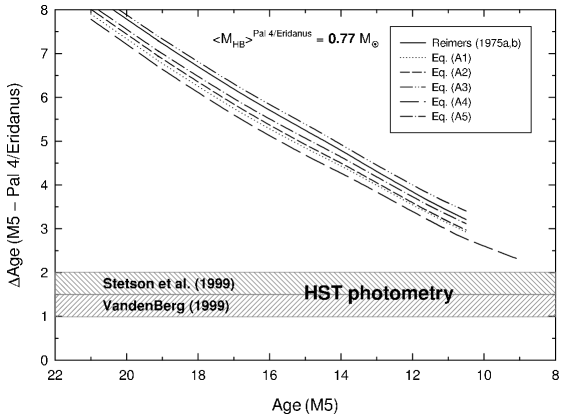
Table 3 shows our derived values and ages for Pal 4/Eridanus for each assumed age for M5 and for each of the mass loss formulae discussed in the Appendix, including Reimers’ (1975a, 1975b) widely adopted one. The inferred age differences are also listed. Figure 6 summarizes our results; the hatched regions indicate the relative ages favored by the HST analyses of Stetson et al. (1999) and VandenBerg (1999a).
From Table 3 and Figure 6, it is clear that only for extremely low ages— Gyr—can one reproduce the relative HB types of M5 and Pal 4/Eridanus in terms of “age as the second parameter,” even by assuming several different possibilities for the form of an age-dependent mass loss formula for giant stars. Equation (A2) is the one which leads to the smaller age differences from HB morphology arguments. Except for equation (A3), Reimers’ (1975a, 1975b) is the one from which the largest relative ages are inferred. Note that only the upper limits on the possible age difference range estimated by Stetson et al. (1999) are reached for M5 ages of about 9 Gyr.222This result is actually somewhat underemphasized by the way we have chosen to present the Stetson et al. (1999) and VandenBerg (1999a) results in Figure 6. The reason for this is that, in these studies, an absolute age of Gyr was adopted, whereas an absolute age Gyr would lead to even smaller relative turnoff ages. In other words, what we show as perfectly horizontal hatched areas in Figure 6 should actually be somewhat slanted, with the relative turnoff ages decreasing with decreasing M5 age—thereby making it even harder for the relative ages derived from HB morphology arguments to match the relative turnoff ages obtained from deep HST photometry, even for very low absolute ages. VandenBerg’s (1999a) results are not reproduced at all; extrapolation of the curves shown in Figure 6 suggests that an M5 age Gyr would be required to match the relative ages derived by VandenBerg.
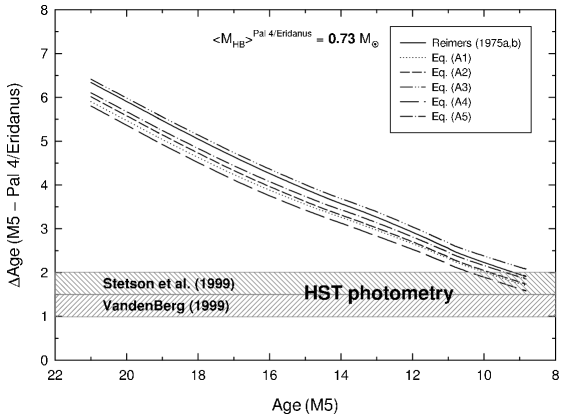
The situation would become somewhat less critical if the synthetic HBs shown in Figure 4 were adopted for Pal 4/Eridanus, as shown in Figure 7. Absolute ages for M5 of Gyr would be required in this case, and it might be possible to achieve agreement with VandenBerg’s (1999a) results for an M5 age of Gyr. However, the opposite holds if the synthetic HBs displayed in Figure 5 are adopted instead, as one can see from Figure 8. We recall, from the arguments in the previous section, that the models in Figure 5 might be the better alternative to those in Figure 3 as genuinely representing Pal 4/Eridanus, if one were to adopt the canonical reddening values from Harris (1996) or if statistical fluctuation effects are important.
In summary, we conclude that the requirement of extremely low ages, Gyr, for all GCs under consideration is a very firm result of the present investigation.
5. Conclusions and Discussion
As far as the second-parameter phenomenon goes, we have demonstrated that age cannot be the only second parameter at play, unless one is willing to accept that the ages of M5-like GCs are less than 10 Gyr.333One should bear in mind that this result depends critically on the accuracy of the HST-WFPC2 data (see, e.g., Stetson 1998 in regard to charge-transfer effects), particularly the photometric zero points. Analysis of this subject is beyond the scope of this paper. The same conclusion was reached in previous papers of this series (Catelan & de Freitas Pacheco 1993, 1994, 1995; see also Ferraro et al. 1997b) but, in the present study, we have fully taken into account the effects of an age-dependent mass loss on the RGB.
If the [/Fe] ratio in Pal 4/Eridanus is lower than commonly found among GCs (Carney 1996), resembling instead the cases of the “young,” loose GCs Ruprecht 106 and Pal 12 (Brown, Wallerstein, & Zucker 1997)—a hypothesis which is perhaps not unlikely, since all these clusters may have partaken a common origin (Majewski 1994; Fusi Pecci et al. 1995; Lynden-Bell & Lynden-Bell 1995)—the “turnoff age difference” between M5 and Pal 4/Eridanus would decrease, as inferred from isochrone fits to the HST data (Stetson et al. 1999). On the other hand, the “HB morphology age difference” would increase significantly, as inferred from the relative HB types of Pal 4/Eridanus vs. M5, because the red HBs of Pal 4/Eridanus would require a further decrease in the ages needed to match their HBs than derived in the present paper, due to their lower overall [M/H].
We note that proper-motion studies indicate that M5 too is an outer-halo GC, which just happens to lie close to its perigalacticon (Cudworth 1997 and references therein). According to such work, M5 actually spends much of its time at galactocentric distances larger than kpc. Therefore, we should keep in mind that, when using M5 to compare its age against those of (other) outer-halo GCs, we may simply be measuring the age dispersion in the outer Galactic halo, and not the age difference between the inner and the (extreme) outer halo—contrary to what is often assumed.
Analytical Mass Loss Formulae Revisited
Mass loss on the RGB is widely recognized as one of the most important ingredients, as far as the HB morphology goes (e.g., Catelan & de Freitas Pacheco 1995; Lee et al. 1994; Rood, Whitney, & D’Cruz 1997). Up to now, investigations of the impact of RGB mass loss upon the HB morphology have mostly relied on Reimers’ (1975a, 1975b) mass loss formula. We note, however, that Reimers’ is by no means the only mass loss formula available for this type of study. In particular, alternative formulae have been presented by Mullan (1978), Goldberg (1979), and Judge & Stencel (1991, hereafter JS91).
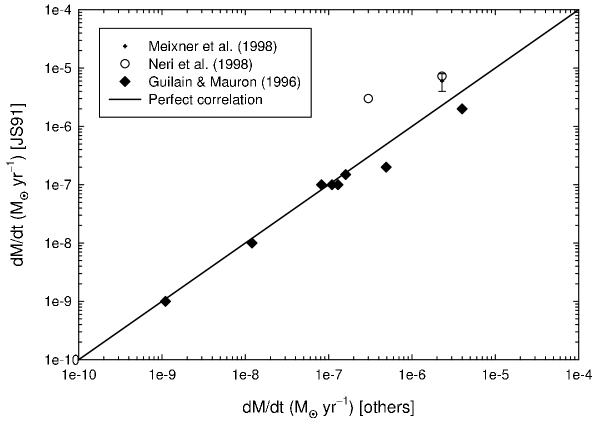
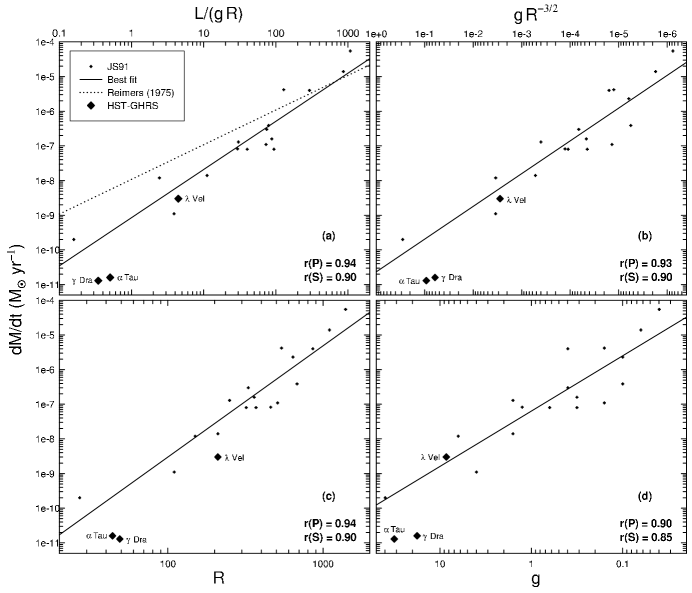
We have undertaken a revision of all these formulae, employing the latest and most extensive dataset available in the literature—namely, that of JS91. The mass loss rates provided in JS91 were compared against more recent data, and excellent agreement was found (Fig. A1). If the distance adopted by JS91 lied more than about away from that based on Hipparcos trigonometric parallaxes, the star was discarded. Only five stars (L2 Pup, U Hya, X Her, g Her, Lyr) turned out to be discrepant, in a sample containing more than 20 giants. Employing ordinary least-squares (OLS) regressions and following the Isobe et al. (1990) guidelines [“if the problem is to predict the value of one variable from the measurement of another, then OLS() should be used, where is the variable to be predicted”] we find that the following formulae provide adequate fits to the data (see also Fig. A2):
| () |
with in cgs units, and and in solar units. As can be seen, this represents a “generalized” form of Reimers’ original mass loss formula, essentially reproducing a later result by Reimers (1987). Formally, the exponent (+1.4) differs from the one in Reimers’ (1975a, 1975b) formula (+1.0) at ;
| () |
likewise, but in the case of Mullan’s (1978) formula;
| () |
idem, Goldberg’s (1979) formula. Interestingly, the exponent (+3.2) is indistinguishable from +3.0 to well within ;
| () |
ibidem, JS91’s formula. In addition, the expression
| () |
suggested to us by D. VandenBerg, also provides a good fit to the data. “Occam’s razor”444 “Entia non multiplicanda praeter necessitatem.” (“Entities must not be multiplied beyond necessity.”) Occam’s Razor is often referred to as the “Principle of Simplicity” or the “Law of Parsimony” as well. would favor equations (A3) or (A4) in comparison with the others, but otherwise we are unable to identify any of them as being obviously superior.
We emphasize that mass loss formulae such as those given above should not be employed in astrophysical applications (stellar evolution, analysis of integrated galactic spectra, etc.) without keeping in mind these exceedingly important limitations:
1. As in Reimers’ (1975a, 1975b) case, equations (A1) through (A5) were derived based on Population I stars. Hence they too are not well established for low-metallicity stars. Moreover, there are only two first-ascent giants ( Boo and Peg) in the adopted sample;
2. Quoting Reimers (1977), “besides the basic [stellar] parameters the mass-loss process is probably also influenced by the angular momentum, magnetic fields and close companions. The order of magnitude of such effects is completely unclear. Obviously, many observations will be necessary before we get a more detailed picture of stellar winds in red giants” (emphasis added). See also Dupree & Reimers (1987);
3. Similarly, Reimers (1975a) has pointed out that such mass loss relations “should be considered as interpolation formulae only and not as strictly valid. Deviations due to various other properties can be expected and must be left to future research”;
4. “One should always bear in mind that a simple formula like that proposed can be expected to yield only correct order-of-magnitude results if extrapolated to the short-lived evolutionary phases near the tips of the giant branches” (Kudritzki & Reimers 1978);
5. Intrinsic scatter among mass loss rates on the RGB is expected to be present (e.g., Dupree & Reimers 1987; Rood et al. 1997; and references therein). The origin of such scatter, inferred from the CMDs of GCs (e.g., Rood 1973; Renzini & Fusi Pecci 1988), is currently unknown;
6. According to Willson (1999), “correlations between observed mass loss rates and physical parameters of cool stars may be (and usually are) dominated by selection effects. Most observations have been interpreted using models that are relatively simple (stationary, polytropic, spherically symmetric, homogeneous) and thus ‘observed’ mass loss rates or limits may be in error by orders of magnitude in some cases.” She further claims that “Reimers’ relation tells us the properties of stars that are losing mass, and not the mass loss rate that arises from a certain set of stellar parameters. It has been widely misunderstood and widely misused in stellar evolution and stellar population studies”;
7. The two first-ascent giants analyzed by Robinson, Carpenter, & Brown (1998) using HST-GHRS, Tau and Dra, appear to both lie about one order of magnitude below the relations that best fit the JS91 data—two orders of magnitude in fact, if compared to Reimers’ formula (see Fig. A2). The K supergiant Vel, analyzed by the same group (Mullan, Carpenter, & Robinson 1998), appears in much better agreement with the adopted dataset and best fitting relations.
In effect, mass loss on the RGB is an excellent, but virtually untested, second-parameter candidate. It may be connected to GC density, rotational velocities, and abundance anomalies on the RGB. It will be extremely important to study mass loss in first-ascent, low-metallicity giants—in the field and in GCs alike—using the most adequate ground- and space-based facilities available, or expected to become available, in the course of the next decade. Moreover, in order to properly determine how (mean) mass loss behaves as a function of the fundamental physical parameters and metallicity, astrometric missions much more accurate than Hipparcos, such as SIM and GAIA, will certainly be necessary.
In the meantime, we suggest that using several different mass loss formulae constitutes a better approach than relying on a single one.
In this sense, the latest RGB evolutionary tracks by VandenBerg et al. (2000) were employed in an investigation of the amount of mass lost on the RGB and its dependence on age. As in some previous work (e.g., D’Cruz et al. 1996), the effects of mass loss upon RGB evolution were ignored, which is a good approximation except for those stars which lose a considerable fraction of their mass during their evolution up the RGB (e.g., Castellani & Castellani 1993).
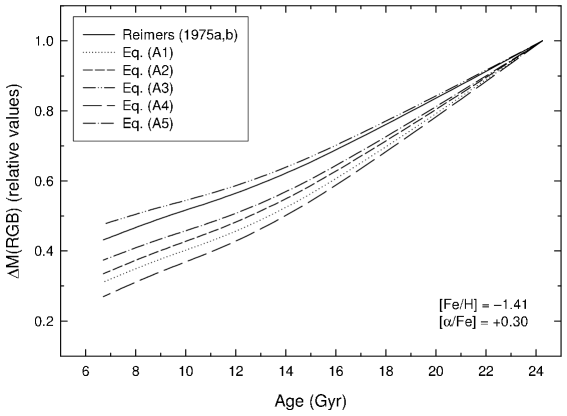
In Figure A3, the mass loss–age relationship is shown for each of equations (A1) through (A5), and also for Reimers’ (1975a, 1975b) formula, for a metallicity , . Note that even though these formulae are all based on the very same dataset (JS91), the implications do differ from case to case.
References
- (1)
- (2) Bolte, M., & Hogan, C. J. 1995, Nature, 376, 399
- (3)
- (4) Borissova, J., Catelan, M., Ferraro, F. R., Spassova, N., Buonanno, R., Iannicola, G., Richtler, T., & Sweigart, A. V. 1999, A&A, 343, 813
- (5)
- (6) Borissova, J., Catelan, M., Spassova, N., & Sweigart, A. V. 1997, AJ, 113, 692
- (7)
- (8) Brown, J. A., Wallerstein, G., & Zucker, D. 1997, AJ, 114, 180
- (9)
- (10) Buonanno, R. 1993, in ASP Conf. Ser. Vol. 48, The Globular Cluster–Galaxy Connection, ed. G. H. Smith & J. P. Brodie (San Francisco: ASP), 131
- (11)
- (12) Buonanno, R., Corsi, C. E., Buzzoni, A., Cacciari, C., Ferraro, F. R., & Fusi Pecci, F. 1994, A&A, 290, 69
- (13)
- (14) Carney, B. W. 1996, PASP, 108, 900
- (15)
- (16) Castellani, M., & Castellani, V. 1993, ApJ, 407, 649
- (17)
- (18) Catelan, M. 1999, in The Galactic Halo: From Globular Clusters to Field Stars, in press (astro-ph/9909345)
- (19)
- (20) Catelan, M., Borissova, J., Sweigart, A. V., & Spassova, N. 1998, ApJ, 494, 265
- (21)
- (22) Catelan, M., & de Freitas Pacheco, J. A. 1993, AJ, 106, 1858
- (23)
- (24) Catelan, M., & de Freitas Pacheco, J. A. 1994, A&A, 289, 394
- (25)
- (26) Catelan, M., & de Freitas Pacheco, J. A. 1995, A&A, 297, 345
- (27)
- (28) Cudworth, K. M. 1997, in ASP Conf. Ser. Vol. 127, Proper Motions and Galactic Astronomy, ed. R. M. Humphreys (San Francisco: ASP), 91
- (29)
- (30) D’Cruz, N. L., Dorman, B., Rood, R. T., & O’Connell, R. 1996, ApJ, 466, 359
- (31)
- (32) Dupree, A. K., & Reimers, D. 1987, in Exploring the Universe with the IUE Satellite, ed. Y. Kondo, W. Wamsteker, A. Boggess, M. Grewing, C. de Jager, A. L. Lane, J. L. Linsky & R. Wilson (Dordrecht: Reidel), 321
- (33)
- (34) Ferraro, F. R. 1998, private communication
- (35)
- (36) Ferraro, F. R., Carretta, E., Corsi, C. E., Fusi Pecci, F., Cacciari, C., Buonanno, R., Paltrinieri, B., & Hamilton, D. 1997a, A&A, 320, 757
- (37)
- (38) Ferraro, F. R., Paltrinieri, B., Fusi Pecci, F., Cacciari, C., Dorman, B., & Rood, R. T. 1997b, ApJ, 484, L175
- (39)
- (40) Fusi Pecci, F., Bellazzini, M., Cacciari, C., & Ferraro, F. R., 1995, AJ, 110, 1664
- (41)
- (42) Fusi Pecci, F., Ferraro, F. R., Bellazzini, M., Djorgovski, S., Piotto, G., & Buonanno, R. 1993, AJ, 105, 1145
- (43)
- (44) Goldberg, L. 1979, QJRAS, 20, 361
- (45)
- (46) Guilain, Ch., & Mauron, N. 1996, A&A, 314, 585
- (47)
- (48) Harris, W. E. 1996, AJ, 112, 1487 (June 22nd, 1999 version)
- (49)
- (50) Harris, W. E., et al. 1997, AJ, 114, 1030
- (51)
- (52) Hill, G. 1982, Publ. Dom. Astrophys. Obs., 16, 67
- (53)
- (54) Isobe, T., Feigelson, E. D., Akritas, M. G., & Babu, G. J. 1990, ApJ, 364, 104
- (55)
- (56) Judge, P. G., & Stencel, R. E. 1991, ApJ, 371, 357 (JS91)
- (57)
- (58) Kudritzki, R. P., & Reimers, D. 1978, A&A, 70, 227
- (59)
- (60) Lee, Y.-W., Demarque, P., & Zinn, R. 1994, ApJ, 423, 248
- (61)
- (62) Lynden-Bell, D., & Lynden-Bell, R. M. 1995, MNRAS, 275, 429
- (63)
- (64) Majewski, S. R. 1994, ApJ, 431, L17
- (65)
- (66) Meixner, M., Campbell, M. T., Welch, W. J., & Likkel, L. 1998, ApJ, 509, 392
- (67)
- (68) Mironov, A. V. 1972, AZh, 49, 134
- (69)
- (70) Mironov, A. V., & Samus, N. N. 1974, Peremennye Zvëzdy, 19, 337
- (71)
- (72) Mullan, D. J. 1978, ApJ, 226, 151
- (73)
- (74) Mullan, D. J., Carpenter, K. G., & Robinson, R. D. 1998, ApJ, 495, 927
- (75)
- (76) Neri, R., Kahane, C., Lucas, R., Bujarrabal, V., & Loup, C. 1999, A&AS, 130, 1
- (77)
- (78) Pont, F., Mayor, M., Turon, C., & VandenBerg, D. A. 1998, A&A, 329, 87
- (79)
- (80) Reimers, D. 1975a, in Problems in Stellar Atmospheres and Envelopes, ed. B. Baschek, W. H. Kegel, & G. Traving (Berlin: Springer-Verlag), 229
- (81)
- (82) Reimers, D. 1975b, in Problèmes D’Hydrodynamique Stellaire, Mémoires de la Societé Royale des Sciences de Liége, 6e serie, tome VIII, 369
- (83)
- (84) Reimers, D. 1977, A&A, 57, 395
- (85)
- (86) Reimers, D. 1987, in IAU Symp. 122, Circumstellar Matter, ed. I. Appenzeller & C. Jordan (Dordrecht: Kluwert), 307
- (87)
- (88) Renzini, A., & Fusi Pecci, F. 1988, ARA&A, 26, 199
- (89)
- (90) Robinson, R. D., Carpenter, K. G., & Brown, A. 1998, ApJ, 503, 396
- (91)
- (92) Rood, R. T. 1973, ApJ, 184, 815
- (93)
- (94) Rood, R. T., Whitney, J., & D’Cruz, N. 1997, in Advances in Stellar Evolution, ed. R. T. Rood & A. Renzini (Cambridge: Cambridge University Press), 74
- (95)
- (96) Robertson, J. W. 1974, ApJ, 191, 67
- (97)
- (98) Salaris, M., Degl’Innocenti, S., & Weiss, A. 1997, ApJ, 479, 665
- (99)
- (100) Sandquist, E. L. 1998, private communication
- (101)
- (102) Sandquist, E. L., Bolte, M., Stetson, P. B., & Hesser, J. E. 1996, ApJ, 470, 910
- (103)
- (104) Schlegel, D. J., Finkbeiner, D. P., & Davis, M. 1998, ApJ, 500, 525
- (105)
- (106) Searle, L., & Zinn, R. 1978, ApJ, 225, 357
- (107)
- (108) Sneden, C., Kraft, R. P., Prosser, C. F., & Langer, G. E. 1992, AJ, 104, 2121
- (109)
- (110) Stetson, P. B. 1998, PASP, 110, 1448
- (111)
- (112) Stetson, P. B. 1999, private communication
- (113)
- (114) Stetson, P. B., et al. 1999, AJ, 117, 247
- (115)
- (116) Stetson, P. B., VandenBerg, D. A., & Bolte, M. 1996, PASP, 108, 560
- (117)
- (118) van den Bergh, S. 1993, ApJ, 411, 178
- (119)
- (120) VandenBerg, D. A. 1999a, ApJ, submitted
- (121)
- (122) VandenBerg, D. A. 1999b, in preparation
- (123)
- (124) VandenBerg, D. A., Bolte, M., & Stetson, P. B. 1996, ARA&A, 34, 461
- (125)
- (126) VandenBerg, D. A., Swenson, F. J., Rogers, F. J., Iglesias, C. A., & Alexander, D. R. 2000, ApJ, 528, in press (Jan. 20th issue)
- (127)
- (128) Willson, L. A. 1999, in Unsolved Problems in Stellar Evolution, ed. M. Livio (Cambridge: Cambridge University Press), 227
- (129)
- (130) Zinn, R. 1980, ApJ, 241, 602
- (131)
- (132) Zinn, R. 1986, in Stellar Populations, ed. C. A. Norman, A. Renzini, & M. Tosi (Cambridge: CUP), 73
- (133)
- (134) Zinn, R. 1993, in ASP Conf. Ser. Vol. 48, The Globular Cluster–Galaxy Connection, ed. G. H. Smith & J. P. Brodie (San Francisco: ASP), 38
- (135)