A 450-day Light Curve of the Radio Afterglow of GRB 970508: Fireball Calorimetry
Abstract
We report on the results of an extensive monitoring campaign of the radio afterglow of GRB 970508, lasting 450 days after the burst. The spectral and temporal radio behavior indicate that the fireball has undergone a transition to sub-relativistic expansion at days. This allows us to perform “calorimetry” of the explosion. The derived total energy, erg is well below the erg inferred under the assumption of spherical symmetry from -ray and early afterglow observations. A natural consequence of this result, which can also account for deviations at days from the spherical relativistic fireball model predictions, is that the fireball was initially a wide-angle jet of opening angle .
Our analysis also allows to determine the energy fractions carried by electrons and magnetic field, and the density of ambient medium surrounding the fireball. We find that during the sub-relativistic expansion electrons and magnetic field are close to equipartition, and that the density of the ambient medium is . The inferred density rules out the possibility that the fireball expands into a strongly non-uniform medium, as would be expected, e.g., in the case of a massive star progenitor.
1 Introduction
The gamma-ray burst (GRB) of May 8, 1997 was a watershed event in the study of these intriguing objects. There were two major advances resulting from afterglow observations of GRB 970508: (1) The first unambiguous evidence that some GRBs are a cosmological population was obtained with the detection of red-shifted metal lines in absorption against the optical afterglow (Metzger et al. 1997). The resulting lower limit on the distance, combined with the measured gamma-ray fluence, established an approximate energy scale for these events. (2) The discovery of the first radio afterglow and the demonstration of relativistic expansion of the fireball (Frail et al. 1997). The latter was made possible by the observations of distinctive variations in the radio flux and attributed to interstellar scintillation (Goodman 1997). It is worth noting that GRBs now join quasars and Galactic micro-quasars as sources for which superluminal motions have been inferred.
The afterglow from GRB 970508 was particularly bright and long-lived. Indeed, to this date, this GRB remains unusual in both these respects. Consequently, astronomers carried out intensive observations of the afterglow across the electromagnetic spectrum. The principal motivation of the observations were to infer the fundamental parameters of the explosion: the total energy of the explosion (), the distribution of the circumburst medium (density, and possible radial dependence as would be the case if the explosion took place in a circumburst medium shaped by mass loss from the progenitor) and the geometry of the afterglow (sphere versus collimated flow or “jets”).
Of all the parameters listed above, is perhaps the most eagerly sought parameter. After all, in a manner similar to supernovae, it is which sets the scale for the entire GRB phenomenon and thus it is a truly fundamental parameter of the explosion. With few exceptions (Katz & Piran 1997, Brainerd 1998) most of the early estimates for (Waxman 1997, Wijers & Galama 1999, Granot et al. 1999) lie within a factor of three of erg. Although their precise methodologies differ, all of these determinations use information gleaned from the early afterglow observations. Unfortunately, the Lorentz factor is large during the early phase and due to relativistic beaming the observer sees only solid angle of the emitting surface. Thus the inferred energy is necessarily the “isotropic equivalent” value. However, if fireballs are jet sources (as appears to be the case), such “isotropic equivalent” estimates are upper limits and in some cases can be gross upper limits (e.g. GRB 990510, Harrison et al. 1999)
Radio observations are essentially immune from the geometry of the fireball and thus offer us the best method to infer since much of the radio afterglow is emitted at later epoch when is falling. Indeed, over the duration of the radio emission, the emitting material typically becomes sub-relativistic. Once the flow becomes sub-relativistic it will in due course also become spherical. Thus observations of radio afterglows allow us the opportunity of inferring without the usual concerns of the geometry of the fireball.
Radio observations offer two additional advantages: (1) At X-ray and optical wavelengths, the afterglow emission rapidly enters the monotonic decaying regime within minutes to hours of the burst. Unfortunately, at the current time, logistical difficulties prevent us from responding so rapidly to GRB events. X-ray and optical afterglow observations are typically initiated hours after the burst. However, at radio wavelengths, the entire afterglow phenomenon is stretched in time. Thus monitoring the radio afterglow observations allows us to see all the important transitions (save the cooling transition) which in turn provides key diagnostics to infer the fundamental parameters of the explosion. (2) Radio observations offer us, via interstellar scintillations, the only way to measure the tiny angular size (few microarcseconds) of GRB afterglows. The measured size in turn allows us to verify the dynamics of the explosion.
In this paper, we present the complete radio light curves from the radio afterglow of GRB 970508 beginning 3.5 hrs after the burst and ending 450 d later when the source was no longer detectable. This is the third and final paper of an ambitious monitoring program that we initiated following the discovery of radio afterglow from GRB 970508. In the first paper (Frail et al. 1997) we reported the discovery of the radio afterglow and the first 90 d of observations, and we interpreted the strong variations as being due to diffractive scintillation. In the second paper (Waxman, Kulkarni & Frail 1998; hereafter, WKF98) we compared these observations to theoretical models and showed that the size estimated from diffractive scintillation was in excellent accord with that expected from hydrodynamical models. In the same paper we noted that the observed flux at late times ( d) was well below that predicted by a spherical model and suggested that this deviation was most likely explained by a jet-like geometry for the fireball rather than a sphere. We suggested that would be significantly lower than the erg isotropic equivalent estimate from the early afterglow observations and the isotropic equivalent -ray energy release and further suggested that the fireball would undergo a transition from relativistic to sub-relativistic expansion at d.
The organization of the paper is as follows. The observations are summarized in §2. In §3 we present the basic results in the form of light curves in three bands, 8.46 GHz, 4.86 GHz and 1.43 GHz. In §4 we note a transition of the variations in the light curve from the diffractive to the refractive regimes. In §5 we compare the data to the expectations from the simple adiabatic fireball model. In §6 we point out important deviations from model predictions and argue that the afterglow was not spherical but was a jet with an opening angle of about 30 degrees. Finally, in §7 we propose a detailed sub-relativistic model which provides a satisfactory explanation to the very late time observations. The transition to non-relativistic regime allows us to carry out proper calorimetry of the explosion (§8).
2 Observations
Except where noted, all observations reported here were obtained at the Very Large Array (VLA) of the National Radio Astronomy Observatory (NRAO).111The NRAO is a facility of the National Science Foundation operated under cooperative agreement by Associated Universities, Inc. The very first observation was made in the 1.4-GHz band, only 3.5 hrs after the initial gamma-ray detection of GRB 970508 (Costa et al. 1997). Table 1 lists each observing session giving the starting date, the time elapsed since the burst, the 1.43 GHz flux density of GRB 970508 (F) and the VLA configuration. The first detection of the source was made on 1997 May 13.96 UT at 8.46 GHz. Except for the first week, it was customary to observe at 8.46 GHz and 4.86 GHz simultaneously, so we include them together in Table 2. All flux density measurements prior to 1997 August were previously compiled in Frail et al. (1997) but are listed here for completeness.
Calibration of the array phase was accomplished using extragalactic radio sources with well-known positions. J0410+769 was used primarily at 1.43 GHz while J0726+791 was the calibrator of choice for 4.86 GHz and 8.46 GHz. Since these compact sources usually vary on time scales of a month or more, the absolute flux scale (accurate to better than 2%) at each epoch for all frequencies was fixed with observations of 3C 48, 3C 147, and/or 3C 286.
The off-line analysis of the VLA data proceeded following standard practice using the AIPS data reduction package. When the radio afterglow from GRB 970508 was clearly detected, its flux density was measured by a Gaussian fitting procedure which solves for the peak and integrated intensity, the source position and its angular size. When the source is weak () and no reliable fit was possible, the peak flux density was measured from the image at the reported position of GRB 970508 (Taylor et al. 1997).
The error estimates in Tables 1 and 2 are based on the thermal noise fluctuations in the final image and are estimated by calculating the rms fluctuations in a region free of any obvious radio sources. In the D-array and to some extent in the CS array, where the resolution at 1.43 GHz is poor, the limiting sensitivity is not due to the receiver noise but to the contribution of unresolved, faint sources within the beam. This quantity varies from point to point in the sky but is of order 80 Jy for a 45′′ beam at 1.4 GHz (Condon et al. 1998). Improperly cleaned sidelobes from the myriad sources in the D-array 1.43 GHz images constitute a further source of confusion. Together these effects can amount to 100 Jy of uncertainty added in quadrature to the error estimates of the D-array measurements given in Table 1.
While the source confusion discussed above is negligible at 4.86 and 8.46 GHz, there is a second source of error in the largest array configurations (A and B) which can also be difficult to quantify. Atmospheric phase instabilities occurring on a time scale shorter than or comparable to the cycle time between calibrator and source will “scatter” flux from GRB 970508 and may introduce slight position offsets. Large and erratic excursions of the calibrator phase over the course of an observing run are a useful diagnostic to indicate when this is occurring. Suspect data is revealed in off-line processing by sudden jumps in the flux density of the phase calibrator from its long-term average and a significant difference between the peak and integrated flux densities in the Gaussian fits of the radio emission from GRB 970508. Following these criteria it was necessary to discard data from only four epochs in 1997 (Sept. 19, Sept. 21, Dec. 23 and Dec. 26).
3 Results: Light Curves and Spectra
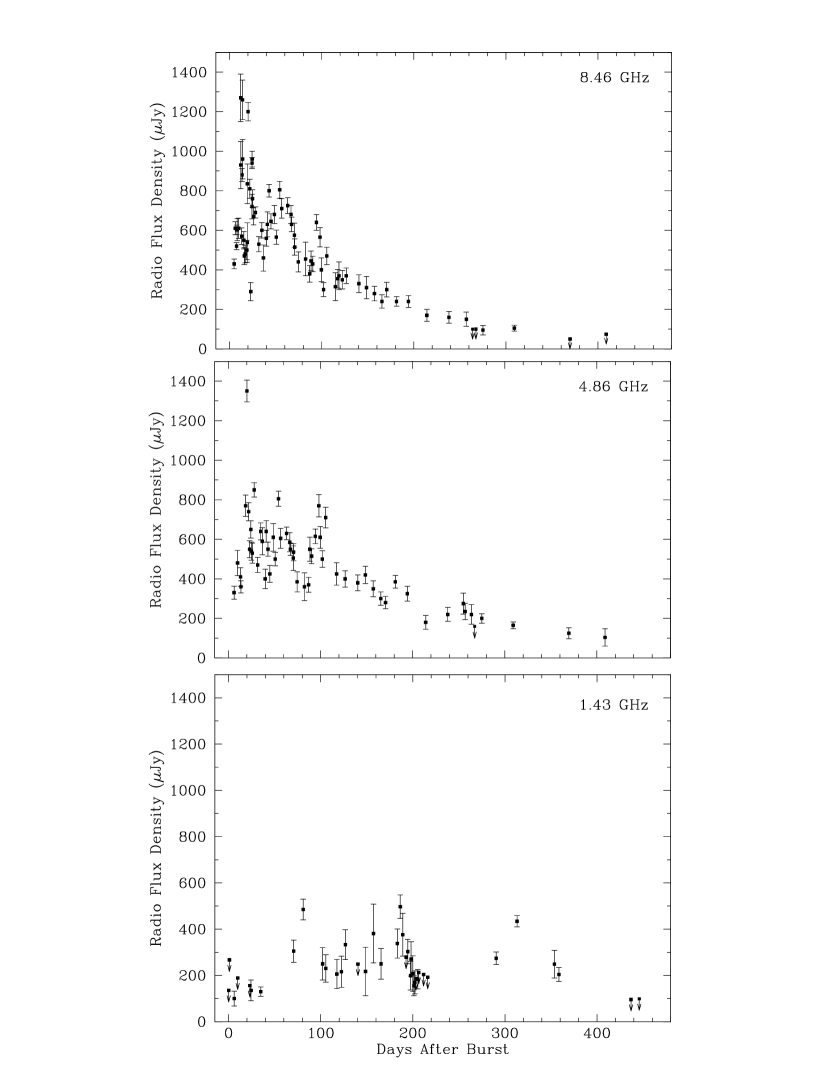
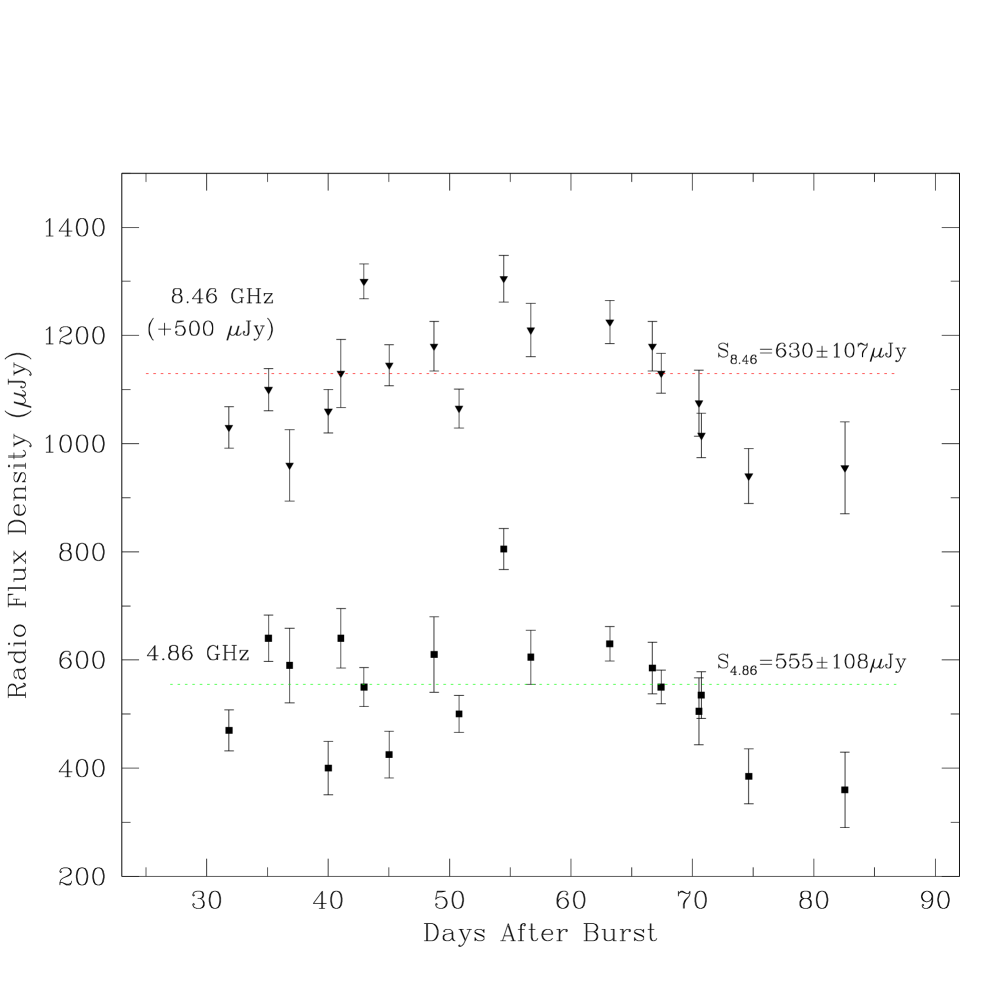
Late-Time Light Curves. In Figure 1 we show the entire light curve of all three frequencies at which GRB 970508 was monitored by the VLA. The behavior of the radio light curves in the first few months has been discussed elsewhere (Frail et al. 1997, WKF98); Galama et al. (1998a, b) and Shepherd et al. (1998) report a few additional points at low and high frequencies as well. For the sake of completeness, we now summarize the early time behavior here. As shown in Figure 2, the erratic flux variations reported in Frail et al. (1997) do not die away entirely after the first month but their character changes. Between 30 d and 85 d the 4.86 GHz and 8.46 GHz light curves have a mean flux density of 555108 Jy and 630107 Jy, respectively. The modulation indices (defined as the ratio of the rms flux variations to the mean) are modest (15–20%) and the variations are well correlated between the two frequencies. This is very different from the narrow bandwidth, short time scale fluctuations seen in the first month and attributed to diffractive interstellar scattering (Frail et al. 1997). We return to this point in §4.
The light curve at 1.43 GHz (Table 1 and Figure 1) is markedly different than the other two. As noted elsewhere (Frail et al. 1997, Shepherd et al. 1998, Galama et al. 1998a) the 1.43 GHz flux density is initially weak (125 Jy). This can best be understood if the source is optically thick at 1.43 GHz (Katz & Piran 1997). Near day 50 the source brightens considerably. Between 50 and 300 days its average flux density is 300 Jy but with considerable scatter. Most of this scatter likely originates from source confusion, particularly in the more compact array configurations (see §2).
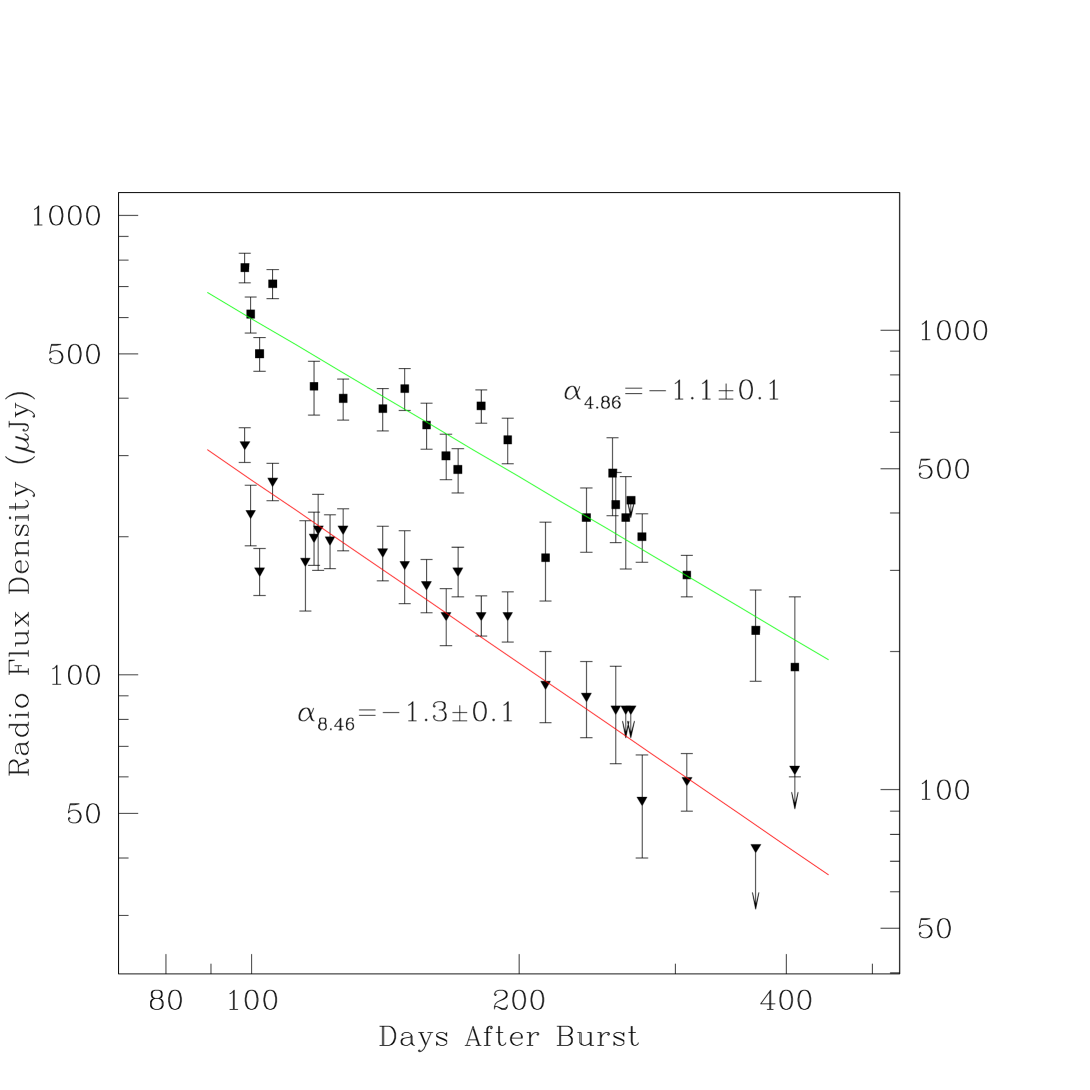
Near day 90 the light curves at 8.46 GHz and 4.86 GHz begin a power-law decay (Figure 3), similar to that which occurred much earlier at optical and X-ray wavelengths (Pian et al. 1998, Piro et al. 1998). Power-law fits to the light curves in Figure 3 for d give values of and (defined as ). The decline at 1.43 GHz is not as well constrained but we estimate from Figure 1 that the decay begin near day 300.
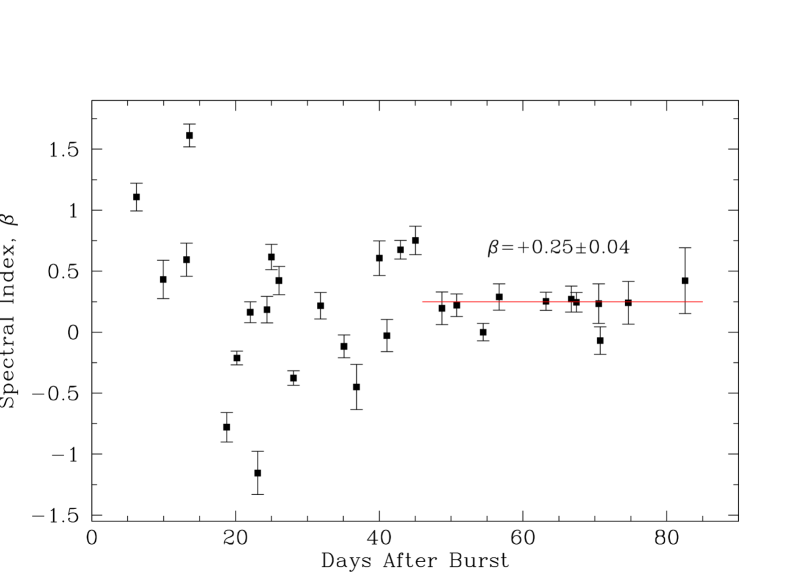
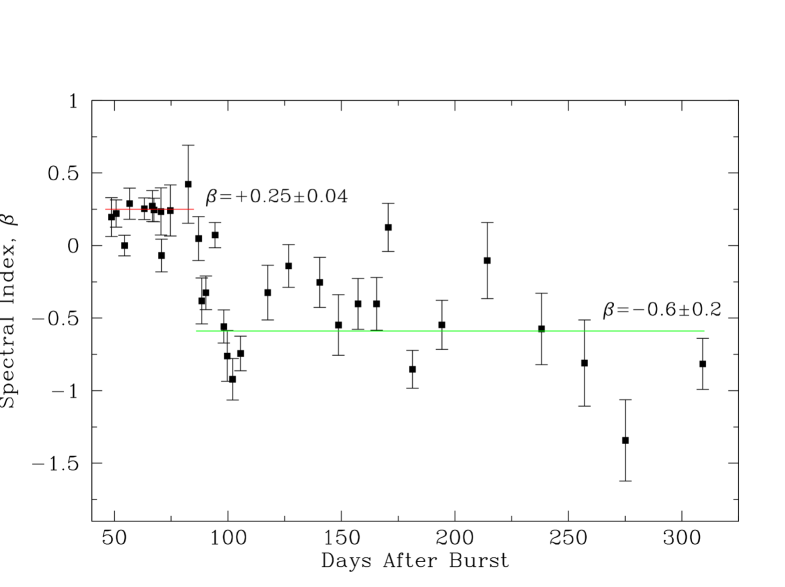
Spectral Index. Many of the features in the high frequency light curves have analogs in the spectral domain. For example, the narrow bandwidth ( GHz) diffractive scintillation seen by Frail et al. (1997) is best demonstrated in Figure 4 by the large swings in the spectral slope (defined as ) between 8.46 GHz and 4.86 GHz. The spectral index appears to settle down by day 35 and we interpret this to mean that the diffractive scintillation has died down. Indeed, this is to be expected since only sources smaller than a critical size can undergo diffractive scintillation. Thus at sufficiently late times, expansion will ensure that the source enters the refractive regime (§4). Since refractive scintillation is broadband (see §4) we see the true radio spectrum of the afterglow past day 35. Excluding two outlier points, the mean for 11 measurements between day 40 and day 85 is +0.250.04 (Figure 4). Galama et al. (1998b) determined near day 12. Since their estimate is based on extrapolations of the radio flux density when the source was scintillating strongly, the value of given here should be a more accurate one.
In addition, the transition of the light curve to a power-law decay has a corresponding change in the spectral index plot of Figure 5, where undergoes an abrupt drop from positive to negative values. The weighted mean from day 95 to day 310 is 0.3. A joint fit to the spectrum and high frequency light curves of the form for days yields more accurate values of and
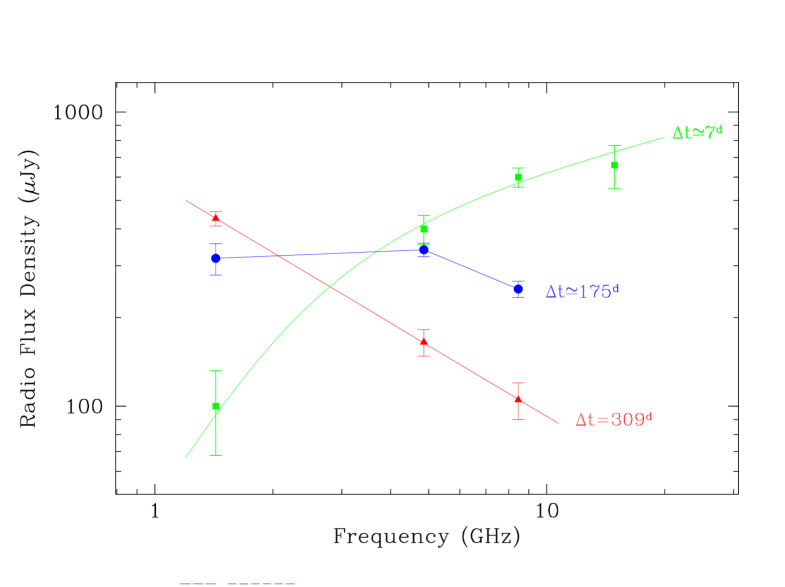
Evolution of the Radio Spectrum. In Figure 6 we follow the evolution of the radio afterglow by plotting all radio frequencies at different time intervals. These spectral “snapshots” show that the spectrum initially rises with frequency, flattens and then finally exhibits a power-law slope which declines with frequency.
4 Refractive Scintillation
In Frail et al. (1997), we attributed the observed strong variability in the 8.46 GHz and 4.86 GHz bands over the course of the first month, to diffractive scintillation. The primary evidence for this inference is the observed strong, rapid (decorrelation time, hr) variability which is uncorrelated at 8.46 GHz and 4.86 GHz. These two characteristics, strong and chromatic variability, are the hallmarks of diffractive scintillation (Rickett 1977). In contrast, beyond day 30 the variations are not only milder but also correlated between the two frequencies (see §3). We attribute these variations to “refractive” scintillation.
Diffractive scintillation is caused by interference between rays diffracted by small-scale irregularities in the ionized interstellar medium. The resulting interference is narrow band and highly variable (with the modulation index approaching unity). Diffractive scintillation occurs only when the source size is smaller than a characteristic size, the so-called “diffractive” angle. Thus as the fireball expands we expect the diffractive scintillation to be quenched. However, as explained by Goodman (1997), focusing and defocusing of the wavefront by large scale inhomogeneities in the ionized interstellar medium will also result in scintillation, albeit at a reduced level on a longer time scale compared to diffractive variations. This “refractive” scintillation, unlike the earlier diffractive scintillation, is broad-band, and, most importantly, is much less sensitive to the size of the source. Thus, not surprisingly, refractive variability has been seen in many sources, whereas only the most compact sources – pulsars and GRB afterglows – show diffractive scintillation.
The light curves in Figure 1 and 2 show that the expected transition from the diffractive to the refractive regime did take place. The flux variations decrease, but do not vanish, after the first month. During this period, the modulation index (defined as the ratio of the rms flux variations to the mean) is more modest (15–20%) compared to the first month when the modulation index was about 80%. The change in the nature of the flux variations is also seen in the spectral index curve (Figure 4). Over the first month, the flux variations were uncorrelated between 4.86 GHz and 8.46 GHz (decorrelation bandwidth, GHz), as best demonstrated by the large swings in the spectral slope whose values varied randomly between to +1.6 from one day to the next (Figure 4). Starting around day 40, converges to a constant value. We identify these slow, broad-band low-amplitude flux variations as being due to refractive scintillation, with the expansion of GRB 970508 taking it through a transition from the diffractive to refractive regimes.
In principle, an independent estimate of the angular size could be determined from the refractive scintillation, but our sampling of the light curve is not sufficient to accurately measure the refractive decorrelation time scale or the modulation index. Nonetheless, as a check for consistency, we now estimate the expected modulation index and refractive time scales and compare the same to the observations. We use the angular size of the fireball inferred from the diffractive scintillations, arcsec at weeks (WKF98), and extrapolate this size forward in time as to obtain a size of arcsec at weeks. From this expected angular size, and using the formulation of Goodman (1997), we infer the refractive time scales to be between 10 and 20 hrs and the modulation indices of order 40% to 25% at these frequencies. These estimates are consistent with our admittedly meager data.
5 Comparison to Theory: A Relativistic Spherical Model
As remarked in §1 the principal motivation for afterglow observations is to deduce the fundamental parameters of the explosion. To this end, we now compare the radio observations with the expectation of the simplest model, the spherical adiabatic model. Other authors have carried out similar analyses but based only on early-time ( d) multi-wavelength observations (Waxman 1997, Wijers & Galama 1999, Granot et al. 1999). They found good agreement with the basic expectation of spherical adiabatic models.
The first predictive afterglow models (Mészáros & Rees 1993, Paczyński & Rhoads 1993, Katz 1994, Mészáros & Rees 1997) actually preceded the discovery of the afterglow emission and have survived with relatively little modification (Sari 1997, Vietri 1997, Waxman 1997, Wijers, Rees & Mészáros 1997). In its most basic form the cosmological fireball model is a spherical blast wave, expanding adiabatically into a homogeneous medium of density . A fixed fraction of the blast wave energy goes into accelerating a power-law distribution of electrons with energy slope (where the number of electrons with Lorentz factor is for ). In the presence of a magnetic field, which itself is a fixed fraction of the energy density of the blast wave, the electrons emit synchrotron radiation. The instantaneous synchrotron spectrum emitted by the electrons consists of four distinct spectral regimes and is given by Sari, Piran & Narayan (1998) for the “slow cooling” case when the radiative cooling time for the majority of electrons with Lorentz factor is large compared to the dynamical time:
| (1) |
There are three transition frequencies: , and . They correspond to (1) the synchrotron self-absorption frequency below which the source becomes optically thick, (2) the peak frequency where the spectrum peaks at a flux density of F and (3) the cooling frequency above which radiative losses steepen the observed spectrum. In time, as the blast wave interacts with the surrounding medium, the shape of the spectrum is preserved but the peak of the spectrum shifts to lower frequencies. The time-dependence of the three transition frequencies for an adiabatically expanding blast wave is given by , , and with for most of the the time over which the afterglow is detectable. In addition, F is expected to remain constant with frequency. Describing the evolution of the radio flux density as F for (i.e. the optically thin regime) we expect to see a slow rise to F as for =+1/3, followed by a power-law decline going as , where and when ; and steepening a further when .
The observations presented in §3 show substantially all of the gross spectral and temporal behavior expected from this basic model. In detail we find the following agreements with the model.
Low Energy Spectral Index. At early times synchrotron self-absorption is clearly detected (Figure 6 and Shepherd et al. 1998) with a synchrotron self-absorption frequency near 3 GHz (Granot et al. 1999). After day 35 when the diffractive interstellar scintillation between 4.86 GHz and 8.46 GHz has quenched, the low energy regime of the synchrotron spectrum (i.e. ) is revealed. The measured slope of +0.250.04 (Figure 5) is close to the predicted asymptotic value of 1/3. This slope is a generic prediction of relativistic shocks which accelerate electrons with a power-law distribution of energies and have sharp cutoffs at low energies (Katz 1994).
Temporal Decay: Indices and Time scales. The decay in the 8.46 GHz and 4.86 GHz light curves (Figure 3) begins near day 90 and can be most easily seen in the spectral index plot of Figure 5, where the spectral slope undergoes an abrupt change from positive to negative values corresponding to the regime . The corresponding light curves have a power-law decay with a temporal slope near , comparable to that inferred from optical and X-ray observations (see Table 4).
As expected, the decay of the light curve for the lower frequency of 1.43 GHz begins much later (Figure 1). We can compare the time scale for the onset of the decay with the predicted dependence for . In Table 3 we give estimates of between 1 and 100 GHz. The from the 86 GHz data of Bremer et al. (1998) would predict that the onset of the power-law decay would start between 50–70 d at 8.46 GHz and between 70–95 d at 4.86 GHz. Similarly, from the 8.46 GHz and 4.86 GHz data we would predict a decay at 1.43 GHz between 200–300 d after the burst. Given the uncertainties in the estimates of this agreement is surprisingly good.
Lack of cooling break. There is no evidence for the existence of an additional cooling break in the light curves or spectra of Figures 3 and 5. In contrast, Galama et al. (1998b,c) have identified passage of the cooling break at higher frequencies, specifically in the optical band around day 1.4. Accepting this result, the expected epoch of cooling break in the 8.46 GHz band is , which is considerably larger than one year; here is the frequency in the optical band, Hz, is the typical radio frequency and d. Thus, the absence of any clear cooling break in our radio light curves is not surprising.
6 Deviations From the Spherical Relativistic Model
In the previous section we found that the spherical adiabatic fireball model provided a satisfactory explanation for the observations at a gross level. However, on closer inspection there are several important differences between the radio afterglow of GRB 970508 and the model predictions. Indeed, on theoretical grounds we expect deviations from the spherical relativistic model due to a transition from relativistic to sub-relativistic regimes and possibly jet geometry (WKF98). We summarize the observed deviations below and offer explanations for them in §7.
Deviation in the Light Curves. As already noted in WKF98, the spherical model which provided an excellent fit to the early time (less than 3 weeks) multi-wavelength data (X-ray, optical and radio), predicted radio emission that was well above the observed value for d; see Figure 1 of WKF98.
Non-constancy of Peak Flux. Another important prediction of the spherical, adiabatic model is the constancy of the peak flux density F with time. While the peak frequency evolves as , the value of F is expected to remain constant as sweeps through the X-ray, optical and radio bands. This assumption underlies all attempts to fit “snap-shot” broad-band spectral distribution of GRB afterglows (e.g. Galama et al. 1998b, Wijers & Galama 1999) and the subsequent derivation of the shock parameters. In Table 3 there is a very clear trend for successive peaks in F to reach lower peak flux densities as moves towards lower frequencies. A least squares fit between 1 and 90 GHz gives F.
Non-constancy of Absorption Frequency. In the simple adiabatic fireball model, provided that the fundamental shock parameters (E0, , and ) do not change, is expected to remain constant until such time as (Waxman 1997, Granot et al. 1999). Near day 50 the 1.43 GHz flux density rises from 125 Jy to 300 Jy (see Figure 1). Such behavior is expected for an expanding optically thick source (see Frail et al. 1997) simply because of the increase in the radiative surface area. However, the spectra in Figure 6 suggest a different interpretation. The initial attenuation at d is well described by synchrotron self-absorption with unity optical depth at =3 GHz (Shepherd et al. 1998, Granot et al. 1999). In time, the spectra in Figure 6 clearly show an evolution from an optically thick to an optically thin source, with shifting to lower frequencies.
Relation between and . The final and perhaps the most significant deviation from the model concerns the measured values for and (where ) of and from the decay of the radio light curve. In Table 4 these values are compared to measurements made at optical wavelengths at different times in the evolution of the light curve. The temporal slope of the optical light steepens from its initial value of (Djorgovski et al. 1997) to (e.g. Zharikov et al. 1998, Garcia et al. 1998, Castro-Tirado et al. 1998, Bloom et al. 1998). Similarly, the spectral slope undergoes an abrupt transition at optical wavelengths between day 1 and day 2 from (Djorgovski et al. 1997) to (Galama et al. 1998c, Sokolov et al. 1998). Galama et al (1998b) have made a strong case that this spectral and temporal break corresponded to the passage of the cooling break through the optical passbands at roughly 1.4 d after the burst. Prior to the passage of the relativistic model predicts , followed by a steepening (by 1/2) of giving + 1/2. The measured and on either side of values are consistent with these relationships. Bolstering this claim, Galama et al. (1998a) derived two independent measures of the electron energy power-law index (). In contrast, in the framework of the relativistic adiabatic model, no single value of can explain the values of and that we obtained from our radio observations. The radio is identical to the late-time optical value but the radio is more similar to the early optical estimates before moved through the optical band.
7 Jets and the Transition to the Sub-relativistic Regime
The relativistic spherical model is the simplest afterglow model and as such has received considerable attention from observers. Apart from the assumptions of constant , and acceleration to a power law spectrum, the main assumptions of the model are spherical geometry and relativistic outflow. Hints of deviations from the expectations of the spherical model were already apparent in the WKF98 paper (see 1).
In this section, we first qualitatively expand on these two ideas and find that the four problems identified in the previous section can be satisfactorily explained by a model incorporating jets. An inevitable consequence of a jet geometry is early (compared to spherical geometry) transition to the non-relativistic regime. We develop and present in Appendix A a formulation describing non-relativistic fireballs, and then apply this formulation to the light curves (Figure 1) and extract the basic parameters of the explosion in §8.
Deficit of Flux and Lack of Constancy of : Jets. A jet with an opening angle of behaves as if it were a conical section of a spherical fireball, and cannot be distinguished by a distant observer from a spherical fireball, as long as the expansion Lorentz factor is larger than the inverse of the opening angle, . Once the jet decelerates to , it expands sideways, leading to a decrease in blast wave energy per unit solid angle, which results in a deviation from spherical fireball behavior. The decrease in energy per unit solid angle leads to a decrease with time of , and suppresses the flux increase expected in the spherical model at frequencies . Thus a jet geometry provides a reasonable explanation for the flattening of the radio light curves and the lack of constancy of (§6).
We set , the epoch when the jet becomes apparent to the observer, as 25 d (see Figure 1 of WKF98; also discussion in §6). The Lorentz factor corresponding to this epoch is , or equivalent to a jet opening angle . It was shown in WKF98 that on a time scale of , where is the time at which the jet decelerates to , the fireball approaches spherical, sub-relativistic expansion. A simple argument to understand this is as follows. The time at which we see deviation from spherical symmetry is , where is the radius at which . The transition to spherical symmetry occurs over time scale , i.e. . In addition, since the mass enclosed within a sphere of radius , , is comparable to the total jet energy , where is the energy inferred under the assumption of spherical symmetry, the fireball becomes sub-relativistic as it approaches spherical symmetry. Using our 25 d and 2 we expect the fireball to approach spherical sub-relativistic expansion on a time scale of 100 d.
Relation between and : Sub-relativistic Fireball. As discussed in Appendix A, in the sub-relativistic regime, the afterglow emission scales as with and (compared to for relativistic expansion). The behavior of the radio flux observed at d is consistent with this expectation since past day 100 (approximately the transition to sub-relativistic regime) we obtain and (§3). If the afterglow was in the sub-relativistic regime, then we expect the following closure relation, , whereas in the relativistic regime, . We find whereas . Thus we can reject the relativistic model at the 3- level.
More importantly, a single value of =2.2, explains, in a self-consistent way, the X-ray (Piro et al. 1998), optical (Galama et al. 1998b) and radio light (this paper) afterglow observations over several decades in time through radiative transitions (adiabatic to cooling) and dynamical transitions (relativistic to sub-relativistic).
Non-Constancy of . The non-constancy of can be explained as follows. There are two consequences in the sub-relativistic model when falls below occurs (see WKF98 and Appendix A). First, is no longer constant but evolves as . Second, the peak in the spectrum is no longer at but is at . The peak flux then evolves as . By itself, the observed decrease in is consistent with the expectations of the sub-relativistic model. However, since one expects a similar temporal evolution of for in the relativistic model, it should not be taken as strong evidence in favor of the transition to sub-relativistic expansion.
The above conclusions, the manifestation of a jet at d and the sub-relativistic transition at about epoch 100 d have been arrived at using extensive radio data presented in this paper. Independent support for this can be obtained from the optical data. As noted by Rhoads (1999) the optical data cannot be fitted by a single power law decay functional form. Rhoads derives a minimum beaming angle of , a value in complete agreement with our own. The principal strength of the radio result is the photometric uniformity of the data – the data were obtained with one instrument, the VLA, in a standard mode. In contrast, the optical data come from diverse sources and vexing cross-calibration issues still remain.
In our model, we would predict that the optical flux would steepen beyond . A sharp break, such as the one seen in the light curve of GRB 990510 (e.g. Harrison et al. 1999), is not expected in the case of GRB 970508, given the wide opening angle. Numerical and analytical studies which track the dynamical evolution of the beamed ejecta (Moderski, Sikora, & Bulik 1999, Wei & Li 1999) find that unless the opening angle is very small or that lateral expansion is unimportant, a smooth and gradual transition is expected. In addition, past day 100, our model would predict a further, slight steepening [cf. Eq. (A20)] of the optical flux as the shock makes the transition from the relativistic to sub-relativistic regimes. The combination of these two factors is the likely origin for the apparent disappearance of the afterglow at d in a recent HST image (Fruchter et al. 1999).
8 Calorimetry of the Explosion
In Appendix A, we present a rigorous formulation of a sub-relativistic fireball model. In WKF98 we considered sub-relativistic fireball models in the asymptotic limit of being very different from . However, for the data presented here, and are comparable, and the model presented in Appendix A does not rely on asymptotic limits but is an exact model.
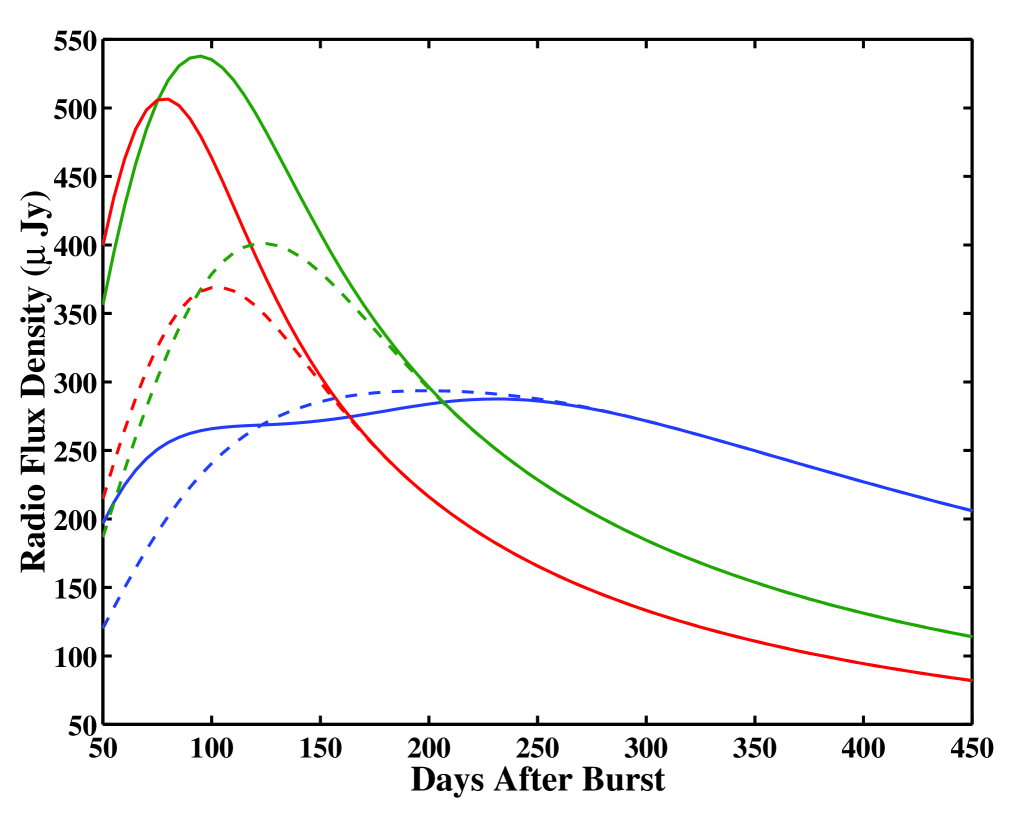
The radio flux and spectrum produced by the sub-relativistic fireball are determined by three parameters, , and (see Appendix A). is at epoch . Here we set d and note that the redshift of the host galaxy of GRB 970508 is (Bloom et al. 1998). The 100 d radio data allow an accurate () determination of the parameters and , which determine the high frequency flux normalization and the self-absorption suppression at 1.43 GHz: , . The spectral change at d (Figure 5) implies that the peak frequency decreases through the frequency range of 8.46 GHz to 4.86 GHz at d, i.e. that GHz. However, it should be noted that since in our model the fireball at time d is in transition to sub-relativistic spherical expansion (see below), significant deviation from the sub-relativistic model prediction is possible at d. Thus, the determination of is only approximate (see Figure 7). Our conclusions remain unchanged, however, even with a factor of a few change in (see below).
The parameters , , and are determined (see appendix A) by the four parameters, which completely specify a sub-relativistic fireball model: the strength of the magnetic field at , the minimum Lorentz factor of the radiating electrons at , the (time independent) number density of the shocked plasma, and the shock radius at . Using the three constraints provided by the determination of , and we first derive , , and as functions of . We then constrain by requiring that the derived minimum energy of the radiating electrons and magnetic field does not exceed the thermal energy of the sub-relativistic fireball, given by the Sedov-von Neumann-Taylor formulation.
Using equation (A11) we find
| (2) |
We use the definitions , , , GHz, and cm. As demonstrated above, observations require , and . for a flat universe with zero cosmological constant and . The minimum Lorentz factor is obtained from equation (A10),
| (3) |
Finally, substitution of the above results into equation (A12) yields,
| (4) |
where ; here is the thickness of the shell of the fireball.
The ratio of electron to magnetic field energy densities is
| (5) |
The minimum combined electron and magnetic field energy, is obtained for a radius , where the equipartition radius is the radius for which . Using the above equations we obtain
| (6) |
and
| (7) |
During sub-relativistic expansion, the fireball hydrodynamics is described by the self-similar Sedov-von Neumann-Taylor solution. We now compare the equipartition energy with the energy of a Sedov-von Neumann-Taylor shock which reaches radius at time . This energy is given through the relation
| (8) |
Here is the ambient medium density, is the adiabatic index of the gas and is close to unity for in the range of (relativistic fluid) and (non relativistic fluid). In what follows we use , appropriate for pressure equilibrium between relativistic electrons and non relativistic protons, for which . Using the above equations we have
| (9) |
At we find that the Sedov-Taylor energy is about twice the minimum electron and magnetic field energy required to account for the radio emission, .
The thermal energy in a Sedov-Taylor solution constitutes approximately half the total energy. The energy in the shocked electrons and in magnetic field clearly cannot exceed the thermal energy. Thus, we obtain an additional constraint, . As can be seen from the above equations this constraint can only be satisfied with . For larger or smaller , would exceed the shock thermal energy, as , while and .
Thus, although radio observations provide only three constraints on the four model parameters, a self-consistent solution is obtained only for
| (10) |
This implies that electrons and magnetic fields are close to equipartition, that the fireball energy is
| (11) |
and that the ambient density is
| (12) |
Interstellar scintillations provide a direct and independent confirmation of the derived radius. As noted in WKF98, the observations of scintillation yield a fireball radius, cm at d which compares favorably with that stated in Equation 10. Furthermore, the shock radius derived in Equation (10) implies a shock velocity
| (13) |
Thus, our model predicts relativistic to sub-relativistic transition at d — as was indeed inferred from the d data. We also note that, assuming jet expansion at d, the inferred fireball energy is erg, rather than the isotropic erg, and in excellent agreement with the value obtained using the 100 d data.
9 An Alternate Model
Based on these same radio data, Chevalier & Li (1999a) have proposed a model in which the afterglow is produced by the expansion of a shock into a circumburst medium, shaped by the mass loss history of the massive progenitor star. In this “wind” model, one expects the ambient density to be whereas the density is expected to be constant for an explosion in the typical interstellar medium. There is increasing support for such models, both in direct evidence linking supernovae with gamma-ray bursts (Galama et al. 1998d, Kulkarni et al. 1998), and indirect evidence in the optical and radio light curves of the afterglows (e.g. Bloom et al. 1999, Reichart 1999, Galama et al. 1999, Chevalier & Li 1999b, Frail et al. 1999). We find, however, that a wind model is inconsistent with GRB 970508 data.
Let us first consider the temporal dependence of the optical and radio flux. Of particular importance, is the location and subsequent evolution of the cooling frequency at early times. For an electron power-law index , implied by early afterglow observations (Galama et al. 1998a,b) and used by Chevalier & Li, the flux at frequencies above the peak frequency makes a transition in the wind model from a decline to , as the cooling frequency passes through the band (with ). In contrast, for the same value of , in the constant density model, the cooling frequency decreases in time (as ) and the flux at frequencies above the peak frequency makes a transition in the wind model from a decline to .
Early afterglow observations (Galama et al. 1998b) yield two independent estimates of , the first at Hz at d and another at Hz at d. Chevalier & Li (1999a) have questioned the identification of at d, since the optical light curve prior to this time deviates significantly from light curves of afterglow models which account for d data. However, the existence of dropping through the optical band on time scale of days following the burst can also be inferred from infra-red observations (Pian et al. 1998, Chary et al. 1998) at d. The Galama et al. observations imply that decreased in frequency from 1.4 days to 12.1 days, in clear contradiction with expectations for the wind model. Furthermore, since these observations imply that had passed through the optical bands in the first few weeks, in the wind model both the optical flux (at d) and the radio flux (at d) should decline as . Such behavior is in contradiction with observations, which show a flux decline at both optical and radio frequencies (Note that the optical flux decline in the wind model can be modified to follow a power law by modifying model parameters to give Hz, so as to have below the optical band. However, such choice would be inconsistent with the value of inferred from observations). Moreover, for the energy and density required to account for d observations, erg and , the wind Lorentz factor at d is (the Lorentz factor is only weakly dependent on and , and for the parameter choice of Chevalier & Li ). Thus, the fireball becomes sub-relativistic at d and the flux scaling with time, , which applies for , changes to the sub-relativistic scaling , making the discrepancy with the observed scaling even larger.
Second, let us consider the self-absorption frequency. Our data clearly shows that the flux at 1.43 GHz is self absorbed up to at least d. The time dependence of the self absorption frequency in a wind model, , therefore implies that for this model to fit the late time radio data GHz is required (indeed the self-absorption frequency for the parameters chosen in Chevalier & Li is GHz). This is in marked contradiction with the value inferred from the data, GHz (note that this discrepancy in implies a factor of discrepancy between model and observations in the 1.43 GHz to 8.46 GHz flux ratio).
10 Discussion and Conclusions
In this paper we present the 450-day radio afterglow curve of GRB 970508. This is by far the longest light curve obtained for any GRB. We also present a comprehensive model to explain the entire light curve. In our model, the fireball is a wide-angle jet which gradually expands sideways and becomes a spherical sub-relativistic shell by about day 100. The spherical symmetry of the fireball and the sub-relativistic expansion allow us to carry out calorimetry of the explosion, unhindered by unknown geometry. To our knowledge, this represents the first time that one has been able to carry out absolute calorimetry of a GRB explosion. Below we summarize the salient features of the model and the principal results presented in this paper.
The comprehensive model we present has three regimes: (1) early afterglow, d, (2) jet afterglow, d and (3) spherical sub-relativistic afterglow. Several authors, in addition to us, have modeled the X-ray, optical and radio-afterglow observations of the early afterglow (e.g. Waxman 1997, Wijers & Galama 1999, Granot et al. 1999, WKF98). The modeling yield electron and magnetic field equipartition factors of . Estimates of the total explosion energy depend on the assumed fireball geometry (spherical versus jet). The high Lorentz factor hides the true geometry of the fireball. The inferred isotropic afterglow energy is erg which is comparable to the isotropic -ray energy release of erg.
The spherical model which explains the early afterglow quite nicely over-predicts the observed radio flux by day 25. We had earlier proposed that this discrepancy could be explained by invoking a jet geometry for the fireball (WKF98). To our knowledge this was the first explicit suggestion for a jet in a GRB.
We argue that the jet starts significant sideways expansion at d, and that by day 100, the fireball becomes essentially a spherically symmetric sub-relativistically expanding shell. The primary observational evidence supporting the transition to the sub-relativistic regime is relation between power law temporal and spectral indices, which is inconsistent with relativistic expansion, and consistent with sub-relativistic expansion.
The radio observations presented here of the sub-relativistic phase of fireball expansion are unique. In this phase, the geometry of the fireball is no longer an issue, and the fireball dynamics is described by the well known Sedov-von Neumann-Taylor self-similar solution. Thanks to the extensive radio data (multi-band and long-term monitoring) we are able to deduce three out of the four fundamental parameters of the synchrotron emitting fireball shell: , the magnetic field strengths; , the ambient density; , the radius of the shell; and , the Lorentz factor of the emitting electrons. Leaving the radius as the free parameter we estimate the total energy of the emitting particles (including the energy in magnetic fields). We then use the constraint that this energy must not exceed the thermal energy of the a Sedov-von Neumann-Taylor expanding shell. This constraint then yields the size, and hence the total energy, of the expanding shell.
We find the following: erg and cm-3. Furthermore, we find that the electrons and magnetic field are close to equipartition with . Confidence in this “absolute” calorimetry is obtained when we note that the inferred size of the shell is comparable to that measured from interstellar scintillations (during the early phase). Furthermore, our model for d predicts that the transition to sub-relativistic regime takes place at , as is indeed observed (see above).
Without any doubt, the most important result of this paper is the estimate of the total energy released in the explosion. This energy, erg is well below erg, determined from early afterglow observations and the isotropic -ray energy release of erg. Thus the energy release in GRB 970508 may not be much larger than that in ordinary SNe.
Appendix A A Sub-Relativistic Model
A.1 Model assumptions
Since the fireball expands at a sub-relativistic velocity in our model, we assume to leading order that the radio flux observed at any given time is emitted by a static shell of radiating electrons. We denote the shell radius by . During sub-relativistic expansion, the dynamics of the shell are described by the self-similar Sedov–von Neumann–Taylor solution. The shell radius and its velocity scale with time as
| (A1) |
Here is some (arbitrary) reference time, and the subscripts denote parameter values at . In what follows we use the normalization d. The compressed, shock heated, material behind the shock occupies a thin shell of width , with . We assume that plasma parameters are uniform within the shell.
Electrons are assumed to be shock accelerated to a power-law energy distribution, for . We choose , as required by the high frequency observations. The magnetic field energy density, , and electron energy density, are assumed to constitute fixed (time-independent) fractions of the shock thermal energy density. Under these assumptions, and recalling that the thermal energy density is proportional to , we have
| (A2) |
A.2 Detailed spectrum
The synchrotron power per unit frequency emitted by a single electron of Lorentz factor is given by (Rybicki & Lightman 1979),
| (A3) |
where and are the electron charge and mass, and
| (A4) |
The function describes the synchrotron power spectrum (Rybicki & Lightman 1979), averaged over an isotropic distribution of pitch angles. To obtain the observed flux at a distance one needs to integrate over the the angular distribution of the intensity at the surface of the shell, . For a thin, , uniform shell, this integral is well approximated by
| (A5) |
provided the effective optical depth is chosen as . Here is the synchrotron emissivity, , and is the synchrotron self-absorption coefficient.
For a power-law electron distribution we obtain
| (A6) |
| (A7) |
Here
| (A8) |
the functions
| (A9) |
and the constants
| (A10) |
| (A11) |
| (A12) |
The model spectrum is determined by three parameters, , and . These parameters, in turn, are determined by four model parameters, , , and .
A.3 Simple scalings
We define the self-absorption frequency by . For , i.e. when the self-absorption frequency is much smaller than the characteristic synchrotron radiation frequency of the lowest energy electrons, peaks at . The peak frequency and flux scale as
| (A13) |
and scales as
| (A14) |
The temporal and frequency dependence of is
| (A15) |
where .
For , peaks at frequency . The optical depth at the peak frequency, , satisfies
| (A16) |
For this implies , , and for we have , . In this case,
| (A17) |
and the temporal and frequency dependence of is
| (A18) |
In our analysis we have so far neglected the effects of synchrotron cooling of electrons. Synchrotron cooling is negligible for electrons radiating at radio frequencies, since Hz at d (see §5), but may be important for electrons radiating at higher frequencies. The electron synchrotron cooling time is proportional to , where is the electron Lorentz factor, while the shell expansion time is proportional to . Thus, the Lorentz factor of electrons for which the cooling time is comparable to the expansion time scales as , and the frequency , beyond which electron cooling affects the observed radiation, scales as
| (A19) |
At frequencies higher than , electron cooling steepens the spectrum and
| (A20) |
Note that for , (at ) for both relativistic and sub-relativistic expansion.
References
- (1) Bloom, J. S. et al. 1999, Nature, in press (astro-ph/9905301)
- (2) Bloom, J. S., Djorgovski, S. G., Kulkarni, S. R., & Frail, D. A. 1998, Ap. J. (Letters), 507, L25.
- (3) Brainerd, J. J. 1998, Ap. J. (Letters), 496, L67.
- (4) Bremer, M., Krichbaum, T. P., Galama, T. J., Castro-Tirado, A. J., Frontera, F., van Paradijs, J., Mirabel, I. F., & Costa, E. 1998, A&A, 332, L13.
- (5) Condon, J. J., Cotton, W. D., Greisen, E. W., Yin, Q. F., Perley, R. A., Taylor, G. B., & Broderick, J. J. 1998, AJ, 115, 1693.
- (6) Castro-Tirado, A. J. et al. 1998, Science, 279, 1011.
- (7) Chevalier, R. A. & Li, Z.-Y. 1999a, ApJ submitted (astro-ph/9908272)
- (8) Chevalier, R. A. & Li, Z.-Y. 1999b, Ap. J. (Letters), 520, L29.
- (9) Costa, E. et al. 1997, IAU Circ. No. 6649
- (10) Djorgovski, S. G., et al. 1997, Nature, 387, 876.
- (11) Frail, D. A. et al. 1999, ApJ(Let) submitted
- (12) Frail, D. A., Kulkarni, S. R., Nicastro, L., Feroci, M., & Taylor, G. B. 1997, Nature, 389, 261.
- (13) Fruchter, A. S. et al. 1999, astro-ph/9903236
- (14) Galama, T. J. et al. 1998a, Ap. J. (Letters), 500, 101.
- (15) Galama, T. J., Wijers, R. A. M. J., Bremer, M., Groot, P. J., Strom, R. G., Kouveliotou, C., & van Paradijs, J. 1998b, Ap. J. (Letters), 500, 97.
- (16) Galama, T. J. et al. 1998c, Ap. J. (Letters), 497, L13.
- (17) Galama, T. J. et al. 1998d, Nature, 395, 670.
- (18) Garcia, M. R. et al. 1998, Ap. J. (Letters), 500, 105.
- (19) Goodman J. 1997, New Astro., 2, 449
- (20) Granot, J., Piran, T., & Sari, R. 1999, ApJ in press (Dec 10 issue)
- (21) Harrison, F. A. et al. 1999, Ap. J. (Letters), 523, 121.
- (22) Katz, J. I. 1994, Ap. J. (Letters), 432, 107.
- (23) Katz, J. I., & Piran, T. 1997, Ap. J., 490, 772.
- (24) Mészáros, P. & Rees, M. J. 1993, Ap. J., 405, 278.
- (25) Mészáros, P. & Rees, M. J. 1997, Ap. J., 476, 232.
- (26) Metzger, M. R., Djorgovski, S. G., Kulkarni, S. R., Steidel, C. C., Adelberger, K. L., Frail, D. A., Costa, E., & Frontera, F. 1997, Nature, 387, 879.
- (27) Moderski, R., Sikora, M., & Bulik, T. 1999, astro-ph/9904310
- (28) Paczyński, B. & Rhoads, J. E. 1993, Ap. J. (Letters), 418, L5.
- (29) Pian, E. et al. 1998, Ap. J. (Letters), 492, L103.
- (30) Piro, L. et al. 1998, A&A, 331, L41.
- (31) Pooley, G. & Green, D. 1997, IAU Circ. No. 6670
- (32) Reichart, D. E. 1999, ApJ(Letters) in press (astro-ph/9906079)
- (33) Rhoads, J. E. 1999, A&A Sup. in press (astro-ph/9903400)
- (34) Rickett, R. J. ARAA, 15, 479
- (35) Rybicki, G. B. & Lightman, A. P.: 1979, John Wiley & Sons, New York
- (36) Sari, R. 1997, Ap. J. (Letters), 489, L37.
- (37) Sari, R., Piran, T., & Narayan, R. 1998, Ap. J. (Letters), 497, L17.
- (38) Shepherd, D. S., Frail, D. A., Kulkarni, S. R., & Metzger, M. R. 1998, Ap. J., 497, 859.
- (39) Sokolov, V. V., Kopylov, A. I., Zharikov, S. V., Feroci, M., Nicastro, L., & Palazzi, E. 1998, A&A, 334, 117.
- (40) Taylor, G., Frail, D. A., Beasley, A. J., & Kulkarni, S. R. 1997, Nature, 389, 263.
- (41) Vietri, M. 1997, Ap. J. (Letters), 488, L105.
- (42) Waxman, E. 1997, Ap. J. (Letters), 489, L33.
- (43) Waxman, E., Kulkarni, S. R., & Frail, D. A. 1998, Ap. J., 497, 288.
- (44) Wei, D. M., & Lu, T. 1999, astro-ph/9908273
- (45) Wijers, R. A. M. J., & Galama, T. J. 1999, ApJ, submitted (astro-ph/9805341).
- (46) Wijers, R. A. M. J., Rees, M. J., & Mészáros, P. 1997, M.N.R.A.S., 288, 51.
- (47) Zharikov, S. V., Sokolov, V. V., & Baryshev, Y. V. 1998, A&A, 337, 356.
| Date | F1.4aaWhen no flux density measurement is given it can be assumed that the source was not detected above the 3 level. | Array | ||
|---|---|---|---|---|
| (UT) | (days) | (Jy) | (Jy) | Config.bbThe 27 antennas of the VLA can be placed into one of four “standard” configurations (A, B, C and D) giving a synthesized beamsize (i.e. resolution) of 1.2′′ in A-array and increasing in multiples of 3.3 to the D-array resolution of 44′′. Hybrid arrays such as DnC and CnB have increased resolution in the north-south direction, while the CS array is a special C-array hybrid designed for increased sensitivity to extended emission. |
| 1997 May 9.05 | 0.15 | 45 | B | |
| 1997 May 9.84 | 0.93 | 89 | B | |
| 1997 May 15.09 | 6.19 | 100 | 32 | B |
| 1997 May 18.83 | 9.93 | 63 | B | |
| 1997 Jun. 1.00 | 23.10 | 52 | CnB | |
| 1997 Jun. 2.32 | 24.41 | 135 | 45 | CnB |
| 1997 Jun. 12.83 | 34.93 | 130 | 20 | CnB |
| 1997 Jul. 18.62 | 70.72 | 305 | 48 | C |
| 1997 Jul. 28.94 | 81.03 | 485 | 45 | CS |
| 1997 Aug. 19.02 | 102.11 | 250 | 70 | CS |
| 1997 Aug. 22.52 | 105.62 | 230 | 59 | CS |
| 1997 Sep. 3.47 | 117.56 | 206 | 63 | CS |
| 1997 Sep. 8.42 | 122.51 | 216 | 67 | CS |
| 1997 Sep. 12.68 | 126.78 | 333 | 65 | CS |
| 1997 Sep. 26.35 | 140.45 | 83 | DnC | |
| 1997 Oct. 4.63 | 148.73 | 217 | 105 | DnC |
| 1997 Oct. 13.22 | 157.32 | 381 | 127 | DnC |
| 1997 Oct. 21.39 | 165.48 | 250 | 66 | DnC |
| 1997 Nov. 8.09 | 183.19 | 338 | 63 | D |
| 1997 Nov. 11.33 | 186.42 | 497 | 51 | D |
| 1997 Nov. 13.97 | 189.06 | 376 | 93 | D |
| 1997 Nov. 17.65 | 192.75 | 93 | D | |
| 1997 Nov. 19.46 | 194.55 | 303 | 53 | D |
| 1997 Nov. 22.46 | 197.56 | 199 | 62 | D |
| 1997 Nov. 23.05 | 198.14 | 271 | 74 | D |
| 1997 Nov. 24.96 | 200.05 | 208 | 77 | D |
| 1997 Nov. 26.17 | 201.26 | 155 | 43 | D |
| 1997 Nov. 27.12 | 202.21 | 170 | 50 | D |
| 1997 Nov. 28.40 | 203.50 | 62 | D | |
| 1997 Nov. 30.32 | 205.42 | 184 | 42 | D |
| 1997 Dec. 1.40 | 206.49 | 71 | D | |
| 1997 Dec. 6.65 | 211.75 | 68 | D | |
| 1997 Dec. 11.16 | 216.25 | 64 | D | |
| 1998 Feb. 23.44 | 290.53 | 274 | 27 | A |
| 1998 Mar. 18.06 | 313.16 | 434 | 24 | A |
| 1998 Apr. 27.66 | 353.76 | 249 | 60 | A |
| 1998 May 2.52 | 358.62 | 204 | 30 | A |
| 1998 Jul. 19.78 | 436.89 | 32 | B | |
| 1998 Jul. 28.73 | 445.83 | 33 | B |
| Date | F4.86 | F8.46 | Array | |||
|---|---|---|---|---|---|---|
| (UT) | (days) | (Jy) | (Jy) | (Jy) | (Jy) | Config.aaLetter designations for the array configurations are explained in the table notes of Table 1. A “V” denotes flux density measurements obtained using the VLBA by Taylor et al. (1997). |
| 1997 May 13.96 | 5.06 | 430 | 25 | B | ||
| 1997 May 15.13 | 6.23 | 330 | 33 | 610 | 33 | B |
| 1997 May 16.49 | 7.59 | 520 | 18 | B | ||
| 1997 May 16.79 | 7.89 | 602 | 24 | V | ||
| 1997 May 17.30 | 8.40 | 604 | 56 | V | ||
| 1997 May 18.85 | 9.95 | 480 | 64 | 610 | 51 | B |
| 1997 May 21.00 | 12.10 | 1270 | 120 | V | ||
| 1997 May 21.13 | 12.23 | 930 | 120 | V | ||
| 1997 May 22.10 | 13.20 | 410 | 47 | 570 | 42 | B |
| 1997 May 22.49 | 13.59 | 360 | 31 | 880 | 33 | B |
| 1997 May 23.00 | 14.10 | 1260 | 100 | V | ||
| 1997 May 23.13 | 14.23 | 960 | 100 | V | ||
| 1997 May 24.48 | 15.58 | 550 | 44 | B | ||
| 1997 May 24.96 | 16.06 | 470 | 43 | B | ||
| 1997 May 25.85 | 16.95 | 480 | 45 | B | ||
| 1997 May 27.67 | 18.77 | 770 | 54 | 500 | 49 | B |
| 1997 May 28.10 | 19.20 | 538 | 100 | V | ||
| 1997 May 28.23 | 19.33 | 835 | 100 | V | ||
| 1997 May 29.10 | 20.20 | 1350 | 55 | 1200 | 47 | CnB |
| 1997 May 30.95 | 22.05 | 740 | 46 | 810 | 48 | CnB |
| 1997 May 31.99 | 23.09 | 550 | 43 | 290 | 46 | CnB |
| 1997 Jun. 2.29 | 24.39 | 650 | 44 | 720 | 62 | CnB |
| 1997 Jun. 2.41 | 24.51 | 940 | 27 | CnB | ||
| 1997 Jun. 2.50 | 24.60 | 960 | 40 | V | ||
| 1997 Jun. 2.90 | 25.00 | 540 | 46 | 760 | 45 | CnB |
| 1997 Jun. 3.94 | 26.04 | 530 | 51 | 670 | 43 | CnB |
| 1997 Jun. 5.97 | 28.07 | 850 | 36 | 690 | 28 | CnB |
| 1997 Jun. 9.74 | 31.84 | 470 | 38 | 530 | 38 | CnB |
| 1997 Jun. 12.99 | 35.09 | 640 | 43 | 600 | 39 | CnB |
| 1997 Jun. 14.73 | 36.83 | 590 | 69 | 460 | 66 | CnB |
| 1997 Jun. 17.92 | 40.02 | 400 | 49 | 560 | 40 | CnB |
| 1997 Jun. 18.96 | 41.06 | 640 | 55 | 630 | 63 | CnB |
| 1997 Jun. 20.86 | 42.96 | 550 | 36 | 800 | 32 | CnB |
| 1997 Jun. 22.93 | 45.03 | 425 | 43 | 645 | 38 | CnB |
| 1997 Jun. 26.63 | 48.73 | 610 | 70 | 680 | 46 | CnB |
| 1997 Jun. 28.68 | 50.78 | 500 | 34 | 565 | 36 | C |
| 1997 Jul. 2.36 | 54.46 | 805 | 38 | 805 | 43 | C |
| 1997 Jul. 4.59 | 56.69 | 605 | 50 | 710 | 49 | C |
| 1997 Jul. 11.10 | 63.20 | 630 | 32 | 725 | 40 | C |
| 1997 Jul. 14.61 | 66.71 | 585 | 48 | 680 | 46 | C |
| 1997 Jul. 15.33 | 67.43 | 550 | 31 | 630 | 37 | C |
| 1997 Jul. 18.44 | 70.54 | 505 | 62 | 575 | 61 | C |
| 1997 Jul. 18.64 | 70.74 | 535 | 43 | 515 | 41 | C |
| 1997 Jul. 22.55 | 74.65 | 385 | 51 | 440 | 51 | CS |
| 1997 Jul. 30.46 | 82.56 | 360 | 70 | 455 | 85 | CS |
| 1997 Aug. 4.01 | 87.11 | 370 | 38 | 380 | 42 | CS |
| 1997 Aug. 5.35 | 88.45 | 550 | 61 | 445 | 50 | CS |
| 1997 Aug. 7.23 | 90.33 | 515 | 37 | 430 | 39 | CS |
| 1997 Aug. 11.26 | 94.36 | 615 | 37 | 640 | 40 | CS |
| 1997 Aug. 15.13 | 98.23 | 770 | 57 | 565 | 49 | CS |
| 1997 Aug. 16.62 | 99.72 | 610 | 55 | 400 | 60 | CS |
| 1997 Aug. 18.95 | 102.05 | 500 | 42 | 300 | 35 | CS |
| 1997 Aug. 22.50 | 105.60 | 710 | 52 | 470 | 44 | CS |
| 1997 Aug. 31.82 | 114.92 | 315 | 70 | DnC | ||
| 1997 Sep. 3.45 | 117.55 | 425 | 57 | 355 | 47 | DnC |
| 1997 Sep. 4.71 | 118.81 | 370 | 70 | DnC | ||
| 1997 Sep. 8.40 | 122.50 | 350 | 47 | DnC | ||
| 1997 Sep. 12.64 | 126.74 | 400 | 41 | 370 | 39 | DnC |
| 1997 Sep. 26.36 | 140.46 | 380 | 40 | 330 | 45 | DnC |
| 1997 Oct. 4.62 | 148.72 | 420 | 44 | 310 | 56 | DnC |
| 1997 Oct. 13.23 | 157.33 | 350 | 40 | 280 | 37 | DnC |
| 1997 Oct. 21.40 | 165.50 | 300 | 34 | 240 | 34 | DnC |
| 1997 Oct. 26.56 | 170.66 | 280 | 31 | 300 | 37 | DnC |
| 1997 Nov. 6.19 | 181.29 | 385 | 32 | 240 | 24 | D |
| 1997 Nov. 19.15 | 194.25 | 325 | 37 | 240 | 30 | D |
| 1997 Dec. 9.14 | 214.24 | 180 | 35 | 170 | 30 | D |
| 1998 Jan. 2.08 | 238.18 | 220 | 35 | 160 | 30 | D |
| 1998 Jan. 18.90 | 255.00 | 275 | 53 | D | ||
| 1998 Jan. 20.98 | 257.08 | 235 | 41 | 150 | 36 | D |
| 1998 Jan. 27.77 | 263.87 | 220 | 50 | 50 | D | |
| 1998 Jan. 31.29 | 267.39 | 80 | 50 | D | ||
| 1998 Feb. 8.04 | 275.14 | 200 | 24 | 95 | 24 | A |
| 1998 Mar. 14.09 | 309.19 | 165 | 17 | 105 | 15 | A |
| 1998 May 13.52 | 369.62 | 125 | 28 | 25 | A | |
| 1998 Jun. 21.83 | 408.93 | 104 | 44 | 37 | BnA |
| F | References | |||
|---|---|---|---|---|
| (GHz) | (days) | (Jy) | (Jy) | |
| 86.2 | 10-14 | 1620 | 250 | Bremer et al. (1998) |
| 15.0 | 8-13 | 660 | 110 | Pooley & Green (1997) |
| 8.46 | 90 | 630 | 107 | this paper |
| 4.86 | 90 | 555 | 108 | this paper |
| 1.43 | 310-490 | 300 | 150 | this paper |
| Time | aaThe flux density . | aaThe flux density . | References |
|---|---|---|---|
| Range (days) | |||
| 2-4 | Djorgovski et al. (1997) | ||
| 2-25 | Pian et al. (1998) | ||
| 2-120 | Galama et al. (1998c) | ||
| 2-90 | Sokolov et al. (1998) | ||
| 2-100 | Zharikov et al. (1998) | ||
| 90-300 | this paper |