Search for GRB X-ray afterglows in the ROSAT all-sky survey
Abstract
We describe a search for X-ray afterglows from gamma-ray bursts using the ROSAT all-sky survey (RASS) data. If the emission in the soft X-ray band is significantly less beamed than in the gamma-ray band, we expect to detect many afterglows in the RASS. Our search procedure generated 23 afterglow candidates, where about 4 detections are predicted. However, follow-up spectroscopy of several counterpart candidates strongly suggests a flare star origin of the RASS events in many, if not all, cases. Given the small number of events we conclude that the ROSAT survey data are consistent with comparable beaming angles in the X-ray and gamma-ray bands. This result is perhaps not surprising, given that the data constrain the relative beaming fraction only within a few hours of the burst. However, models predicting a large amount of energy emerging as a nearly isotropic X-ray component of the early afterglow are severely constrained by the ROSAT data. In particular, a so far undetected class of “dirty fireballs” and delayed “rebursts” are constrained.
Key Words.:
Gamma-rays: bursts – X-rays: general — Stars: flare1 Introduction
The discovery of fading X-ray afterglows from gamma-ray bursts (GRBs) with BeppoSAX (Costa et al. 1997; Piro et al. 1998a) allowed the first identification of these enigmatic events outside of the gamma-ray band. The subsequent discoveries of optical and radio afterglows associated with a large fraction of the fading X-ray sources led to the discovery of faint, extended host objects (“galaxies”, although this identification is usually not well established). Spectroscopy resulted in the discovery of absorption lines in the otherwise smooth continua of these optical transients (OTs). The corresponding redshifts settled the previous debate of the GRB distance scale, placing a typical GRB in the cosmological redshift range z = 12. At present, multi-wavelengths observations of GRB afterglows exist for about 20 bursts (see http://www.aip.de/People/JGreiner/grbgen.html for a continuously updated list of GRBs with afterglow emission, and Hartmann 1999 for for a recent review of these exciting developments up to GRB 990123). These distances imply very large energies of the burst as well as their afterglows. Depending on uncertain beaming fractions GRBs require E, which constitutes an unprecedented challenge to theorists. Geometric beaming might be required to alleviate these energy requirements. The integrated afterglow emission (all non- bands) requires a comparable amount of energy (with a large dynamic range in Egrb/Eagl). This fact led to the descriptive term “hypernova” (Paczynski 1998) for GRB afterglows whose light output can easily dominate other explosive phenomena such as novae and supernovae.
Deposition of such huge amounts of energy on a short time scale into a small volume inevitably leads to the development of an opaque electron/positron-photon fireball which quickly accelerates into the relativistic regime (e.g., Meszaros Rees 1997; Piran 1999; Meszaros 1999). The likely presence of baryons quenches immediate gamma-ray emission, because by the time the expanding fireball becomes semi- transparent to it’s internal high energy photons most of the burst energy is transferred to kinetic energy of the baryonic component of the relativistic flow. In order to generate a GRB this energy must be retrieved. This can occur through internal dissipation, which occurs when a central engine drives multiple fireball shells with varying Lorentz factors such that eventually shell-shell collisions lead to internal shocks which dissipate energy via electron synchrotron radiation. Alternatively, a GRB could occur when the relativistic shell(s) interact with an external medium (ISM or matter ejected by the progenitor prior to the burst). Consideration of the observed highly structured GRB lightcurves suggests that the GRB itself is more likely the result of internal shocks (Fenimore et al. 1996, 1999; Sari Piran 1997; Kobayashi, Piran, Sari 1997; but see Dermer Mitman 1999) while the external shocks are thought to be responsible for the smoother afterglow emission (e.g., Piran 1999). However, it is far from clear whether or not the observed X-ray afterglows are exclusively due to external shocks. Some overlap with the prompt emission from internal shocks is conceivable. If afterglow and burst emission are from separate regions one must seriously consider the possibility that prompt -ray and delayed X-ray emission are beamed (if at all) differently. If so, one expects X-ray afterglows to be less beamed than GRBs. This possibility can be tested with independent searches for afterglows in existing X-ray surveys (e.g., Grindlay 1999). Wavelengths bands other than X-rays also offer potential means to constrain differential beaming (Meszaros, Rees, & Wijers 1999) through supernova searches in the optical band (Rhoads 1997), searches for radio through afterglows (Perna & Loeb 1998), or dedicated GRB/OT surveys such as LOTIS (Park et al. 1997), ROTSE (Akerlof et al. 1999), TAROT (Boer et al. 1998), and similar programs under development worldwide.
Although we are far from a complete theoretical understanding of the various emission components of a burst (prompt gamma-ray to optical emission, delayed afterglow emission of power-law form with slope changes at late times (also evidence for beaming), and the appearance of “Supernova emission” at late times) it is a straightforward observational task to check whether or not possibly wavelength-dependent beaming exists. Popular GRB scenarios such as binary coalescence of compact stars (e.g., Janka Ruffert 1996) or collapsars (Woosley 1993; MacFadyen Woosley 1999; Hartmann MacFadyen 1999) predict strongly collimated flows, which should also lead to strongly collimated burst and afterglow emission. If afterglows turn out to be less beamed relative to the GRBs, then we expect to find a higher rate of afterglows than GRBs. We test this possibility with a search for X-ray afterglows that were fortuitously detected during the ROSAT all-sky survey. Preliminary results of this study were reported by Greiner et al. (1999).
2 ROSAT all-sky survey data and expectations for transient afterglow detections
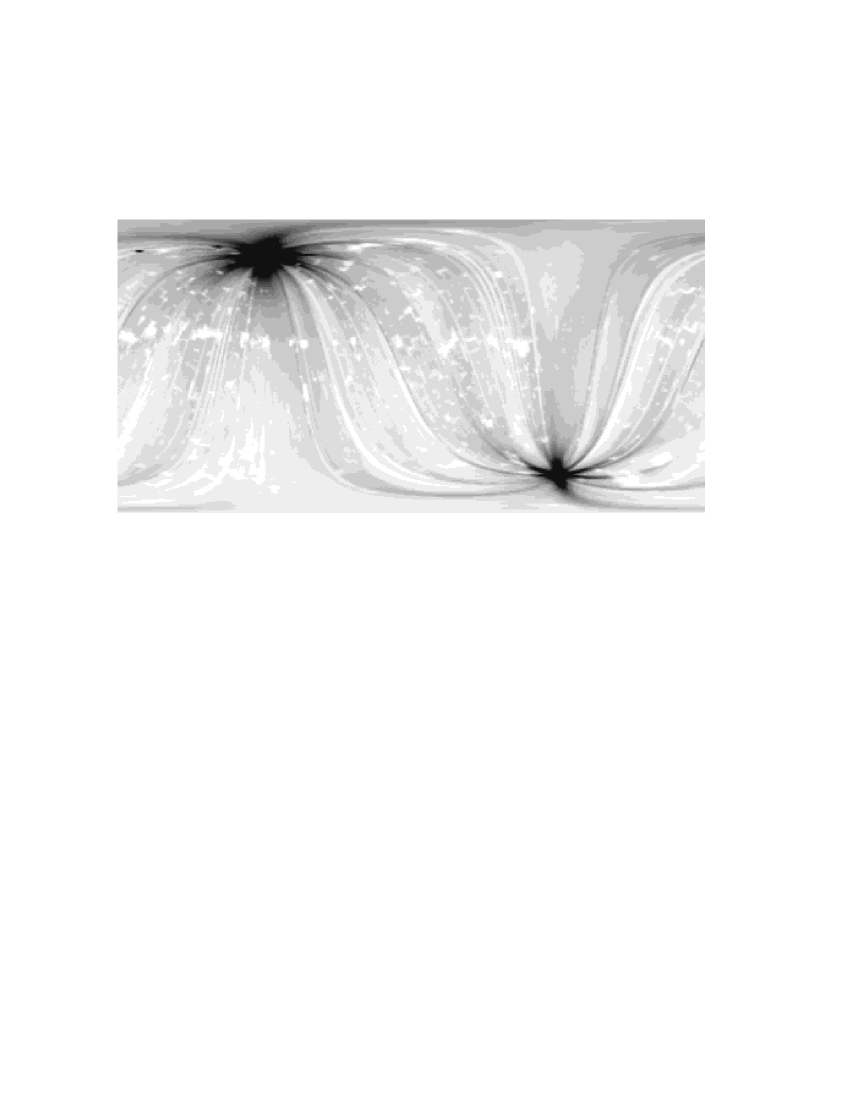
The ROSAT satellite (Trümper 1983) performed the first all-sky survey in the 0.1–2.4 keV X-ray band during 1990 August 1 – 1991 January 25 with short additional exposures (“repairs”) carried out in February (16–18) and August (4–12) of 1991 (Voges, et al. 1999). During the satellite’s orbital period of 96 minutes the telescope (with a field of view diameter of 2°) scans a full 360° circle on the sky. Thus, the exposure (per scan) for a source located inside the scan circle is typically in the range 10–30 sec. Due to orbital plane rotation (together with Earth’s motion) these full circles move with 1°/day perpendicular to the scan direction, covering the whole sky in 6 months. Thus, a source located near the ecliptic equator is covered by the telescope scans during a period of about two days. However, this coverage increases to 180 days at the ecliptic poles. Sky exposure is thus a very sensitive function of ecliptic latitude, with typical exposures of 400 sec near the equator and up to 40 ksec very close to the poles. Figure 1 shows the exposure map of the RASS, but we note that our study relies on the product of exposure in time and coverage in area so that the large exposure at the poles and low equatorial exposure is compensated by the correspondingly small/large solid angles (according to (ecliptic latitude)). The net effect is a rather uniform search pattern.
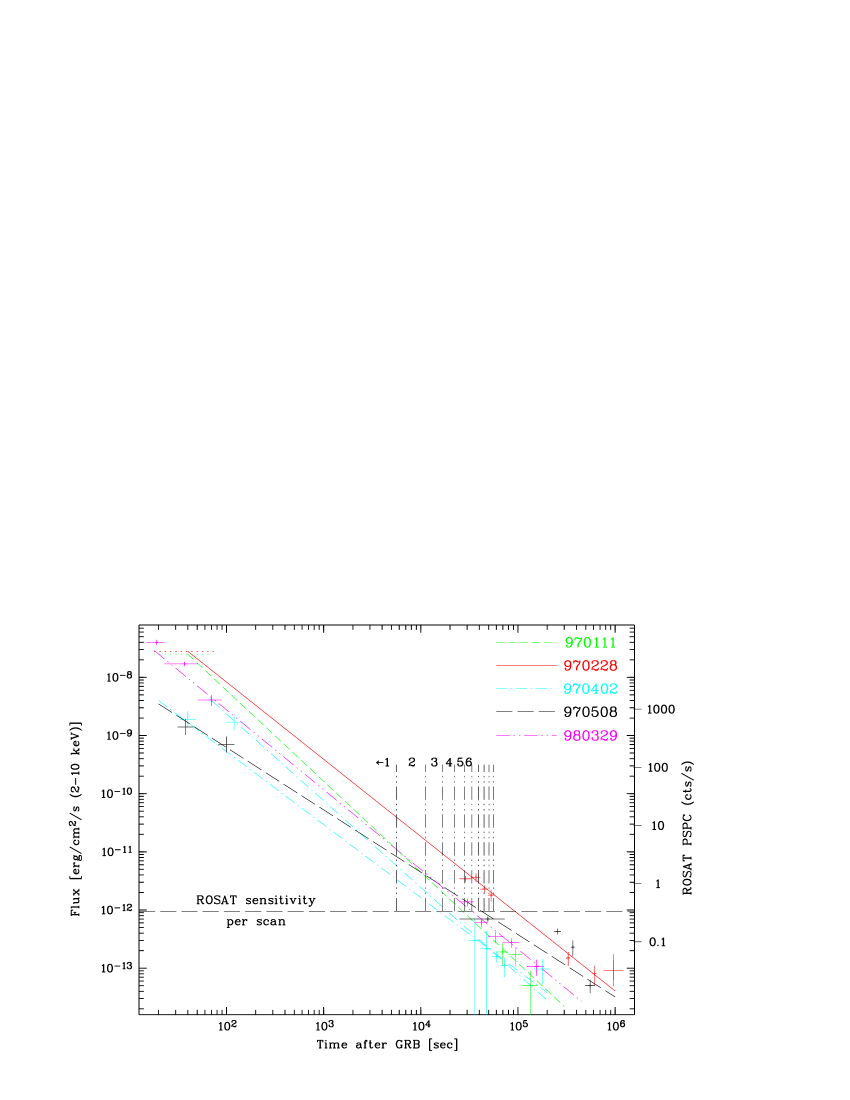
Even with a single exposure of 10–30 s duration the sensitivity of ROSAT in the 0.1–2.4 keV band is sufficient to detect GRB X-ray afterglows for several hours after the burst. Fig. 2 shows this single-scan sensitivity of the ROSAT PSPC in comparison to several recent X-ray afterglow light curves observed by BeppoSAX. The fraction, , of afterglows detectable during the RASS depends critically on three parameters:
The first contributing factor is the fraction of GRBs that have detectable X-ray afterglows. Observations with BeppoSAX indicate that this fraction is rather close to one. In addition, the burst monitor of BeppoSAX appears to sample the full flux or fluence range observed by the BATSE detectors. SAX does not select against faint bursts. However, the trigger algorithm of SAX has in fact introduced a bias towards bursts of long durations (exceeding about one second), so that it is currently impossible to argue about X-ray afterglows from short bursts, which might be due to mergers of neutron star binary systems (e.g., Janka Ruffert 1996). It is conceivable that these events have drastically different X-ray (and other) afterglows with correspondingly different beaming behavior. At this point in time we are not in the position to draw conclusions from the RASS about such events. The proposed SWIFT mission and the forthcoming HETE2 mission might rectify this situation in the near future.
The second relevant factor determining the expected event rate is a possible correlation of X-ray flux to -ray peak flux (or fluence, or some other characteristic aspect of the GRB itself). So far, the observed X-ray afterglow fluxes measured about 100 sec after the GRB are spread within a factor of 10, while the GRB fluxes show a dynamic range in excess of 1000. The fluence range is also much larger. It is thus impossible to accurately predict the properties of the X-ray afterglows based on direct GRB observations. On the other hand, the small dispersion of X-ray afterglows provides some confidence that we can use a mean X-ray afterglow template for the purpose of this study. We are not likely to introduce a strong bias against certain types of X-ray afterglows. However, one should be aware of the possibility of strong selection against rapidly decaying afterglows (see below) and the fact that little information exists on afterglows from short burst (see discussion above). For the purpose of this study we assume that present afterglow data provide a representative sample.
The third factor is the X-ray intensity decay law: SAX observations have firmly established that the typical afterglow is a power law t-α (although bumps and wiggles exist in several bursts) with values of the index ranging from .
| Source Name | Error | cts | ML1 | Texp | CRmax | Scans | S/N2 | VI3 | SP4 | Comments |
|---|---|---|---|---|---|---|---|---|---|---|
| (′′) | (sec) | (cts/s) | ||||||||
| 1RXS J003528.6+603139 | 9 | 30 | 47 | 349 | 1.1 | 17 | 3.2 | 3.6 | sp | |
| 1RXS J004031.1+520906 | 7 | 120 | 373 | 453 | 5.4 | 23 | 9.1 | 23.6 | sp | |
| 1RXS J013556.7+231605 | 16 | 31 | 38 | 441 | 1.7 | 19 | 3.9 | 6.6 | K(?) star (Hamburg) | |
| 1RXS J023644.4+224028 | 10 | 27 | 63 | 247 | 0.9 | 15 | 3.0 | 3.3 | ||
| 1RXS J043412.3–314911 | 8 | 37 | 83 | 258 | 1.3 | 15 | 3.9 | 4.7 | sp | |
| 1RXS J045248.0–324507 | 12 | 17 | 27 | 286 | 1.3 | 17 | 3.5 | 5.5 | sp | |
| 1RXS J050154.6–785616 | 9 | 176 | 357 | 630 | 5.5 | 33 | 8.0 | 14.8 | dMe (RBS) | |
| 1RXS J051515.9+574705 | 10 | 25 | 60 | 406 | 1.0 | 19 | 3.3 | 4.4 | sp | |
| 1RXS J061909.0+083859 | 7 | 25 | 47 | 473 | 3.3 | 25 | 6.7 | 7.7 | sp | M3.5e (spectrum) |
| 1RXS J064118.6–543503 | 23 | 33 | 30 | 651 | 3.6 | 29 | 4.4 | 14.2 | sp | M4.5e (spectrum) |
| 1RXS J081727.0–650718 | 12 | 49 | 28 | 964 | 1.0 | 47 | 3.5 | 5.0 | M5e (spectrum) | |
| 1RXS J093800.6+081640 | 10 | 20 | 39 | 210 | 1.5 | 9 | 3.5 | 4.8 | sp | M3.5e (spectrum) |
| 1RXS J094037.3–565615 | 16 | 24 | 37 | 299 | 1.0 | 19 | 3.1 | 4.5 | ||
| 1RXS J111055.7–485510 | 17 | 38 | 65 | 135 | 2.1 | 5 | 3.9 | 7.4 | ||
| 1RXS J112511.7–002437 | 15 | 41 | 48 | 428 | 2.3 | 23 | 4.1 | 6.2 | M2.5e (spectrum) | |
| 1RXS J113523.0–191321 | 19 | 32 | 37 | 341 | 1.1 | 19 | 3.0 | 3.0 | M4.5e (spectrum) | |
| 1RXS J115928.5–524717 | 11 | 27 | 56 | 266 | 1.0 | 13 | 3.2 | 4.1 | ||
| 1RXS J120328.8+024912 | 19 | 61 | 66 | 404 | 3.6 | 21 | 6.1 | 15.6 | sp | empty on DSS2 |
| 1RXS J144713.2+570205 | 8 | 87 | 132 | 746 | 2.1 | 41 | 4.5 | 6.3 | M star (Hamburg) | |
| 1RXS J163607.8–354353 | 8 | 36 | 36 | 316 | 1.2 | 15 | 3.3 | 3.8 | ||
| 1RXS J163947.8–392023 | 17 | 63 | 99 | 336 | 1.9 | 17 | 3.2 | 2.7 | ||
| 1RXS J210246.3–372149 | 8 | 78 | 225 | 306 | 1.5 | 17 | 3.4 | 3.1 | dMe (RBS) | |
| 1RXS J215651.5–050608 | 33 | 22 | 15 | 263 | 1.6 | 19 | 3.2 | 4.8 | sp |
1 Maximum likelihood of the source detection,
defined as –ln(P), where P is the probability that
the observed distribution of photons originates from
a spurious background fluctuation.
2 The signal-to-noise ratio S/N is defined as the ratio of
maximum count rate minus the mean count rate outside the maximum
over the square root of the quadratic sum of their errors.
3 The variability index VI is defined as the ratio of
maximum count rate minus its error over the mean count rate
outside the maximum plus its error.
4 Light curves displaying only one bin with non-zero count rate
are labeled as “single-peaked” (sp).
It is currently not clear how one should combine all these factors into a proper statistical distribution from which to derive the overall sampling fraction . We thus simply use the existing database as a representative set of templates and compare this set to the ROSAT PSPC sensitivity. For this comparison we estimate the flux in the ROSAT PSPC from an extrapolation of the flux measured by SAX assuming a power law photon spectrum with a universal slope 2. Possible foreground absorption was neglected; the fraction of the full sky for which the effective hydrogen column density is large enough to remove afterglows completely is about 2. The resulting comparison implies that the RASS would in fact be sensitive enough to detect all GRB afterglows in 3 subsequent scans, and 80% in 5 scans (see Fig. 2). We adopt a conservative fraction of for the subsequent analysis.
The above comparison and Fig. 2 show that GRB afterglows have been detectable during the RASS for about 1-5 scans, thus implying that the RASS data sample a GRB afterglow light curve at a time of 1–8 hrs after the GRB. We note that this time span so far is completely unstudied.
The number of detectable X-ray afterglows from GRBs beamed towards us (based on the BATSE detection rate) during the RASS is
where is the rate density of GRBs (bursts per unit time and unit solid angle) and is the RASS afterglow coverage function in units of timearea. We adopt = 900 GRBs/sky/yr 1 GRB/(16628 days). would be 122296.5 days for 100% coverage in time. The temporal completeness of the RASS was 62.5% (Voges et al. 1999), so that = 76435 days. Thus, we expect Nagl = 4.6 3.7 GRB afterglows to be detected during the RASS.
We note here that the coverage function of ROSAT is very different for prompt GRB emission (with duration of seconds) and X-ray afterglows (with duration of hours). would have to be replaced by corresponding to the mean exposure per sky location times the full sky: = 359 , i.e. a factor of 360 lower than . The ROSAT survey is thus too limited for meaningful constraints on beaming patterns in prompt X-ray emission from GRBs. Woods Loeb (1999) used the Ariel V catalog of fast transients (Pye McHardy 1983) to place constraints on beaming during the burst, but concluded that Ariel’s sensitivity is not great enough. While beaming during the GRB is thus the domain of future detectors, constraints on long-duration afterglows can be achieved with existing surveys, such as the RASS.
3 The search for afterglow candidates
3.1 ROSAT X-ray data
We first produced scan-to-scan light curves for all RASS sources with either a count rate larger than 0.05 cts/s or a detection likelihood exceeding 10, resulting in a total of 25,176 light curves. Note that these criteria correspond to a lower sensitivity threshold in comparison to the RASS Bright Source Catalog which used a minimum of 15 counts and a detection likelihood 15 (Voges et al. 1999). Each of these light curves consists of about 20 to 450 bins spaced at 96 min., with each bin corresponding to 10–30 seconds exposure time.
After ignoring 363 light curves with negative mean count rates (caused by incorrect background-subtraction in the automatic procedure) we apply three selection criteria to these light curves:
(1) The maximum bin should have a signal-to-noise ratio of S/N3 above the mean count rate around the maximum. S/N is defined as the difference between the maximum and mean count rate divided by the square root of the quadratic sum of the error of the maximum and mean count rates. Note that this S/N ratio is a measure of the variability amplitude, but not of the significance of the peak or the X-ray source itself (see column 4 of Tab. 1 for this latter significance).
(2) The mean count rate derived from observations obtained until one bin prior to the maximum count rate should be consistent with zero. This criterion allows a transient to rise within the width of one bin (1.5 hrs), but not slower than that.
(3) Similar to condition (2) we demand that the mean count rate at times later than those covered by 5 bins past maximum should also be consistent with zero. Like the previous condition, this requirement suppresses transient sources that have quiescent emission at detectable levels, such as nearby flare stars. In fact, when we do not require this condition a significant set of well known (and new) flare stars appears.
Application of the above listed criteria yields a total of 32 GRB afterglow candidates. We then proceed with additional conditions that proper afterglows should display:
(i) Sources with double and multipeak structures are excluded, simply because this pattern does not fit that of “standard” X-ray afterglows from GRBs (four transients removed).
(ii) Sources with a rise extending over several bins and showing zero flux immediately after the peak (inverse afterglow behavior) are also selected out for obvious reasons (this removes two transient sources).
(iii) We also investigated pointed ROSAT observations, which were available for 3 of the remaining candidates. Two sources were found to be unacceptable candidates because they did exhibit persistent X-ray emission at a level below the RASS threshold.
| Source Name | optical coordinates | rUSNO | (b-r)USNO | Vspectrum | spectral | distance | L |
|---|---|---|---|---|---|---|---|
| (2000.0)(1) | (mag) | (mag) | (mag) | type | (pc) | (1031 erg/s)(2) | |
| 1RXS J004031.1+520906 | 00 40 30.8 +52 09 10 | 15.5 | 2.7 | ||||
| 1RXS J013556.7+231605 | 01 35 58.6 +23 15 58 | 15.2 | 3.1 | K(?) | |||
| 1RXS J023644.4+224028 | 02 36 44.1 +22 40 29 | 13.6 | 3.9 | ||||
| 1RXS J043412.3–314911 | 04 34 11.3 –31 49 13 | 14.2 | 2.5 | ||||
| 1RXS J050154.6–785616 | 05 01 51.9 –78 56 17 | – | – | dMe | |||
| 1RXS J051515.9+574705 | 05 15 15.4 +57 46 59 | 11.0 | 0.9 | ||||
| 1RXS J061909.0+083859 | 06 19 09.0 +08 39 03 | 13.7 | 2.7 | 14.7 | M3.5e | 40 | 1.5 |
| 1RXS J064118.6–543503 | 06 41 17.0 –54 35 18 | 18.4 | 3.4 | 19.2 | M4.5e | 250 | 63.0 |
| 1RXS J081727.0–650718 | 08 17 29.5 –65 07 21 | 16.9 | 2.6 | 17.2 | M5.0e | 70 | 1.8 |
| 1RXS J093800.6+081640 | 09 38 01.1 +08 16 34 | 13.8 | 3.2 | 15.4 | M3.5e | 70 | 1.5 |
| 1RXS J112511.7–002437 | 11 25 12.4 –00 24 38 | 13.3 | 2.8 | 14.3 | M2.5e | 60 | 1.7 |
| 1RXS J113523.0–191321 | 11 35 24.9 –19 13 34 | 15.1 | 3.2 | 16.8 | M4.5e | 90 | 2.0 |
| 1RXS J144713.2+570205 | 14 47 13.5 +57 01 55 | 13.2 | 2.6 | M | |||
| 1RXS J210246.3–372149 | 21 02 46.0 –37 21 51 | – | 1.7 | dMe | |||
| 1RXS J215651.5–050608 | 21 56 51.4 –05 06 30 | 17.5 | 1.5 |
(1) Coordinates have been measured on the DSS2, and thus have
a mean error of 1′′.
(2) The luminosities have been determined in the 0.1–2.4 keV range
under the assumption of a 1 keV thermal bremsstrahlung spectrum.
The bolometric luminosity of such a spectral model is a factor
1.3 larger than that given for the 0.1–2.4 keV range.
(iv) Finally, we correlated the candidate list with various optical, infrared and radio catalogs, and excluded one X-ray source which has a 9th magnitude, seemingly active star (HD 101082) in its error circle.
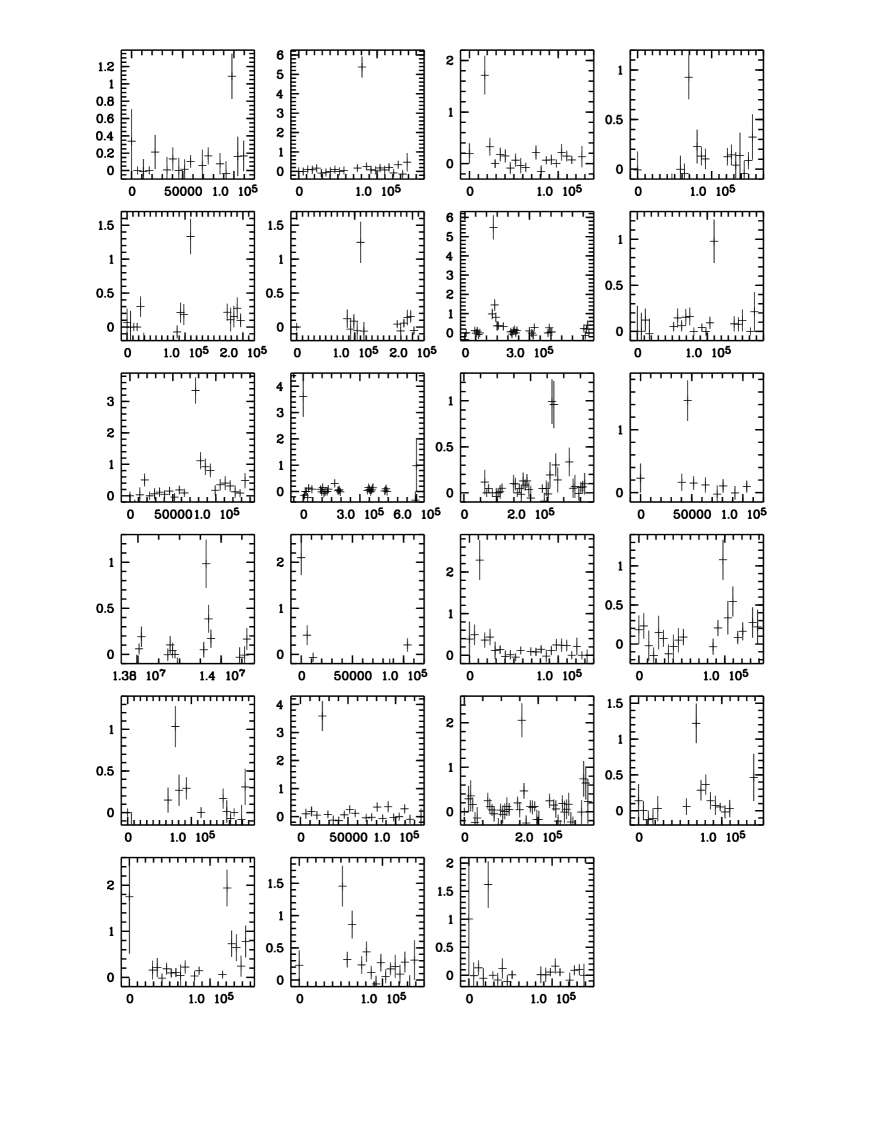
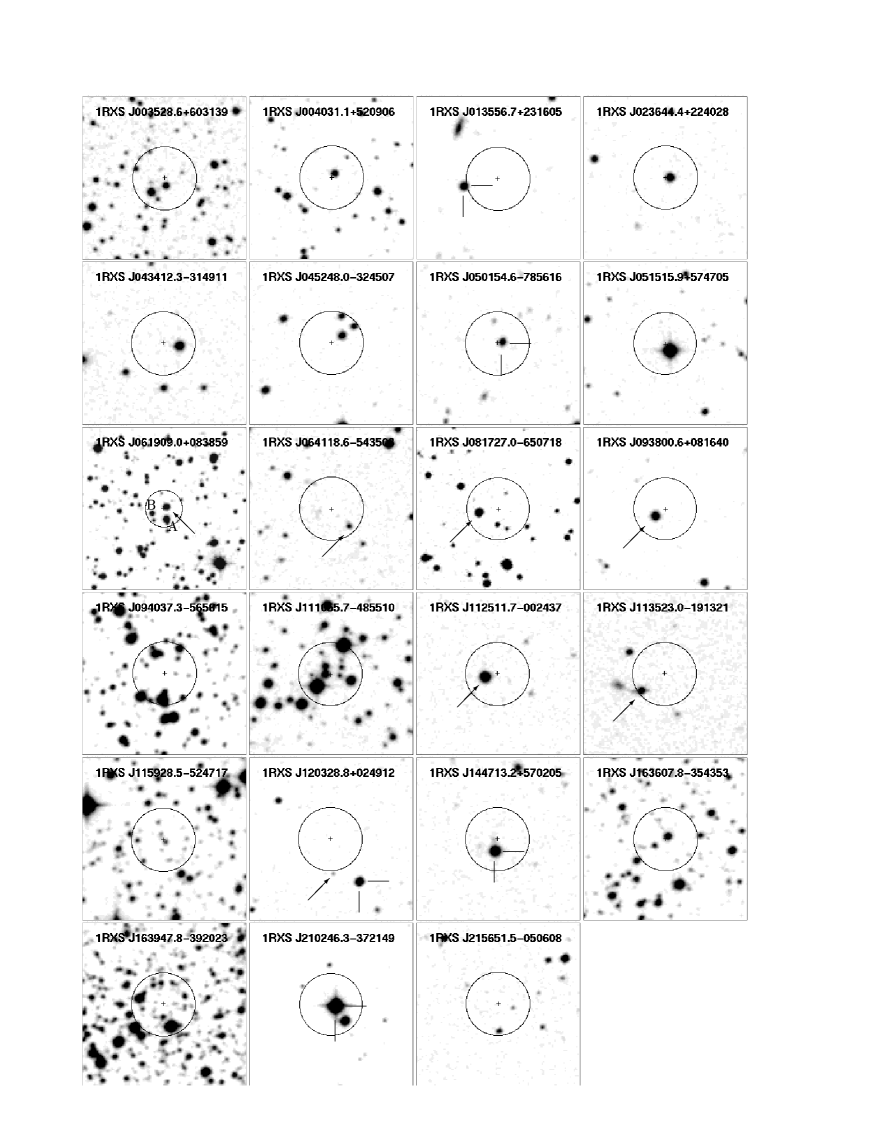
The application of these selection steps yields a total of 23 transients as viable X-ray afterglow candidates. Table 1 summarises the relevant properties of these events including the significance of the sources (column 4), measures of the amplitude and signigicance of the transient behaviour (cols. 8, 9). Figure 4 shows the individual light curves and Figure 5 provides DSS images of the X-ray positions. The interpretation of these data is given in the next section.
Inspection of the candidate list presented in Tab. 1 and Fig. 4 shows that about 50 of these light curves display single peaks, i.e. outbursts with just one bin satisfying S/N3 and otherwise zero count rate. The remainder shows decays that more closely resemble GRB afterglow behavior.
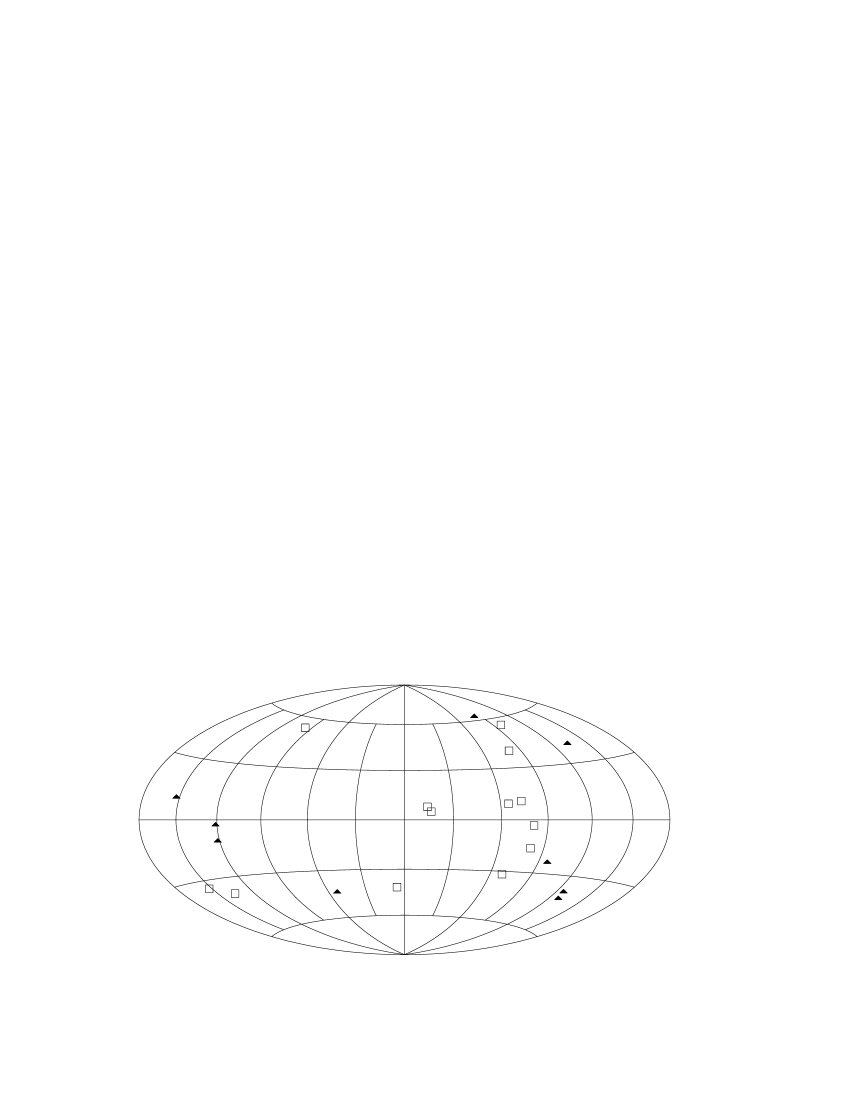
Many of the events in the table (single peak SP, or declining) could be flare stars (the SP sources might also have a significant fraction of statistical fluctuations), but an identification of these events as stellar flares requires optical follow-up studies. The durations of the single bin events are consistent with time scales of flares from late-type stars (10–60 minutes), but even the declining events do not have an unreasonably long duration. Also, the distribution on the sky does not reveal any systematic difference between single peak events and the rest (Fig. 3).
3.2 Optical data
To estimate the flare star fraction of the events listed in Table 1 we obtained optical spectra for six randomly selected bright sources inside the X-ray error circles. Three different telescopes were used to acquire these spectra: the 6m telescope of SAO (December 17, 1998; top panel of Fig. 6), equipped with the spectrograph in the Nasmyth-1 focus, the 3.6m telescope at La Silla/ESO (January 23, 1999; second panel of Fig. 6) equipped with EFOSC, and the Danish 1.5m telescope at La Silla/ESO (January 26, 1999; remaining 4 panels of Fig. 6) equipped with DFOSC. Grisms with 250, 300 and 300 grooves per mm was used yielding a dispersion of 300 Å/mm, 140 and 220 Å/mm, respectively. With a 2′′, 15 and 15 slit the FWHM resolution is 16 Å, 14 Å and 12 Å, respectively. Exposure times range from 600–1200 sec, and the spectra were debiased, flatfielded and calibrated (with the standard star G191B2B or GD 108) using standard MIDAS procedures. Telescope time constraints did not allow us to obtain more spectra than those indicated in Fig. 5.
All six objects which are the brightest objects within the respective X-ray error circle, turn out to be M stars with strong emission lines of the Balmer series (Fig. 6). Given the fact that in five cases these Me stars are the only optical object down to the POSS limit, it is secure to identify the corresponding X-ray sources as being due to X-ray flares from these Me stars. For the sixth object, 1RXS 061909.9+083859, two other bright stars are inside the X-ray error box (denoted “A” and “B” in Fig. 5). Their spectra, however, indicate F/G spectral types, and thus (based on the ratio) argue against one of these being the optical counterpart of the X-ray source. Based on the optical brightness of the six flare stars and the well-known ratio of 1/50…1/100 the expected X-ray intensity during quiescence is 110-14…210-13 erg/cm2/s. This corresponds to ROSAT PSPC count rates of 0.0015…0.03 cts/s and is below the RASS sensitivity, thus consistent with the non-detection outside the X-ray flare.
We have attempted a crude spectral classification of these six Me stars to gain a little more inside into their properties. Following the method initiated by Young & Schneider (1981) and Wade & Horne (1988) and further developed in Schwarz et al. (1998) we used the strength of the TiO bands to determine spectral classes. In particular, we determined the continuum level outside the TiO bands, and then determined the flux deficits in the wavelengths bands 6200–6220 Å, 6760–6810 Å, 7120–7150 Å and 7650–7690 Å. A comparison of various ratios of these flux deficits with that of well-known Gliese stars (Schwarz et al. 1998) results in the spectral types listed in Tab. 2. Given the spectral resolution and the systematic errors in both, the flux calibration of the spectra as well as the correlation of the TiO band ratios to spectral type we estimate the error in our spectral class determination to be 1.
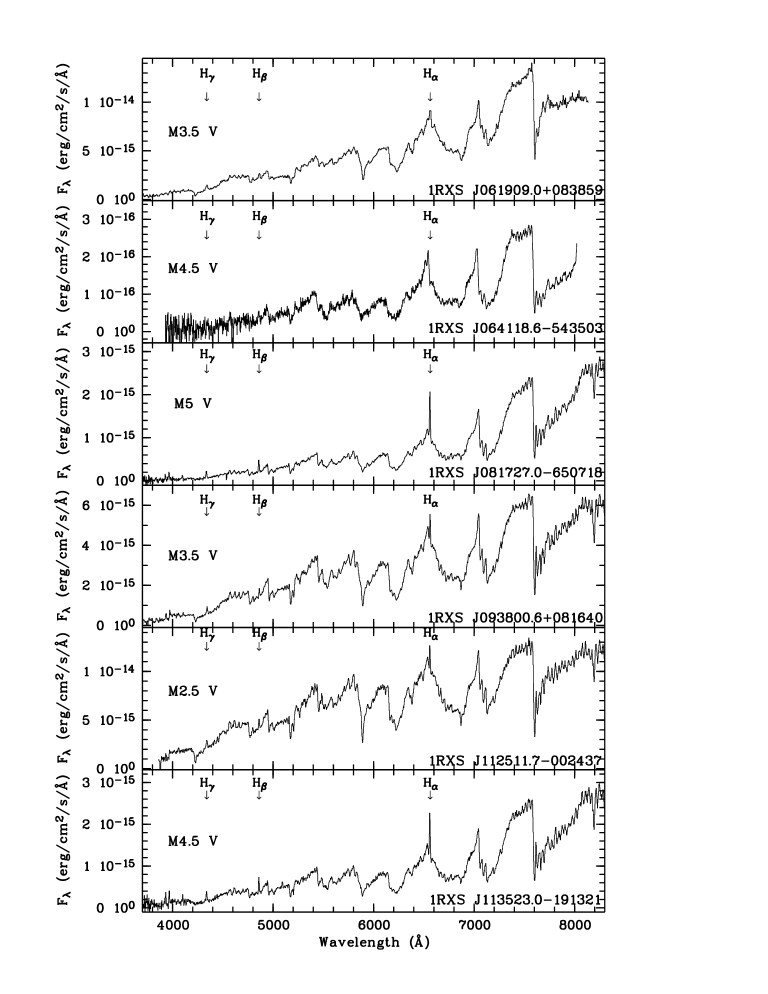
Based on these spectral types and the absolute magnitudes of M stars, and allowing for extinction between 0.1-0.3 mag (corresponding to half the total galactic extinction in the directions of the six Me stars) we have derived a rough distance estimate for each star. Finally, we converted the maximum X-ray count rate during the peak in the light curve (Fig. 4 and Tab. 1) into an X-ray flux under the assumption of a 1 keV thermal bremsstrahlung spectrum and extinction as above. Together with the distances the derived peak X-ray luminosities during the corresponding flare are also given in Tab. 2. These luminosities are typical for flare stars.
In addition we also checked the Hamburg/RASS catalogue of optical identifications (Bade et al. 1998). These identifications are based on a correlation of (an early version of) the ROSAT survey bright source catalog with the data obtained with the Hamburg Schmidt telescope on Calar Alto (Spain) during an objective prism plate survey of the northern hemisphere. Three out of our 23 objects were found in this catalog:
-
•
1RXS J013556.7+231605 RX J0135.9+2316: The bright optical object on the border of the error circle (see Fig. 5) is identified as a star of spectral type K. Due to the spectral resolution of less than 50 Å it seems possible that this star could also be of an early M spectral class, and thus would possibly be a good flare star candidate.
-
•
1RXS J120328.8+024912 RX J1203.4+0249: The bright optical object south-west of the X-ray error circle is identified as a star of spectral type F/G. Therefore, a M flare star origin is excluded, which anyway would have required the assumption of a particularly bad X-ray position (it is located 45′′ off the centroid X-ray position). Together with our optical identification of the faint object just outside the X-ray error circle (being of F to G spectral type also and thus not a possible X-ray source counterpart and thus not shown in Fig. 6) we therefore conclude that the location of 1RXS J120328.8+024912 and its surrounding up to nearly 1 arcmin is empty down to the limit of DSS2.
-
•
1RXS J144713.2+570205 RX J1447.2+5702: The bright and only optical object inside the error circle is identified as a star of spectral type M, suggesting that this could be a flare star as well.
Finally, two sources of our sample were already identified in the RBS programme (Schwope et al. 1999), a complete identification programme of all bright (0.2 cts/s), high-galactic latitude () sources in the RASS.
-
•
1RXS J050154.6–785616: The bright optical star inside the error box is classified as dMe, so again is a flare star.
-
•
1RXS J210246.3–372149: The brighter of the two optical stars is an early M type star with weak H emission, and the fainter one a F/G type star. Thus, the dMe star is the most probable optical counterpart.
Inspection of the DSS finding charts (Fig. 5) suggests that all (but one) source have likely stellar counterparts. There always (except for 1RXS J120328.8+024912) appears to be at least one star in the RASS error box which could be the flare star responsible for the spike detected in the RASS. In addition, all these stars have very red colors as deduced from the USNO A1.0 catalog (Monet et al. 1998; see Tab. 2) supporting the conjecture that these are indeed M stars.
4 Discussion and Conclusions
We thus argue that the bulk of the “afterglows” listed in Table 2 are probably due to X-ray flares from nearby late-type stars. It is of course impossible to rigorously prove this assertion until spectroscopy has been obtained for all counterpart candidates. In the meantime we argue that the existing data support the notion that the RASS contains at most a few X-ray afterglows from GRBs. This interpretation is consistent with the expected number of afterglows (Nagl = 3.7) derived in 2. 1RXS J120328.8+024912 is the best candidate for a GRB X-ray afterglow simply due to the fact that the ROSAT error box does not contain a bright ( mag) stellar object (GRB host galaxies are faint (e.g. Hogg Fruchter 1999), though the light curve is single-peaked. While it is difficult to determine the likelihood that a flare of this large amplitude from a position with no optical counterpart could be due to a statistical fluctuation, we note that this event is among the largest amplitude events of our whole sample (see cols. 8 and 9 in Tab. 1). Also, the significance of the X-ray source itself is huge (col. 4 in Tab. 1).
If we argue that the RASS data contain a few afterglows, then data are obviously consistent with the expected theoretical rate (especially considering the significant uncertainties affecting our estimate of the afterglow expectation value). This implies that GRB afterglows do not have a significantly wider beaming angle in the X-ray band relative to the gamma-ray band. This is to some extent in agreement with predictions of the “standard” fireball model (Meszaros Rees 1997; Piran 1999; Meszaros 1999), given the fact that we are only sampling a few hours of emission following the GRB. As the fireball slows due to interaction with a surrounding medium the bulk Lorentz factors of the flow decrease and the beaming angle increases. However, the RASS data cover a time interval of 1–8 hrs after the GRB event. During this time the fireball is expected to decelerate from to . Thus, the flow is still highly relativistic and the afterglow emission is still far from isotropic. One thus expects comparable detection rates for prompt and delayed emission.
On the other hand, if we argue that those of the events in Table 1 which are not optically identified are in fact GRB afterglows, then the rate apparently exceeds expectations. However, the enhancement factor is less than a few. Furthermore, the uncertainties are large and the sample is still small, thus the significance of this enhancement is small. Again we would conclude that the RASS results support consistency between observations and theoretical expectations, with only marginal evidence for less beaming in the X-ray band.
Both points of view basically conclude the same; beaming of GRBs and of their afterglows is, if it exists, comparable. This conclusion supports a similar result (Grindlay 1999) obtained from an analysis of fast X-ray transients observed with Ariel V (Pye McHardy 1983) and earlier instruments. We also emphasize that our results and those discussed by Grindlay (1999) can be used to place constraints on presently undetected GRB populations that preferentially emit in the X-ray band. Dermer (1999) pointed out that the initial fireball Lorentz factor, , is crucial for determining the appearance of the GRB. Since is related to the ratio of total burst energy to rest mass energy of the baryon load a “clean” (low baryon load and/or large energy) fireball is characterized by in excess of 300 (according to Dermer’s definition), while a “dirty” fireball (heavy load) is characterized by a very small Lorentz factor. Dermer argues that clean fireballs produce GRBs of very short duration with emission predominantly in the high-energy regime, while dirty fireballs produce GRBs of long duration that preferentially radiate in the X-ray band. These bursts are in fact predicted to be X-ray bright, but have probably not yet been detected by BATSE and similar instruments, because these detectors are “tuned” to events for which falls in the range 200–400 (Dermer 1999). The absence of a significant number of X-ray transients in the RASS and the Ariel survey thus suggests that the frequencies of “dirty” GRBs relative to bursts with a “normal” baryon load is comparable.
Vietri et al. (1999) drew attention to the “anomalous” X-ray afterglows from GRB 970508 and GRB 970828, which exhibit a resurgence of soft X-ray emission and evidence for Fe-line emission. These authors interprete the delayed “rebursts” in the framework of the SupraNova model (Vietri Stella 1998) in which the GRB progenitor system creates a torus of iron-rich material. The GRB fireball heats the torus, which cools via Bremsstrahlung, leading to a “reburst” in the X-ray band. The emission pattern of this heated torus should be nearly isotropic, so that one expects many X-ray afterglows that are not accompanied by GRBs. The RASS data place severe constraints on this type of reburst scenario, because these delayed components are predicted (Vietri et al. 1999) to be bright (10-4 erg cm-2) and of long duration ( 103 s). The rarity of afterglows in the RASS data suggests that GRBs from “SupraNovae” do not constitute the bulk of the observed GRB population, unless the GRBs are also roughly isotropic emitters (which is in conflict with the correspondingly large energy requirements).
Another constraint can be placed on GRBs related to supernovae (SN). If the association of GRB 980425 with SN1998bw is real (e.g. Galama et al. 1998, Woosley et al. 1999) then such SN-related GRBs would dominate the total GRB rate by a factor of 1000 due to their low luminosities implied by the small redshift (z = 0.0085) of the host galaxy. It can be argued that GRB 980425 was beamed away from us, and we merely saw the less beamed afterglow emission. If this is true, we expect many X-ray afterglows in the RASS data. Again, our results constrain these possibilities, but more quantitative results require detailed simulations that are beyond the scope of this paper.
In order to determine or further constrain differential beaming (X-rays vs. -rays) on short timescales more sensitive surveys with larger exposures (in FOV and time) are needed. It would also be important to establish the statistical properties of low energy afterglows. In particular, for studies of this kind one needs better knowledge of the distribution of peak X-ray fluxes and power law indices of the temporal decays (to better estimate f in eq. 1). BeppoSAX continues to provide these measurements at an approximate rate of one afterglow every 1–2 month. HETE2 will soon add events to this database, BATSE (in conjunction with fast response systems on the ground such as LOTIS, ROTSE, and others) as well as AGILE, BALLERINA, GLAST, INTEGRAL, SWIFT, and perhaps other instruments will provide this information in the near to intermediate future. New insights and surprises are likely to keep observers busy and theorists challenged. In the meantime the RASS observations presented here support the idea that early afterglow emission from GRBs has comparable beaming properties in the X-ray and gamma-ray bands.
Acknowledgements.
We are indebted to E. Costa and J. in ’t Zand for providing X-ray afterglow light curves in digital form for Fig. 2. JG and RS are supported by the German Bundesministerium für Bildung, Wissenschaft, Forschung und Technologie (BMBF/DLR) under contract Nos. 50 QQ 9602 3 and 50 OR 9708 6, respectively, and SZh by INTAS N 96-0315. DHH expresses gratitude for support and hospitality during visits to the AIP in Potsdam and the MPE in Garching. The ROSAT project is supported by BMBF/DLR and the Max-Planck-Society. This research has made use of the Simbad database, operated at CDS, Strasbourg, France and the Digitized Sky Survey (DSS) produced at the Space Telescope Science Institute under US Government grant NAG W-2166.References
- (1) Akerlof C., et al. 1999, Nat. 398, 400
- (2) Bade N., Engels D., Voges W., Beckmann V., Boller Th., et al. 1998, A&A Suppl. 127, 145
- (3) Boer M., Atteia J.-L., Bringer M., et al. 1998, 4th Huntsville GRB workshop, eds. C.A. Meegan, R.D. Preece, T.M. Koshut, AIP 428, p. 846
- (4) Costa E., Frontera F., Heise J., et al. 1997, Nat. 387, 783
- (5) Dermer C.D., Mitman K.E., 1999, ApJ 513, L5
- (6) Dermer C.D., Chaing J., & Böttcher M., 1999, ApJ 513, 656
- (7) Fenimore E.E., Madras C.D., & Nayakshin S., 1996, ApJ 473, 998
- (8) Fenimore, E.E., Cooper C., Ramirez-Ruiz E., et al. 1999, ApJ 512, 683
- (9) Feroci M., Antonelli L.A., Guainazzi M., et al. 1998, A&A 332, L29
- (10) Galama T., et al.1998, Nat. 395, 670
- (11) Greiner J., Voges W., Boller T., & Hartmann D.H., 1999, AA Suppl. (in press; astro-ph/9905272)
- (12) Grindlay J.E., 1999, ApJ 510, 710
- (13) Hartmann D.H., 1999, Proc. Natl. Acad. Sci. USA 96, 4752
- (14) Hartmann, D. H., MacFadyen, A. I. 1999, Proc. 19th Texas Symp. on Relativistic Astrophysics & Cosmology, Paris, Dec. 1998 (in press)
- (15) Hogg G., Fruchter A., 1999, ApJ 520, 54
- (16) in ’t Zand J.J.M., Amati L., Antonelli L.A., et al. 1998, ApJ 505, L119
- (17) Janka H.-T., Ruffert M. 1996, AA 307, L33
- (18) Kobayashi S., Piran T., Sari R., 1997, ApJ 490, 92
- (19) MacFadyen A.I., Woosley S.E., 1999, ApJ, in press
- (20) Meszaros P., Rees M.J., 1997, ApJ 476, 232
- (21) Meszaros P., 1999, in Proc. 19th Texas Symp. on Relativistic Astrophysics & Cosmology, Paris, Dec. 1998 (in press; astro/ph-9904038)
- (22) Meszaros P., Rees M.J., Wijers R.A.M.J., 1999, ApJ (in press; astro/ph-9808106)
- (23) Monet D., Bird A., Canzian B., et al. 1998, available at URL http://aries.usno.navy.mil/ad/ad.html
- (24) Nicastro L., Amati L., Antonelli L.A., et al. 1998, A&A 338, L17
- (25) Paczynski B., 1998, ApJ 494, L45
- (26) Park H.S., Ables E., Band D.L., et al. 1997, ApJ 490, L21
- (27) Perna R., Loeb A., 1998, ApJ 509, L85
- (28) Piran T., 1999, Phys. Rep. 314, 575
- (29) Piro L., Heise J., Jager R., et al. 1998a, A&A 329, 906
- (30) Piro L., Amati L., Antonelli L.A., et al. 1998b, A&A 331, L41
- (31) Pye J.P., McHardy I.M., 1983, MNRAS 205, 875
- (32) Rhoads J.E., 1997, ApJ 487, L1
- (33) Sari R., Piran T., 1997, MNRAS 287, 110
- (34) Schwarz R., Schwope A.D., Beuermann K., et al. 1998, A&A 338, 465
- (35) Schwope A.D., Hasinger G., Lehmann I., et al. 1999, AN (subm.)
- (36) Trümper J., 1983, Adv. Space Res. 2, 241
- (37) Vietri M., Stella L., 1998, ApJ 507, L45
- (38) Vietri M., Perola C., Piro L., Stella L., 1999, MNRAS (subm.; astro-ph/9906288)
- (39) Voges W., Aschenbach, B., Boller, Th., et al. 1999, A&A 349, 389
- (40) Wade R.A., Horne K., 1988, ApJ 324, 411
- (41) Woods E., Loeb A., 1999, ApJ (astro-ph/9903377)
- (42) Woosley S.E., Eastman R.G., Schmidt B.P., 1999, ApJ 516, 788
- (43) Young P., Schneider D.P., 1981, ApJ 247, 960