email: chitre@prl.ernet.in
Star formation along a misaligned bar in the peculiar starburst galaxy Mkn 439
Abstract
We report the detection of massive star formation along a bar in the peculiar starburst galaxy Mkn 439. We present optical , and + emission line images as well as band images to show that the signature of the bar becomes progressively weak at longer wavelengths. Moreover, this bar is misaligned with the main body of the galaxy. The peak emission does not coincide with the bluest regions seen in the colour maps. We infer that the starburst is young since the stars in the burst have not started influencing the light in the near infrared. There are indications of dust in the inner regions of this galaxy.
Key Words.:
Galaxies : individual : Mkn 439 – Galaxies : starburst – Galaxies : photometry1 Introduction
Mkn 439 (NGC 4369, UGC 7489, IRAS 12221+3939) is a nearby early type starburst galaxy (z=0.0035). It has been classified as a starburst by Balzano (balz (1983)) based on the equivalent width of and also belongs to the Bright Galaxy Sample (Soifer et al. soif (1987)). On the basis of multiaperture near infrared photometry and optical spectroscopy, Devereux (dev (1989)) describes this galaxy as a M82 type starburst galaxy. Rudnick & Rix (rudrix (1998)) report an azimuthal asymmetry in the stellar mass distribution of Mkn 439 based on the band surface brightness. The peculiar morphology of Mkn 439 attracted our attention during the course of an optical imaging study of a sample of starburst galaxies derived from the Markarian lists (Chitre chitre (1999)). The galaxy image was nearly circular and appeared featureless in long exposure images. The outer isophotes were smooth and nearly circular in and bands. However, the isophotal contours show highly complex features in the inner parts. Moreover, the strength of these features is wavelength dependent. Wiklind & Henkel (wik (1989)) report the detection of a molecular bar in the central region of this galaxy based on the results of CO mapping. No detailed surface photometric studies of this galaxy have been reported. Usui, Saito & Tomita (usui (1998)) report the detection of two regions bright in that are displaced from the nucleus and faint emission from the nucleus. However, their data were obtained at a seeing of 5″. In order to study the spatial distribution of various stellar populations in Mkn 439, we imaged this galaxy in , , and bands. The and band continuum trace the intermediate age populations while traces the young, massive stellar populations. The infrared continuum of galaxies is dominated by evolved stellar populations. Hence, the band and the line emission images can be used alongwith the optical continuum images to separate the young and old stellar populations spatially.
2 Observations and data reduction
2.1 Optical (,) and imaging
The , and images were obtained under photometric conditions from the 1.2m telescope at Gurushikhar, Mt. Abu. The images were taken at the Cassegrain focus employing a thinned back illuminated Tektronix 1K 1K CCD. Binning of 2 2 was employed before recording the images to increase the signal-to-noise ratio of the measurements and keeping in mind the data storage requirements. The final resolution was 0.634′′/pixel which is sufficient to sample the point spread function (PSF) appropriately. Typical seeing (full width at half maximum (FWHM) of the stellar images) was 1.8′′ for the images. For the images a filter having FWHM of 80 Åwas used. Another off-band filter of the same FWHM was used to measure the galactic red continuum. About 3-4 exposures were taken in each of the photometric bands. The total exposure times were 510 sec, 360 sec and 1600 sec in , and respectively. Standard stars from Landolt (land (1992)) were observed to calibrate the broad band data. Twilight flats were taken and median filtered to construct the master flats. The data was reduced using IRAF 111IRAF is distributed by National Optical Astronomy Observatories, which is operated by the Association of Universities Inc. (AURA) under cooperative agreement with the National Science Foundation, USA. on the IBM-6000 RISC at PRL, Ahmedabad. A detailed reduction procedure can be found in Chitre & Joshi (cucj (1999)).
2.2 band images
The band images were recorded with a 256256 NICMOS array
at the 1.2 m Gurushikhar telescope. An exposure of 30 sec ensured that
the background and the galaxy signal were in the linear portion of the
detector response
curve
(Joshi et al. jetal (1999)).
Observations were made by alternating between the galaxy and positions 4′-5′to the north and south till a total integration time of 600 seconds
on the galaxy was achieved.
Several dark frames having the same time sequences as that of galaxy or sky were
taken and median filtered master dark frames were constructed.
The median filtered master sky frames were constructed using several sky frames
with integration times equal to those given for the galaxy. All the source
frames were corrected for the sky background by subtracting the master sky frame
from the source frames. As the program galaxy does not occupy the whole
detector array, the residual sky was determined from the image corners and
the images were then corrected for residual sky.
The dark subtracted sky frame was used to construct the master flat.
The sky corrected galaxy frames were corrected for flat field response of the
detector by dividing the galaxy frames by the master flat.
Finally, the galaxy images
were aligned by finding the center of the galaxy nucleus using the IMCNTR task
in IRAF and co-added to improve the S/N ratio. The plate scale was selected to
be 0′′.5 per pixel. Faint standard stars from the UKIRT
lists were observed for calibration.
| Parameter | Value |
|---|---|
| (2000) | 12h22m0.8s.4 |
| (2000) | 3939′41″ |
| RC3 type | RSAT1 |
| UGC type | S0/Sa |
| bAdopted distance | 18 Mpc |
| a | 12.27 |
| a | -0.02 |
| a | 0.65 |
| LFIR | 4 |
-
a
RC3
-
b
Deutsch & Willner (deut (1987))

3 Morphology of Mkn 439
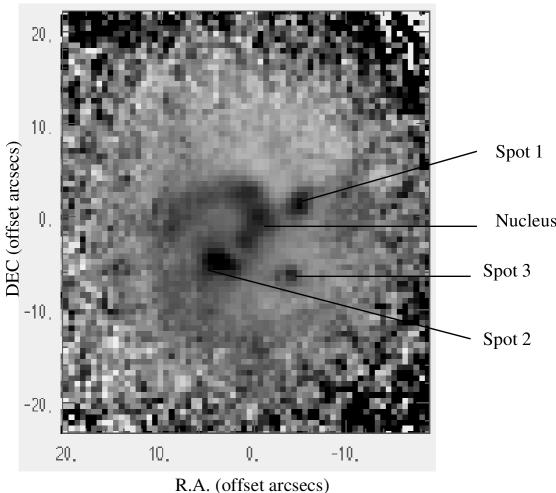
Fig. 1 illustrates the isophotal contours of the inner 25″ of Mkn 439 in , , continuum subtracted and band. A comparison of the various panels in Fig. 1 shows that the morphological structures vary at different wavelengths. The morphology of Mkn 439 in the band is characterized by smooth outer isophotes and a very complex light distribution in the inner region. The central region is elliptical and is elongated in the NS direction. Faint indications of a spiral arm in the NE direction is seen in the isophotal maps in and . The contour maps show two projections - one along the NW and the other along the SE from the nuclear region. These projections are most prominent in the continuum, getting progressively fainter at longer wavelengths and nearly disappearing in . The band image shows another condensation to the SW of the nuclear region. Similar to the projections, this feature also gets progressively fainter at longer wavelength. The band image shows smoother isophotes. The signature of the projections is absent at this wavelength. As seen in the band, the outer isophotes are nearly circular. However, unlike other optical bands, there are no spurs or bar-like features apparent in the band image. The continuum subtracted image shows an elongated bar-like strucure corresponding to the projections seen in the contour maps. emission is seen along the bar in the form of clumps. Emission is most intense at the ends of the bar, though it is found to extend throughout the body of the galaxy. Emission from the nucleus is much fainter as compared to that from the clumps in the bar ends. emission is maximum in Spot 1. The clump of emission seen to the E of the extended emission has no counterpart in the continuum colour map. The bright blobs of emission in have no counterparts in the band. This indicates that the HII regions are young and have not yet evolved enough to form a considerable number of red giants and supergiants to start influencing the light in the band. It is also seen that the latest episode of star formation is misaligned with the isophotal contours of the near infrared continuum. The (-) colour map (Fig. 2) was constructed by scaling the images, rotating and aligning them. It shows interesting features. A bar-like structure made up of blue clumps is seen in the central part of the galaxy. A spiral arm starts from the nuclear region and curves towards the eastern side. A distinct blue clump is present at either end of the bar marked as Spot 1 and Spot 2 in Fig. 2. These correspond to the ends of the two projections seen in the isophotal contours in . Another blue region (Spot 3) is seen about 8″ to the south of Spot 1. The clump of emission seen to the E of the extended emission has no counterpart in the continuum colour map. The (-) and (-) colours of these regions are listed in Table 2. The isophotal contours of Mkn 439 appear different in the optical, near infrared and the line emission indicating the spatial separation of the distribution of these various populations. The gaseous component in the galaxy appears to be under the influence of a potential which has distributed it in the form of a gaseous bar. Compression of the gas in the bar has led to the formation of young, massive stars which are seen as clumpy HII regions along the bar. We infer that the latest dynamical episode experienced by the galaxy has given rise to the formation of young, massive stars along the bar as a result of the response of the gas to the perturbing potential. A comparison of the contours in Fig. 1 and Fig. 2 reveals that no HII regions are seen in the blue spiral arm-like feature emerging from the nucleus indicating that the blue spiral arm is made up of an intermediate age stellar population. Wiklind & Henkel (wik (1989)) report the detection of a molecular bar in the central region in this galaxy based on CO mapping. They observed Mkn 439 in both the J=1-0 and J=2-1 line of CO and found that the ratio of the J=2-1 to the J=1-0 intensity varies with position and inferred that this was due to changing physical conditions in the molecular cloud population. The contour maps of these two transitions can be found in Wiklind (wikthes (1990)). Many galaxies with weak stellar bars have been found to contain pronounced bar-like gas distributions similar to the one found in Mkn 439. For example, the center of the nearby Scd galaxy IC 342 harbors a bar-like molecular gas structure and a modest nuclear starburst (Lo et al. lo (1984); Ishizuki et al. ish (1990)). Other examples of galaxies having a molecular bar at their centers are NGC 253 and M83. Simulations by Combes (combes (1994)) describe the formation of a gas bar which is phase shifted from the stellar component in the innermost regions of a galaxy due to the existence of perpendicular orbits. However, her models describe the situation for the nuclear bars and in the innermost 1kpc region. An alternative explanation could be that two unequal mass spirals have merged to form the S0 galaxy. Bekki Kenji (bek (1998)) suggests that S0 galaxies are formed by the merging of spirals and when two spirals are of unequal mass, the S0 galaxy thus formed has an outer diffuse stellar envelope or a diffuse disk like component and a central thin stellar bar composed mainly of new stars.


| region | - | - |
|---|---|---|
| nucleus | 0.4 | 2.8 |
| spot 1 | 0.7 | 2.9 |
| spot 2 | 0.6 | 2.6 |
| spot 3 | 0.8 | 3.2 |
4 Isophotal analysis
In order to provide a quantitative description of the morphological aspects at various wavelengths, we explored Mkn 439 using ellipse fitting techniques. The procedure consists of fitting elliptical isophotes to the galaxy images and deriving 1-dimensional azimuthally averaged radial profiles for the surface brightness, ellipticity and the position angle based on the algorithm given by Jedrejewski (jedr (1987)). This technique has been used successfully in studying various structures in galaxies like bars, rings, shells, etc. and in searching for dust in them (Bender & Möllenhoff bend (1987); Wozniak et al. woz (1995) and Jungweirt, Combes & Axon jung (1997)). Multiband isophotal analysis can also be used to indicate whether the reddening seen in colour maps is due to a redder stellar population or due to the presence of dust (Prieto et al. 1992a , 1992b ). The surface brightness distribution and the variation of the position angle and ellipticity of the isophotes in each filter (Fig. 3) were obtained by fitting ellipses to the images in each filter using the ISOPHOTE package within STSDAS222The Space Telescope Science Data Analysis System STSDAS is distributed by the Space Telescope Science Institute.. The detailed fitting procedure used is outlined in Chitre (chitre (1999)). The radial distribution of the colour indices (Fig. 4) was derived from the surface brightness profiles. Fitting isophotes to the images reveals changing ellipticity and position angle throughout the body of the galaxy (refer Fig 3). The luminosity profile is smooth except for small features at 5″ and 10″ in the optical bands. An inspection of Fig. 4 shows that the galaxy is bluest near the center and gets redder outwards. The ellipticity of the elliptical feature is maximum at the center and goes on decreasing outwards unlike a bar in which ellipticity increases accompanied by a constant position angle. The ellipticity profile shows a double peaked structure in the inner region. The first peak is seen between 2″- 3″ and the second peak at 5″. The ellipticity of the first peak is wavelength dependent, the isophotes at shorter wavelengths being rounder. The colour map also shows a small local redder region between 3″ and 4″. The surface brightness profiles also show a small dip in the intensity at shorter wavelengths at 4″. All these features indicate the presence of dust in the inner 4″ of this galaxy. van den Bergh & Pierce (van (1990)) do not find any trace of dust in Mkn 439 from a direct inspection of the band images on a CCD frame. However, ellipse fitting analysis has been successfully employed in the present study to infer the presence of dust in the inner regions of this galaxy based on multiband observations. The other peak occurs at 5″ which corresponds to the brightest region seen in H. The depth of the dip between the two peak reduces at longer wavelengths. The first peak and the dip is probably due to dust while the second one corresponds to the blue region at the end of the bar. Both these factors, namely dust and star forming regions contribute the maximum at shorter wavelengths. At longer wavelengths, the effects of both dust and the star forming regions are reduced hence we see the underlying old stellar population. As a result the depth of the dip is reduced at longer wavelengths. Beyond 5″, the ellipticity starts dropping and reaches a value (0.05) at 15″ and remains at a low value beyond that in all filters. Between 5″ and 15″, the isophotes at shorter wavelengths are rounder than the corresponding isophotes at longer wavelengths indicating the presence of dust in this region of Mkn 439. The position angle is nearly constant in the inner 10″. The luminosity profiles show an inner steeply rising part and an outer exponential disk. We derived the scale lengths of Mkn 439 in each of the filter bands. This was done by marking the disk and fitting an exponential to the surface brightness profile in this region. The range of fit was taken to be from 18″ to the region where the signal falls to 2 of the background. The fit to the band is shown in Fig.3. The scale lengths derived were 0.97 kpc in , 0.84 kpc in and 0.61 kpc in band.
5 Conclusions
-
1.
Mkn 439 is a peculiar galaxy made up of three distinct components: an elliptical structure in the inner regions, a smooth outer envelope in which this structure is embedded and a bar. We detect massive star formation along the bar in Mkn 439. This bar is misaligned with the main body of the galaxy.
-
2.
The signature of the bar gets progressively fainter at longer wavelengths.
-
3.
The stars in the bar are young and have not yet started influencing the light in the near infrared region. This indicates that the galaxy has undergone some perturbation which trigerred the bar formation and the starburst along the bar in recent times.
-
4.
There are indications for the presence of dust in the inner 15″ of the galaxy.
Acknowledgements.
We are grateful to the anonymous referee for useful suggestions. One of the authors A. Chitre wishes to thank Tommy Wiklind for useful discussions. The authors are thankful to Dr. K.S. Baliyan for helping with observations. This work was supported by the Department of Space, Government of India.References
- (1) Balzano V.A., 1983, ApJ 268, 602
- (2) Bekki Kenji, 1998, ApJ 502, L133
- (3) Bender R., Möllenhoff C., 1987, A&A 177, 71
- (4) Chitre A., 1999, Ph.D thesis, Gujarat University
- (5) Chitre A., Joshi U.C., 1999, A&AS in press
- (6) Combes F., 1994, in: The Formation and Evolution of Galaxies, V Canary Islands Winter School of Astrophysics, eds. C. Muñoz-Tuñon & F. Sánchez, Cambridge Univ. Press, p.359
- (7) Deutsch L.K., Willner S.P., 1987, ApJS, 63, 803
- (8) Devereux N.A., 1989, ApJ 346, 126
- (9) Ishizuki S., Kawabe R., Ishiguro M., et al., 1990, Nature 344, 224
- (10) Jedrejewski R.I., 1987, MNRAS 226, 747
- (11) Joshi U.C., et al., 1999 in preparation
- (12) Jungweirt B., Combes F., Axon D.J., 1997, A&AS 125, 497
- (13) Landolt A.U., 1992, AJ 104, 340
- (14) Lo K.Y., Berge G.L., Claussen M.J., et al., 1984 ApJL 282, 59
- (15) Prieto M., Beckman J.E., Cepa J., et al., 1992a, A&A 257, 85
- (16) Prieto M., Longley D.P.T., Perez E., et al., 1992b, A&AS 93, 557
- (17) Rudnick G., Rix H., 1998, AJ, 116, 1163
- (18) Soifer B.T., Sanders D.B., Madore B.F., et al., 1987, ApJ 320, 238
- (19) Usui T., Saito M., Tomita A., 1998, AJ 116, 2166
- (20) van den Bergh S., Pierce M.J., 1990, ApJ 364, 444
- (21) Wiklind T., 1990, Ph D thesis, Chalmers University of Technology, Sweden
- (22) Wiklind T., Henkel C., 1989, A&A 225, 1
- (23) Wozniak H., Friedli D., Martinet L., et al., 1995, A&AS 111, 115