E+A Galaxies in the near-IR: Field and Clusters
Abstract
I present near-IR photometry of a selected sample of E+A galaxies observed in the southern hemisphere. The sample includes 50 galaxies from nearby clusters () and distant clusters () as well as E+A galaxies from the field (). I have also observed 13 normal early-type galaxies from the field and from clusters, to be compared with the E+A sample. The photometry includes , and apparent magnitudes and colors. I investigate systematic properties of the E+A sample as a function of their environment, contrasting the observed colors with spectrophotometric models of galaxy evolution.
Carnegie Institution of Washington. Las Campanas Observatory. Casilla 601. La Serena. Chile. E-mail: gaspar@azul.lco.cl
1. Introduction: what is an E+A galaxy?
Most of the E+A galaxies present mid- to early-type morphologies, as it was already shown by some authors ([1], [2]). A little fraction of them have late Hubble types (but see [3]). However, their spectra is peculiar: they do not have emission lines, representative of an ongoing star formation, but they have strong Balmer absorption lines, representative of a young population (A and B spectral types), and also strong Mg b , Ca H & K , and Fe lines, indicating that they have a rich population of G, K and M spectral types. This young population suggests that the E+A galaxies are 1 Gyr to 4 Gyr old. Are there other peculiar signatures in the spectra of the E+A galaxies? In particular, are their late-type star populations and their AGB population also different to those of normal galaxies? If so, we can conclude that the E+A phenomenon also involves changes in their older population. In that case, models trying to explain the nature of the E+A galaxies should also fit the signatures observed in the old stellar content.
2. Near-IR photometry of E+A galaxies
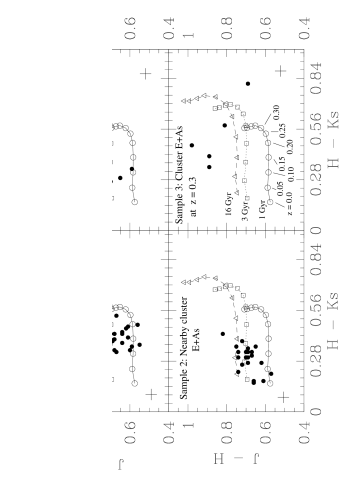
In order to investigate the above questions, I have started a program to observe southern E+A galaxies in the near-IR. All the observations are being carried on at Las Campanas Observatory (LCO), using NICMOS3 HgCdTe arrays (256 256 pixels) at both the 1-m Swope telescope (0.599 arcsec/pix, 2.5 arcmin2 FOV), and the 2.5-m du Pont telescope (0.42 arcsec/pix, 1.8 arcmin2 FOV). All the observations are carried on under photometric conditions and seeing arcsec, and include , and imaging. The sample of galaxies includes E+As from nearby (, [2]) and intermediate-redshift (, [4]) clusters, as well as E+As located in the field [5], at . Photometry is performed on the calibrated images using SExtractor [6]. Total apparent magnitudes and colors are computed, and compared with spectrophotometric models of galaxy evolution generated using GISSEL96 [7] (see Figure 1). Rest-frame colors are extremely dependent on models, necessary to compute K-corrections. Near-IR spectroscopy will be obtained soon, in order to have reliable K-corrections, allowing to derive robust interpretations from rest-frame colors.
References
[1] Dressler, A., and Gunn, J. 1983, ApJ, 270, 7
[2] Caldwell, N., and Rose, J. 1997, AJ, 113, 492
[3] Dressler et al. 1999, ApJS, 122, 51
[4] Couch, W., and Sharples, R. 1987, MNRAS, 229, 423
[5] Zabludoff, A. et al. 1996, ApJ, 466, 104
[6] Bertin, E., and Arnouts, S. 1996, A&AS, 117, 393
[7] Charlot, S., Worthey, G., and Bressan, A. 1996, ApJ, 457, 625 (GISSEL96)