WFPC2 Imaging of Young Clusters in the Magellanic Clouds11affiliation: Based on observations with the NASA/ESA Hubble Space Telescope, obtained at the Space Telescope Science Institute, which is operated by the Association of Universities for Research in Astronomy, Inc., (AURA), under NASA Contract NAS 5-26555.
Abstract
We have carried out Wide Field Planetary Camera 2 F160BW, F555W and F656N imaging of four young populous clusters: NGC 330 in the Small Magellanic Cloud and NGC 1818, NGC 2004 and NGC 2100 in the Large Magellanic Cloud. We report photometric results for these four clusters, including identification using photometric colours of the cluster Be star population. We present theoretical WFPC2 and broad band colours and bolometric corrections for LMC and SMC metallicities. The use of the far-UV F160BW filter enables accurate determination of the effective temperatures for stars in the vicinity of the main sequence turnoff and on the unevolved main sequence.
1 Introduction
In this paper we present new UV, visual and H photometry obtained with the WFPC2 camera on board the HST, of NGC 330, NGC 1818, NGC 2004 and NGC 2100, four young populous clusters in the Magellanic Clouds with main sequence turnoff masses in the range of 9-12 M⊙. A key feature of the evolution of 8-20 M⊙ stars is the treatment of convection and the presence and degree of the extension of the convective core. This paper presents the observational data that will form the basis of a quantitative investigation for the presence of convective core extension, and its magnitude, as constrained by these clusters. The further analysis is to be found in a later paper (Keller et al. 1999c ).
The fundamental basis for our understanding of the evolution of stars of various masses is derived from the comparison between the observed colour-magnitude diagrams (CMDs) of star clusters and the predictions of stellar evolution theory in the forms of evolutionary tracks and isochrones. This interactive process has provided much insight into the physics of stellar evolution. Even though the grounds of stellar evolution are well understood, there remain a number of points of uncertainty that may potentially impact not only on current estimates of evolutionary parameters of stellar clusters, but also on the more sophisticated results that use such parameters as their basis. One such point of contention is the physical causation of the observed extension of the main sequence (MS) beyond that predicted by no overshoot, non-rotating stellar evolutionary models.
Convective core overshoot is commonly proposed as the mechanism for the extension of the convective core. However, more recently the role of rotation has been recognised as offering a more natural way to bring about the same end result, i.e. increased internal mixing, (Maeder maeder98 (1998), Langer & Heger langer98 (1998) and Talon et al. talon97 (1997)). However with these models in their infancy, our discussion here is conducted within the convective core overshoot paradigm.
On the theoretical front, discussion of the efficiency of convective core overshoot has been addressed by several authors with different results, ranging from negligible to substantial (see e.g. Bressan bressan81 (1981)). In the absence of hydrodynamical models the amount of mixing is only weakly constrained by physical arguments. In order to ascertain the correct amount to apply within stellar evolutionary models we must infer this amount from the populations within star clusters.
The difficulty has been to find a sufficiently large, young and coeval population in which to search for signs of overshooting. Galactic clusters of comparable age to those of the present study contain small numbers of stars and individually offer little insight. The clusters of the present study contain upwards of 10 the mass of their galactic counterparts. Within these clusters the numbers of stars are such that statistically meaningful confrontations with evolutionary theory are possible.
The promising nature of the four clusters studied in the present work has lead to several previous ground-based and IUE studies. These studies have revealed several anomalies with evolutionary models which do not include overshooting. Problematic features include: the observed and predicted temperatures of the MS turnoffs differ by up to several thousand degrees; the observed and predicted turnoff luminosities also disagree by as much as 1 mag in (Caloi and Cassatella caloi95 (1995), Caloi et al. caloi93 (1993)); the relative luminosity of the red giants and the turnoff are not consistent with model predictions for a coeval population (Caloi and Cassatella caloi95 (1995)).
These features are indicative of some degree of convective overshoot within the population. However, further conclusions from these studies are limited since most have been restricted to the brightest members, the only stars for which accurate effective temperatures were attainable. They extend to just below the MS turnoff. The data we present here are a significant extension to these previous studies. The superior resolution of the WFPC2 camera and far-UV coverage has enabled us to extract accurate effective temperatures for a large sample of stars up to 4 magnitudes in below the MS turnoff. This forms a database suitable for quantitative investigation of convective core overshoot.
2 Observations and Data Reduction
The data presented in this paper were obtained by the HST using the WFPC2 on June 1997. Exposures in F555W, F160BW and F656N were obtained. Table 1 details the exposures obtained. The F160BW filter (= 446Å, = 1491Å) is a wideband filter with negligible red-leak. The imaging and transmission properties of the F160BW filter have been described by Watson et al. (watson94 (1994)). F656N is a narrow band filter(= 22Å) centred on the H line. This filter was included to identify those stars showing H emission, namely Be stars, of which the four clusters discussed here are known to have large populations (e.g. Keller et al. 1999a ).
Biretta and Baggett (biretta (1998)) have examined the noise characteristics of the far-UV flats used in the standard data pipeline. They find that the excessive noise in the F160BW flat field is a serious limitation on the F160BW photometry. We have reprocessed the F160BW data through the standard data pipeline (Holtzman et al. 1995a) for bias subtraction and flat fielding. Following Biretta and Baggett we have used a F255W flat instead of the F160BW. To account for the large-scale vignetting of the F160BW filter in the WFs we form a vignetting correction by taking the ratio F160BW flat/F255W flat then smoothing by a 20 pixel FWHM Gaussian function and then dividing this image into the data flattened with the F255W flat.
In both F555W and F160BW multiple exposures were taken, the set of images were combined and cleaned of cosmic rays within the IRAF package using the GCOMBINE task. Care was taken when combining these frames that the central regions of individual stellar profiles were not truncated. When combining, the gcombine task forms the median (or the average in the case of two frames) of each pixel value after rejecting those values that are deemed statistically unreasonable. Such selection is made on the basis of the readnoise, gain and sensitivity noise.
In some circumstances a side product of the cleaning/rejection process is that some stars show truncated intensity profiles. We suspect that this maybe due to subpixel shifts of the centroid of the stellar image between images in the combining process. When the PSF is undersampled, as is the case with the WFPC2, it is possible for the central pixel values of a stellar image to differ by several sigma from that expected from noise calculations between images due to small subpixel shifts. These suspect values are rejected, in all cases the lower pixel value is retained. This effect is pronounced amongst the brighter stars. We find a sensitivity noise of 0.1 is optimal within the GCOMBINE task for avoiding this effect and ensuring cosmic ray removal.
The fields are relatively crowded in both F555W and F160BW. We found that photometry through a 3px radius (0.15″on PC, 0.3″on WF) aperture was optimal. Appropriate aperture corrections were made to the 0.5″standard adopted by Holtzman (1995b ). The sky brightness was determined from the median within a 5px wide annulus of inner radius 10px. The measured FWHM in the F160BW images varies significantly in all cameras in a radial manner; in its centre the FWHM is around 1.7px and at the edges 1.9px with a marked ellipticity. The measured FWHM for the F555W filter is around 1.6px (0.08″on PC, 0.16″on WF). The PSF in F555W does not vary significantly across the field. Tests with a range of apertures have reassured us that the variable PSF in F160BW does not introduce position dependent variations in the extracted photometry through our chosen aperture.
F555W and F160BW magnitudes are reported in the conventional system based upon the spectrum of Vega. The zeropoints used were taken from STScI:WFPC2(STSci:WFPC2 (1997)). We have corrected our F160BW magnitudes for the attenuation due to adhering contaminants on the external aperture following the prescription of Holtzman et al (1995b ) and the contamination rate given for chips 1 and 3 in Whitmore (whitmore97 (1997)). The WFPC2 is subject to a variation in charge transfer efficiency across each detector. We have made a correction using a simple ramp model as described in Holtzman et al. (1995b ).
A degree of geometric distortion is present in the WFPC2 camera (details in Whitmore whitmore97 (1997)). This is most severe in the F160BW filter. For simple aperture photometry as preformed here these distortions are not problematic, however to minimise the chance of incorrectly matching faint stars between the F160BW and F555W images it was found to be necessary to transform the coordinates of the F160BW frame to those of the F555W frame.
3 Photometric Uncertainties and Completeness
As noted above, flat fields are a major contributor to the uncertainties in our photometry. Whitmore & Heyer (whit97 (1997)) have found that in the optical broad-band filters the uncertainties introduced into aperture photometry of point sources due to flat fields are of the order of 1.5% or less. This is not the case in the far-UV, here Biretta and Baggett (biretta (1998)) report that the F160BW flat in particular is very noisy. The RMS noise is found to be 20% near the centre of the field. A most demonstrative improvement offered by the adoption of the F255W flat is the reduction by 1/3 in the apparent width of the upper MS in the resultant CMDs.
We have compared the photometry in the short and long exposures for both F555W and F160BW. This shows the internal accuracy of the photometry. We see that the internal accuracy is of the order of 0.03 mag for the brightest stars, ie. those with F555W14.5, and rises to 0.1 for stars 4 mag. below the saturation level of the long exposure (F555W=19.0 and F160BW=16.5). We find no indication of a systematic dependence of the difference in magnitude between short and long exposures with magnitude.
A number of photometric studies of these clusters exist in the literature. Many of the earlier works confine themselves to the outer extremities of the clusters. The first extensive study of these clusters is the photographic study of Robertson (robo (1974)). CCD studies include Walker (walker92 (1992): NGC 330), Sebo & Wood (seb94 (1994): NGC 330), Bencivenni et al. (ben91 (1991): NGC 2004), Sagar et al. (Sagar91 (1991): NGC 2004 and NGC 2100) and Balona & Jerzykiewicz (bal92 (1992): NGC 2004 and NGC 2100). However many CCD based studies have taken previous studies, in particular that of Robertson (robo (1974)), as the basis of standardisation. Consequently there exist a limited number of external checks on our F555W photometry. In the case of the F160BW magnitudes there exists no straightforward means to quantify the uncertainties, we derive an estimate from indirect means in section 6.
In deference to the frequent use of the magnitudes of Robertson in many intervening discussions we firstly examined our photometric results relative to those of Robertson. For the purposes of comparison we have transformed our F555W magnitudes to Johnson using the transformation of Holtzman et al. (1995b ). The results for all four clusters are shown in figure 1. It is not suprising to see that there is a much greater dispersion in Robertson’s photometry of stars close to the cluster core (open squares) where the degree of crowding is extreme, compared to those more radially distant (filled squares). If we restrict the comparison to those stars without close neighbours in Robertson’s outer B,C,D regions and 14.0 we find a mean difference of +0.010.08 mag. The CCD-based photometry of Walker (walker92 (1992)) in NGC 330 is of high precision. We have included in figure 1 the comparison between the photometry of Walker and our own, here we see an agreement to -0.010.03 mag. This is quite satisfactory.
We have evaluated our completeness limits by the addition of sets of artificial stars to the final frames for each colour. Using the IRAF ADDSTAR routine we added 100 stars and observed the number recovered by the standard reduction procedure (using DAOFIND). This was repeated 100 times. An examination of the results finds our photometry 90% complete to 19.5 in F555W, 17.5 in F160BW and 21.0 in F656N. This is consistent with the observed stellar luminosity function evident in figures 3 - 6 which continues to rise to F555W19, but drops sharply due to incompleteness beyond F555W=19.5
4 Be Star Detection
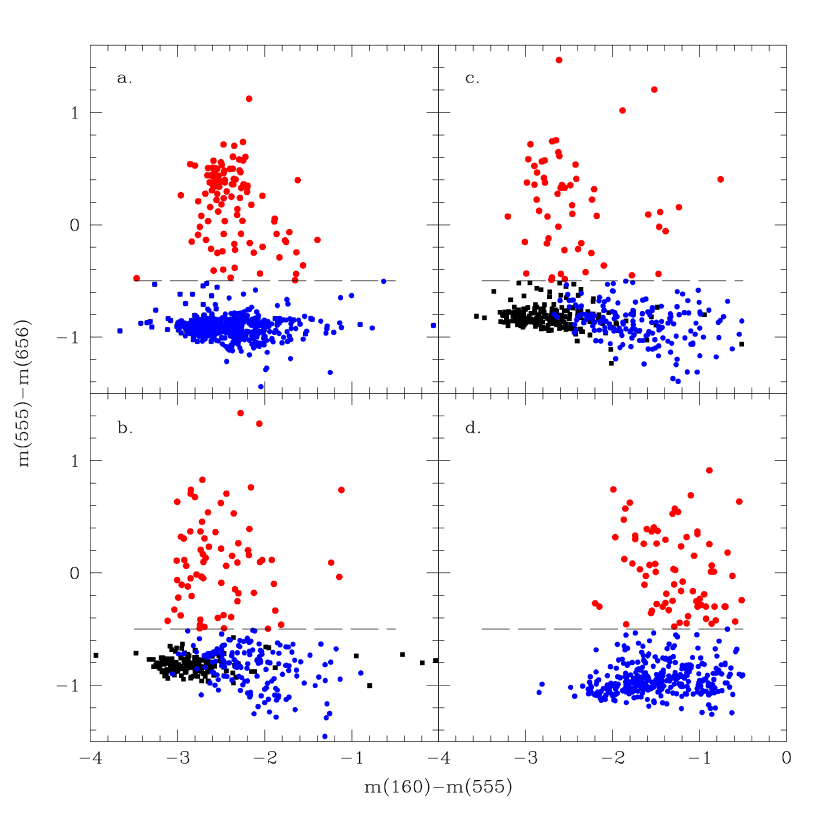
The detection of the Be star population is made from the F555W-F656N, F160BW-F555W diagram. Stars with strong H emission should appear to have a more positive F555W-F656N colour than their non-emission counterparts at similar F160BW-F555W colour. Given that a typical Be star has H emission with a full width at half maximum of 7Å and peak H flux 5 times the local continuum flux, a search of this kind with a 22Å filter is readily capable of detecting Be stars. Figures 2a-d. show the diagnostic diagrams. Using Fig. 2a. as a typical case, we note that most main sequence stars lie in a tight, almost horizontal band. The cool supergiants are omitted as they are saturated in H. Stars within this band do not have detectable H emission. Above this band are a group of stars that clearly show significant H emission: these are Be stars.
The dispersion in F555W-F656N of normal MS stars about the central locus of the band is determined by the photometric errors in both the narrow band H and F555W magnitudes. Both have similar signal to noise characteristics. This uncertainty will depend upon the magnitude of the star. We limit our Be star selection process to stars with F555W 19.0. In order to select a sample of Be stars, we draw a line in each of the F555W-F656N diagrams parallel to the sequence of non-emission line stars and at a distance of 0.5 magnitudes above it. The standard deviation in the F555W-F656N colour of the normal B stars below this cutoff is at most 0.23 (in the case of NGC 2100). Consequently the imposition of this cutoff excludes members of the band of normal main-sequence stars to at least a 2 level.
Application of such a cutoff introduces a lower limit on the equivalent width of the Be stars detected by our survey. We estimate that this limit is of the order of that within Keller et al. ( 1999a ) of 9Å. Spectroscopy in NGC 330 (Keller et al be330 (1998)) found, from a sample of 29 B and Be stars, only one star with an emission equivalent width smaller than this limit. For this reason we do not consider that our lower limit is a significant limitation. All known Be stars within the outer extremities of the clusters are retrieved by our Be detection criteria. Within the cluster cores the high spatial resolution of the present data reveals a large number of Be stars either undetectable or unreliably located within ground-based data.
Nebular H emission is visible in the field of NGC 2100. Implicit in the photometric detection technique is sky subtraction on small spatial scales which avoids mis-classification of normal B stars superimposed upon filamentary structure within the background unless the background is particularly clumpy which is not the case within our data.
5 Luminosity Function of the Be Fraction
We have investigated the fraction of stars along the MS which are Be stars by binning both emission-line and non-emission-lines stars with F160BWF555W 1.0 into magnitude bins in F555W. Figure 7a-d. show our results. In each case the Be fraction peaks towards the MS turnoff. Table 8 examines the statistical significance of this trend in more detail. Here we have divided the stars into two groups: the brighter stars within 2 magnitudes of the MS turnoff (i.e. F555W16.5) and the fainter stars with 19F555W16.5, all with F160BWF555W1.0. In each case the fraction of Be stars near the MS turnoff are significantly higher than the Be fraction further down the MS. We note that V=19 corresponds to spectral type B9 in the calibration of Zorec and Briot (1991), consequently below this cutoff we would not expect any Be stars.
In Keller et al (1999a ) we performed a ground based survey for Be stars within these clusters and their surrounding fields. Within this previous study a similar analysis as that presented above, revealed no statistically significant peak towards the MS turnoff. We note that the observations in Keller et al (1999a ) were restricted by the imposition of a limiting magnitude of =17.5 (i.e. spectral type B5). In addition, due to crowding, the inner 15″ of each cluster was unusable. The present sample is also free from significant field contribution, which acts to dilute any difference between the cluster and field populations.
Maeder et al. (mae99 (1999)) provide a review of previous studies of the Be fraction within the MCs and various galactic clusters. Amongst the four clusters studied here reference is made to the studies of Grebel (grebel97 (1997): NGC 1818), Grebel et al. (grebel92 (1992): NGC 330) and Kjeldsen & Baade (kjeldsen (1994): NGC 2004). A comparison of the two sets of results shows qualitative agreement in the case of NGC 330 and NGC 2004. In the case of NGC 1818, Grebel (grebel97 (1997)) finds a Be fraction which is consistently higher than our results and does not show signs of a drop off with increasing magnitude. Towards the faint limit of the sample of Be stars indicated by Grebel (grebel97 (1997)) we find a high proportion of objects within crowded regions which do not show signs of strong emission. We posit that the spurious detections in the data of Grebel arise from crowding within the central regions.
Fractions as high as seen in the present study are unprecedented when seen in the light of comparable studies of the Be fraction within the surrounding field. Our examination of the field population of Be stars within the MCs described in Keller et al. (1999a ) revealed the fraction of Be stars to be more or less evenly distributed with magnitude at 15%, in contrast to the peaked distribution seen within the clusters. This is in line with the Be fraction seen within the galactic field. Studies drawing a volume-limited sample from within the galactic field face the difficulties of interstellar reddening and depth effects, at best they limit the Be fraction to 5% at B9 rising to around 20% at B2 (=-3.5) (see figure 1 of Zorec and Briot 1997). The evidence is suggestive that there is a fundamental difference between the Be star populations in the clusters and the field which, if borne out by closer scrutiny, would have important implications on the evolutionary status of Be stars. This is however only suggestive at the moment, in a latter paper (Keller et al. 1999d ) we will attempt to resolve this issue through the examination of a larger sample of the field population within the MCs.
6 Colour-Magnitude Diagrams
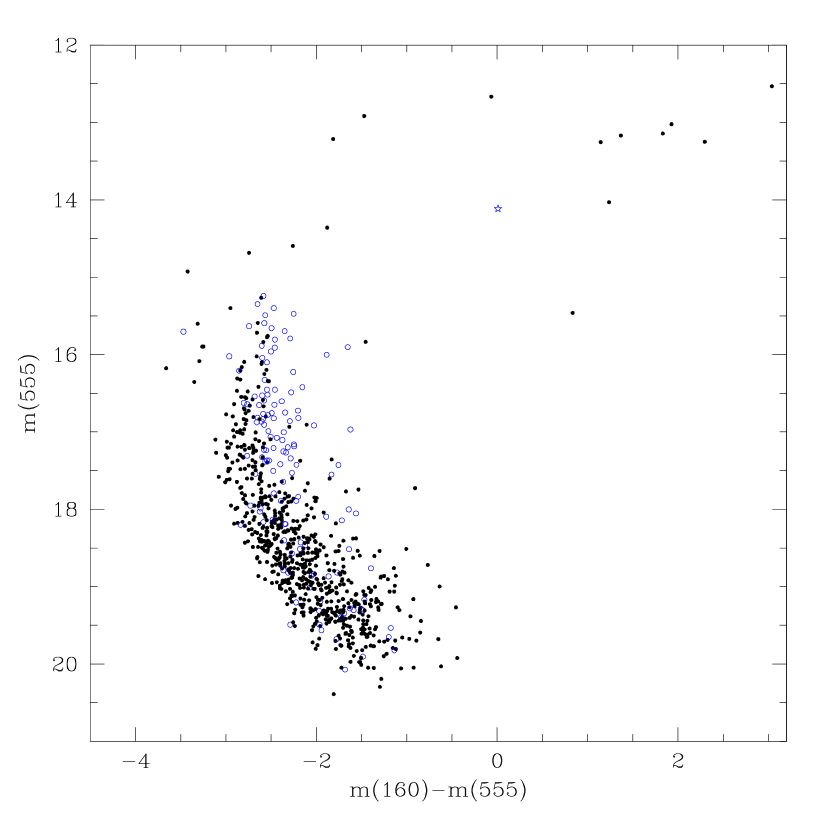
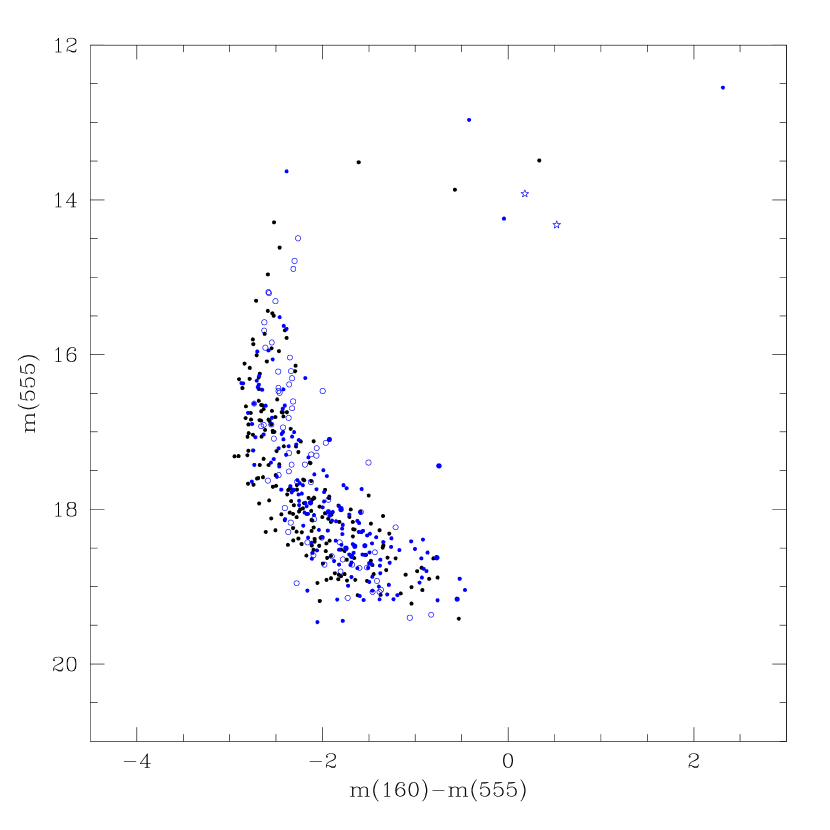
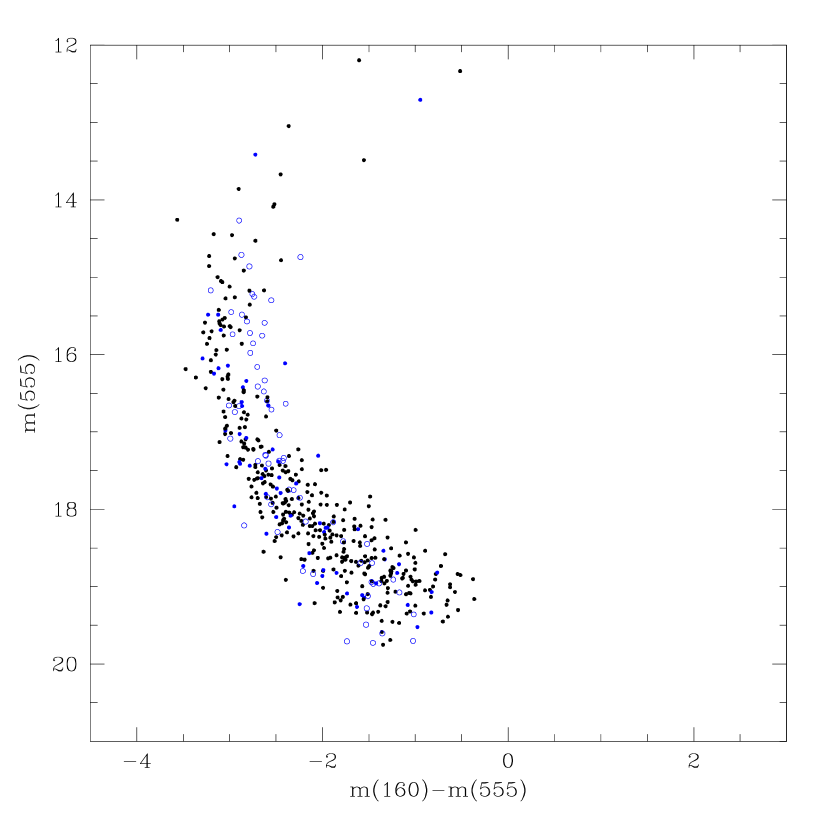
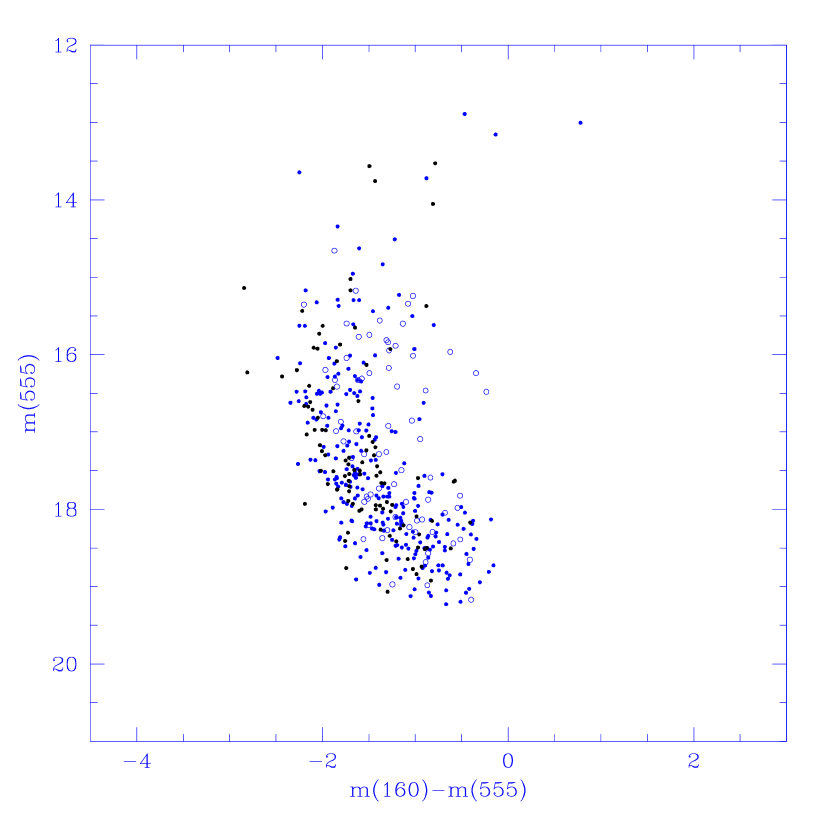
The colour-magnitude diagrams (CMDs) for NGC 330, 1818, 2004 and 2100 are shown in figures 3 - 6. Figure 3 demonstrates the most pertinent features. The MS is seen to terminate at F555W=15.5. A prominent clump of A supergiants is seen around F160BWF555W1.5. These are core He-burning blue supergiants. In the case of NGC 2004 and NGC 2100 there is little sign of a clump of A supergiants, rather the stars “flow” in a continuous manner from the tip of the MS. Note the omission of the red supergiant population, which is undetectable in F160BW. The CMDs show little sign of significant field contamination.
Attention is drawn to the group of hot and luminous stars within NGC 330 which are separated from the bulk of the cluster MS. The stars occupy a region bluer than the MS (F160BWF555W3.1 and 16.4F555W14.8). This region is that typically associated with the position of blue stragglers in lower mass clusters. Like blue stragglers in other clusters the central condensation of this population is remarkable; of the 8 stars all but one (B13 discussed in section 8) reside on the PC chip containing the cluster core (the corresponding figures for the total population are: 407 stars on the PC chip brighter than F555W19.0 and 339 on the WF chips). We tentatively identify these stars as blue stragglers.
The width of the main sequence is clearly greater than the estimated internal uncertainties discussed above. The width likely results from the combination of position dependent errors from the F255W flatfield (as discussed above), differential reddening across the cluster and the intrinsic width of the main sequence within each cluster, which is notably enhanced by the Be star population. The precise contribution of each component is impossible for us to separate. However we can gain an estimate of the relative importance of the three major constituents through an examination of NGC 1818.
In the study of NGC 1818 by Hunter et al. hunter (1997) presents photometry in F336W, F555W and F814W. The F336W filter (analogous to Johnson ) is a frequently used filter with well determined flatfield. Therefore let us assume that the width of the MS exhibited in the F336WF555W colour is due to differential reddening and the intrinsic width of the MS. The width of the MS in the photometry of Hunter et al. is =0.15mag (for stars 17F555W20). Using the colour excess ratios from Table 10 (discussed below) gives a corresponding =0.4mag in F160BWF555W. We see in Fig. 3 a width of 0.45mag for 16F555W18. We conclude from this that flatfield errors are a relatively minor contributor to the dispersion evident in our CMDs. We consider a =0.1mag an appropriate estimate for the uncertainty introduced by flatfield errors in our quoted F160BWF555W colours.
The effects of differential reddening is undoubtably the major contributor to the large width of the MS in the case of NGC 2100. The cluster lies in the vicinity of 30 Dor, a region filled with complex nebulosity. The width of the upper main sequence is 0.6 and assuming 0.3 is due to intrinsic width of the MS and flatfield noise this implies a E()0.04; a large but not unreasonable amount.
We have undertaken new IR photometry of these clusters described in detail in Keller (1999b ). The IR colours provide a valuable check on our WFPC2 colours for the brighter members. An examination of the and F160BWF555W colours has revealed a number of systems within the clusters which consist of a binary pair of red supergiant and MS stars. These possess F160BWF555W 0-1, closely matched to those of the A supergiants, and colours indicative of a red supergiant. The F160BWF555W, colours of these systems are the consequence of the combined light in F555W but the light of only one member in F160BW and , namely the blue MS star in F160BW and the red supergiant in . The systems highlighted as such are: in NGC 330:A52 and NGC 1818:A18 and A95.
7 Transformation to the H-R Diagram
Transformation of our measured F160BWF555W colours and F555W magnitudes into temperatures and luminosities was made through interpolation into a grid of synthetically derived colours and bolometric corrections. Distance moduli for the SMC and LMC were taken as 18.85 and 18.45 respectively, in line with current determinations. The theoretical colours were computed for the revised Kurucz (1993) fluxes used in Bessell, Castelli & Plez (bessell98 (1998)) and described in more detail by Castelli (castelli99 (1999)). The non-solar metallicity is taken into account within these models ([Fe/H]=-0.5 LMC; [Fe/H]=-1.0 SMC). In lower metallicity colours are bluer for a given temperature. For example, a star of 20000K in both the SMC and LMC, appears 0.02 magnitudes bluer in the SMC.
For models cooler than 8000K the NOOVER grid of fluxes were used. The passbands used were those in /cdbs/cdbs6/synphot_tables/ and obtained via ftp from ftp.stsci.edu. We computed the magnitudes for the F160BW, F336W, F439W, F450W, F555W, F675W, F814W bands using a synthetic photometry program that integrated the relative photon numbers for the various WFPC2 bands. The zeropoints were adjusted to produce 0.04 mag for all bands with the Castelli & Kurucz (castellikurucz (1994)) spectrum of Vega (/log g/[Fe/H]/ = 9550/3.95/-0.5). The UBVRI magnitudes were computed through energy integration using the passbands of Bessell (bessell90 (1990)). These magnitudes were also normalised to +0.04. Table 10 (available from ADS) lists the grid of colours and bolometric corrections.
To evaluate the effect of interstellar reddening we used the extinction curves of Mathis (Mathis90 (1990)) for the Galaxy, Nandy et al. (Nandy81 (1981)) for the LMC and Prevot et al. (Prevot84 (1984)) for the SMC. The LMC and SMC curves were extrapolated to 90nm and set equal to the galactic curve for the wavelengths redder than . The galactic curve for diffuse dust (R() = A()/E()= 3.1) was used. We interpolated into the 22 magnitude ratios A()/E() of the extinction curves to produce multiplicative factors at each of the 1221 Kurucz wavelengths for attenuating the model fluxes. Figure 8 shows the extinction curve for the optical and UV wavelengths. The colour excess ratio of E(F160BWF555W) to E() under the different reddening regimes is given in Table 6.
The interstellar reddening to the four clusters was constrained by the position of the MS in the CMD. The line of sight reddening was adjusted to achieve a match between the essentially unevolved MS and that predicted by standard evolutionary models. The reddening to both the LMC and the SMC were considered in two components, half of the total reddening to galactic absorption and the remainder due to intra-Cloud absorption. It was apparent that the “SMC” extinction curve was not appropriate for NGC 330 as it produced too large a F160BW extinction for the probable E(). We adopted the LMC extinction curve for NGC 330. Table 7 reports the values of reddening found in the present study. Uncertainties in these values are of the order of 0.02 mag. The values are in agreement with values in the literature.
7.1 Effective Temperatures for the Be Star Population
As can be seen in figures 3 - 6 the Be population forms a secondary sequence at apparently cooler temperatures than the mean locus of non-emission stars in each cluster. The presence of a circumstellar envelope around Be stars is known to give rise to flux excess in various optical and infra-red bands. For this reason it is not clear that the observed colours and visual magnitudes are representative of the effective temperature and luminosities of the underlying star.
We have sought an appropriate method for removing the effect of the circumstellar reddening on the underlying star within the Be system. Numerous studies have revealed that the flux emitted by a Be star in the band is stronger than emitted by a similar B star without emission due to Balmer continuum emission (Zorec & Briot zorec91 (1991); Kaiser kai89 (1989)). A similar study by Zorec and Briot (zor85 (1985)) in the UV revealed no such excess in UV flux amongst Be stars. This study made a comparison of monochromatic magnitudes at =1460Å which is fortuitously close to the central wavelength of the F160BW filter. This simplifies our task considerably: we can consider (F160BWF555W)=F555W. Since the excess arises from the circumstellar disk one would expect that the excess would scale as the apparent surface area of the disk. In the same way the strength of H emission is similarly related to the apparent surface area. Zorec and Briot (zor85 (1985)) show a clear correlation between excess and H emission strength.
We have used the details of this correlation and the F555WF656N colours of the Be stars within our sample to establish a excess for each object. In order to do so it was first necessary to calibrate the F555WF656N in terms of the H emission strength. This was achieved through the use of the H equivalent widths described in Keller et al. (be330 (1998)) obtained three months following the present observations. Conceivably, during this length of time the emission strength of some of the sample may have changed, however this does not appear to seriously degrade the correlation between the F555WF656N colours and the H emission strength.
The excess for each object from the above procedure has been applied to F555W and to the F160BWF555W colours for each object, making the Be stars fainter and bluer. The figures 10 - 13 show the resulting HR diagrams, in which it is clear that the Be population has been rectified, within observational uncertainties, to the locus of non-emission line stars. This gives us considerable confidence in the corrections we have applied to the Be stars within the CMD. These corrected colours are then transformed to the H-R diagram as described in section 7.
8 Comparison with Previous Determinations of Effective Temperature
A number of studies have previously determined temperatures for a sample of MS stars within these clusters. They have used a variety of techniques: the studies of Caloi et al. (caloi95 (1995); NGC 2004 and NGC 330) and Bohm-Vitense et al (bohmvitense85 (1985); NGC 2100) were based upon IUE spectrophotometry while those of Lennon et al. (Lennon96 (1996)) and Reitermann et al. (Reitermann90 (1990)) are from spectroscopic analysis. Figure 9 compares the of these previous studies with that of our own. Three discrepant points stand out, they are A1 and B13 in NGC 330 and D22 in NGC 2004.
We have conducted spectroscopy of B13 and A1 using the Double Beam Spectrograph on the 2.3m telescope at Siding Spring Observatory. Our spectra consist of two simultaneously recorded segments, one blue (from 3400-4250Å), the other centred on H (6200-6800Å) at a resolution of (0.6Å/px). We spanned the Balmer discontinuity in our blue spectra to enable an independent assessment of effective temperature.
B13 has a temperature of 27 500K from our photometry, making it spectral type B0.5. In our HR diagram of NGC 330, B13 is placed in the region of blue stragglers. Spectroscopically, however, this star has been designated by Lennon et al. as B5III. The and colours of this system are also discrepant; an observed of 0.19 (Walker 1992) indicates a temperature of 30000K using the previously specified reddening, whereas the colour (0.85) gives 22000K. Our spectrum of this object shows a narrow, weak H emission (equiv. width = 9Å, FWHM = 1.6Å) which is markedly different from the majority of Be stars which in general exhibit much stronger and broader H lines. Lines of Si-IV are strong and the Balmer discontinuity is very small suggesting that the object is of spectral type B1.5-B0 in reasonable agreement with our photometric temperature. The H Balmer lines blueward of H show line cores that are unusually broad and flat. This is perhaps an indication that the object is an approximately equal mass binary system within an extended region of H emission. Further observations of this object with better signal to noise are required.
A1 has been designated B0.5III by Lennon et al. and Grebel et al. Our observations make it much cooler at 22 100K (i.e. B2; Bessell et al. bessell98 (1998)). Spectroscopically A1 has a Balmer discontinuity too large and a Ca-II K feature too strong for B0.5III, rather we consider it to be B2III, in line with our derived temperature. Existing photometric colours have little to add, gives a of 30 000K whilst gives 22 000K.
The third most discrepant point is that of D22 in NGC 2004. In the study of Caloi and Cassatella, the determination of the temperature of D22 in NGC 2004 was recognised as problematic (see discussion therein) due to the apparently discrepant colour.
If we leave aside these three most discrepant points we are left with a scatter which we consider represents the relative accuracy of temperature determinations drawn from optical and IUE spectroscopy. It is also apparent that there is a minor systematic offset of our temperatures relative to that of previous studies, in the sense that our temperatures are slightly cooler. This amounts to 1500K at 25000K (i.e. 6%) which is unlikely to be significant given the uncertainties in previous measurements at such temperatures.
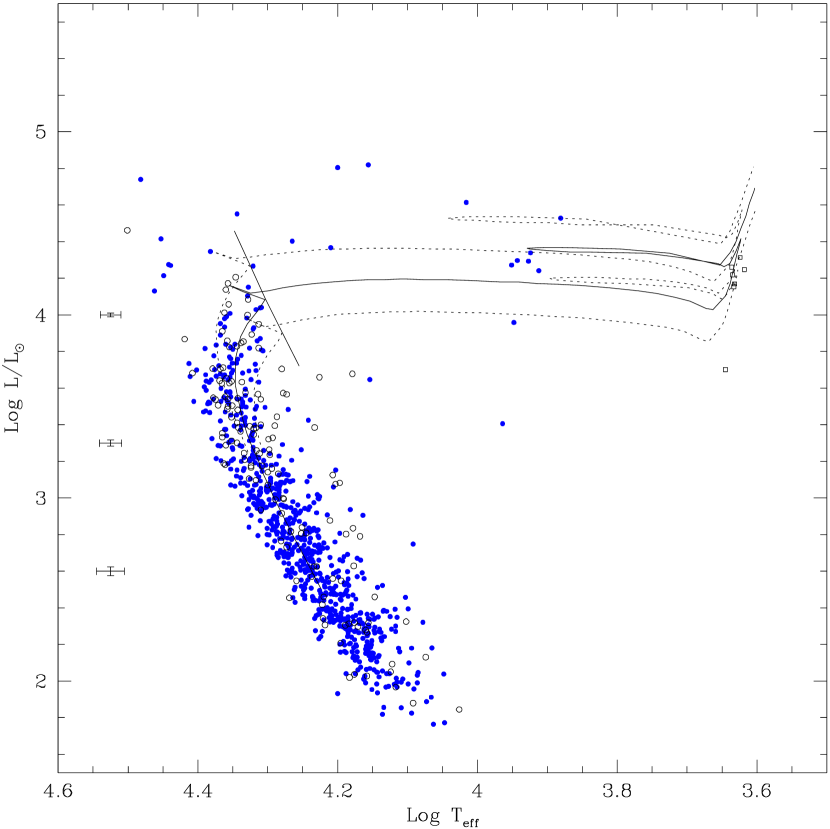
9 H-R Diagrams
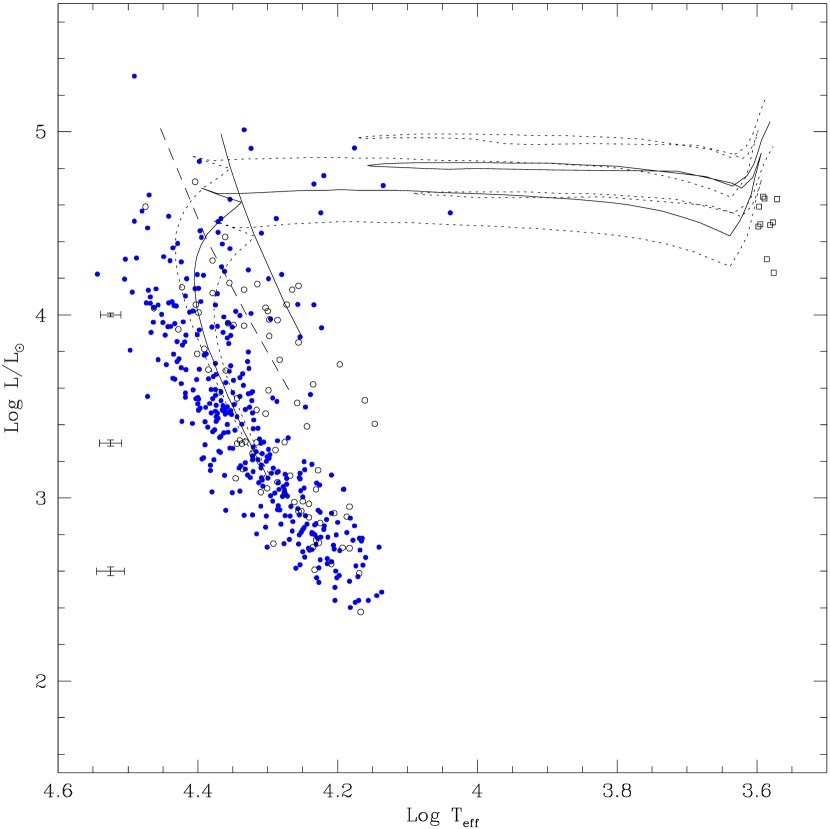
The resultant H-R diagrams are shown in figures 10 - 13. Also shown in figure 10 are typical error bars for data points on the MS. The red supergiant (RSG) population shown in these figures is that contained within the WFPC2 field. Effective temperatures and luminosities for the RSG are taken from Keller et al (1999b ). We briefly discuss some of the implications of the H-R diagrams here with reference to previous observations; detailed discussion is deferred to Keller et al. (1999c ).
Overlain are isochrones from Bertelli et al. (bert94 (1994)) at 0.1 dex spacing. Isochrones for Z=0.008 are used for the LMC clusters and Z=0.004 for NGC 330. The discrepancy in the temperature of the RSG is discussed in Keller et al (1999b ). The ages of the clusters indicated by these isochrones are of order log age=7.2 for NGC 2004 and NGC 2100, 7.4 for NGC 1818 and 7.5 for NGC 330. These ages are within the range of ages determined in previous works.
In their study of NGC 330, Chiosi et al (choisi95 (1995)), claim that the cluster data does not permit discrimination between convective criteria. They are unable to fit the cluster CMD with a single age and require instead a large spread of ages within the cluster. To a large degree this can be put down to the insensitivity of the () colour to the temperatures in the vicinity of the MS turnoff. The presence of Be stars, which have discrepant colours, in the vicinity of the MS turnoff distracts further from the clarity of the turnoff. This makes for a broad turnoff, which enables a range of model isochrones to fit. Our data is a significant improvement upon this. We also note that the tight grouping of the RSGs in these diagrams is inconsistent with a large age spread.
Within NGC 2004, Caloi and Cassatella (caloi95 (1995)) find that the luminosities of the upper MS stars are inconsistent with these being progenitors of the RSGs observed within the cluster. The latter concern is resolved by the IR photometry of Keller et al. (1999b ), which finds the temperatures of these red supergiants to be of the order of 400K cooler than previously determined. The consequent change in bolometric correction has brought the luminosity of the RSGs into line with the top of the MS.
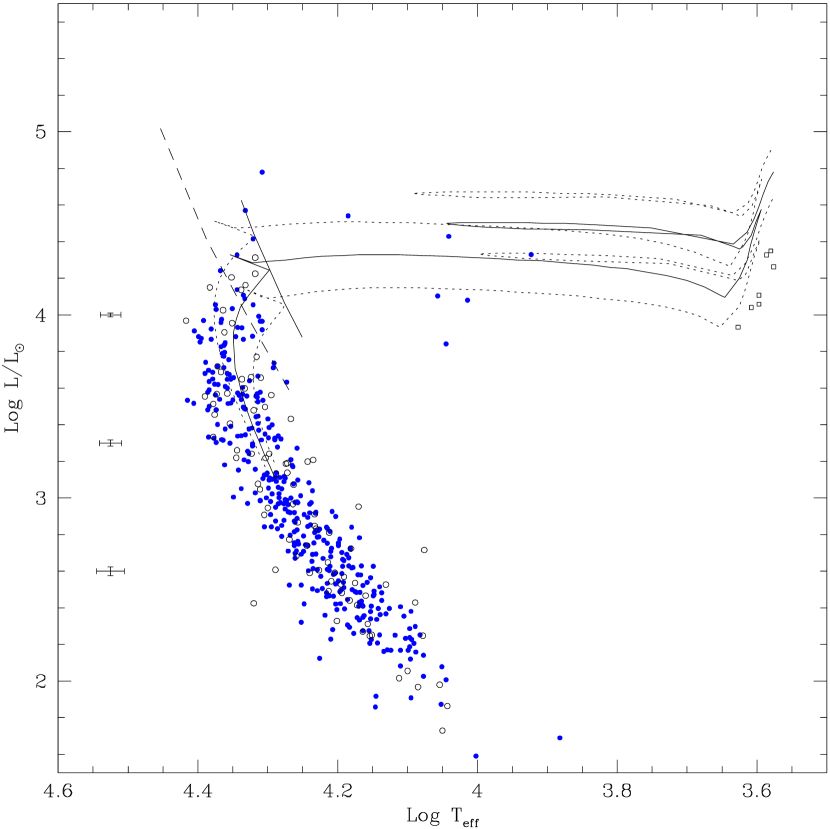
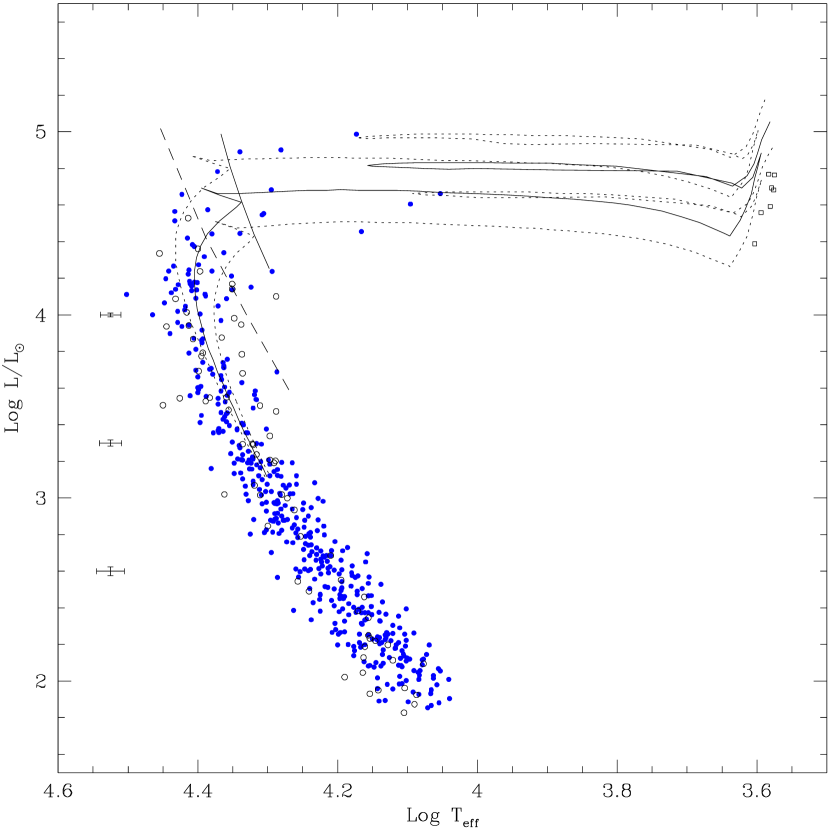
In figures 10 - 13 we show the redward boundary of the MS for standard “moderate” overshoot models (solid line - this is the stage B of Bertelli et al. bert94 (1994)) and in figures 11 - 13 models without convective core overshoot (Alongi et al padova (1993)). The region redward of this boundary and bluer than the evolved A supergiants is a region which according to evolutionary models is traversed rapidly. This region, the Blue Hertzsprung Gap (BHG), is expected to be devoid of stars. It is clear from the HRDs that the no overshoot models fail to match the density in this region. The predictions of standard overshoot models provide a closer match. This necessity for a degree of overshoot is in agreement with previous IUE studies of Caloi et al. (caloi93 (1993)) and Caloi and Cassatella (caloi95 (1995)).
Whilst the standard overshoot models provide a closer match to the observations a number of stars are seen in the four HRDs, which remain within the BHG. The duration of evolution from the red edge of the MS to temperatures cooler than the tip of the blue loop tracks is very rapid, it accounts for 0.07% of the total lifetime for a 12 star (Fagotto et al. fbbc (1994)). Consider the HRD of NGC 2004. Here we see six stars clearly within the BHG. The time spent in the BSG+RSG phases for such a star is 78 times longer than the traversal of the BHG. With thirteen BSG+RSG present we would expect on this basis to find 0.2 stars present within the BHG.
The existence of populations within the BHG has been noted previously, the controversy over their evolutionary status remains. Grebel et al (grebel96 (1996)) in their study of NGC 330 have suggested that the population of stars within the BHG is a mixture of rapidly rotating B/Be stars and blue stragglers. In the light of our accurate determination of effective temperatures we can rule out the possibility that these stars are blue stragglers. Neither are any of the interloping stars in this region Be stars from our study or at several other observational epochs (see Keller et al. 1999a ). Four of these BHG interlopers, A01, B22 and B30 in NGC 330 and D12 in NGC 1818, have been the focus of spectroscopic studies (Reitermann et al Reitermann90 (1990), Lennon et al. Lennon96 (1996), Korn et al. kor99 (1999)). These stars appear as normal B type stars, albeit some with evidence of a N overabundance.
As discussed above, the temperature and luminosity of the terminus of the MS is particularly sensitive to the degree of extension of the convective core. Perhaps the stars within the BHG are an extension of MS evolution to the red brought about by a degree of internal mixing in excess of that prescribed in standard overshoot models. A more detailed analysis is required in this regard and will be presented in our subsequent paper.
10 Summary
Our WFPC2 photometry of NGC 330, 1818, 2004 and 2100 has shown that these clusters form an excellent testing ground in which to examine a number of outstanding issues in stellar evolution. The unprecedented resolution offered by the WFPC2 camera provides us with a sample of sufficient size to enable a statistically meaningful confrontation with standard evolutionary models. The far-UV coverage has provided good temperature estimates for the hot main sequence population. With this information it should be possible to ascertain the presence and amount of internal mixing due to convective core overshoot expressed in the population with the present data.
| Cluster Name | File Number | filter | exp. time | |
| NGC 330 | U3JS0101M | F555W | 1.6s | |
| NGC 330 | U3JS0102M | … | 10s | |
| NGC 330 | U3JS0103M | F160BW | 100s | |
| NGC 330 | U3JS0104M | … | 800s | |
| NGC 330 | U3JS0105M | … | 800s | |
| NGC 330 | U3JS0106M | F656N | 400s | |
| NGC 1818 | U3JS0201M | F555W | 1s | |
| NGC 1818 | U3JS0202M | … | 6s | |
| NGC 1818 | U3JS0203M | F160BW | 60s | |
| NGC 1818 | U3JS0204M | … | 60s | |
| NGC 1818 | U3JS0205M | … | 400s | |
| NGC 1818 | U3JS0206M | … | 400s | |
| NGC 1818 | U3JS0207M | … | 400s | |
| NGC 1818 | U3JS0208M | F656N | 350s | |
| NGC 2004 | U3JS0301M | F555W | 1s | |
| NGC 2004 | U3JS0302M | … | 6s | |
| NGC 2004 | U3JS0303M | F160BW | 60s | |
| NGC 2004 | U3JS0304M | … | 60s | |
| NGC 2004 | U3JS0305M | … | 400s | |
| NGC 2004 | U3JS0306M | … | 400s | |
| NGC 2004 | U3JS0307M | … | 400s | |
| NGC 2004 | U3JS0308M | F656N | 350s | |
| NGC 2100 | U3JS0401M | F555W | 1s | |
| NGC 2100 | U3JS0402M | … | 6s | |
| NGC 2100 | U3JS0403M | F160BW | 60s | |
| NGC 2100 | U3JS0404M | … | 60s | |
| NGC 2100 | U3JS0405M | … | 400s | |
| NGC 2100 | U3JS0406M | … | 400s | |
| NGC 2100 | U3JS0407M | … | 400s | |
| NGC 2100 | U3JS0408M | F656N | 350s |
| Locality | A | B |
|---|---|---|
| Galaxy | 5.01 | -0.085 |
| LMC | 6.97 | -0.153 |
| SMC | 8.02 | -0.204 |
| Cluster Name | E() |
|---|---|
| NGC 330 | 0.08 |
| NGC 1818 | 0.08 |
| NGC 2004 | 0.08 |
| NGC 2100 | 0.26 |
| F555W 19 | 16.5 F555W 19 | F555W 16.5 | |||
|---|---|---|---|---|---|
| Cluster | NMS | NBe | NBe/NMS | NBe/NMS | NBe/NMS |
| NGC 330 | 566 | 100 | 0.180.02 | 0.150.02 | 0.430.10 |
| NGC 1818 | 383 | 54 | 0.140.02 | 0.120.02 | 0.270.08 |
| NGC 2004 | 415 | 47 | 0.110.02 | 0.080.02 | 0.250.06 |
| NGC 2100 | 402 | 52 | 0.130.02 | 0.100.02 | 0.260.05 |
References
- (1)
- (2) Alongi, M., Bertelli, G., Bressan, A., Choisi, C., Fagotto, F., Greggio, L. & Nasi, E. 1993, A&AS 97, 851.
- (3) Balona, L.A. 1992, MNRAS 256, 425
- (4) Bencivenni, D., Brocato, E., Buonanno, R. & Castellani, V. 1991, AJ 102, 137.
- (5) Bertelli, G., Bressan, A., Chiosi, C., Fagotto, F., & Nasi, E. 1994, A&AS 105, 29.
- (6) Bessell, M.S. 1990, PASP 102, 1181.
- (7) Bessell, M.S., Castelli, F. & Plez, B., 1998, A&A 333, 231.
- (8) Biretta, J. & Baggett, S. 1998, STScI STAN/WFPC2, no.33, August.
- (9) Bohm-Vitense, E., Hodge, P. & Proffitt, C., 2985, ApJ 292, 130.
- (10) Bressan, A., Bertelli, G., & Chiosi, C. 1981, A&A 102, 25.
- (11) Caloi, V. Cassatella, A., Castellani, V. & Walker, A. 1993, A&A 271, 109.
- (12) Caloi, V. & Cassatella, A. 1995, A&A 295, 63.
- (13) Castelli, F. & Kurucz, R.L. 1994, A&A 281, 817.
- (14) Castelli, F. 1999 A&A 346, 564.
- (15) Chiosi, C, Vallenari, A., Bressan, A., Deng, L. & Ortolani, S. 1995, A&A 293, 710.
- (16) Fagotto, F., Bressan, A., Bertelli, G. and Chiosi, C., 1994, A&AS 105, 29.
- (17) Grebel, E.K., Richtler, T. & de Boer, K.S. 1992, A&A 254, L5.
- (18) Grebel, E.K., Roberts, Wm J. & Brandner, W. 1996, A&A 311, 470.
- (19) Grebel, E.K. 1997, A&A 317, 448.
- (20) Holtzman, J. et al. 1995, PASP 107, 156.
- (21) Holtzman, J. et al. 1995, PASP 107, 1065.
- (22) Hunter, D.A., Light, R.M., Holtzman, J.A., Lynds, R., O’Neil, E.J. & Grillmar, C.J. 1997, ApJ 478, 124.
- (23) Kaiser, D. 1989, A&A 222, 187.
- (24) Keller, S.C. & Bessell, M.S. 1998, A&A 340, 397.
- (25) Keller, S.C., Wood, P.R., & Bessell, M.S. 1999a, A&AS 134, 489.
- (26) Keller, S.C. 1999b, AJ 118, 889.
- (27) Keller, S.C., Bessell, M.S. & DaCosta, G. 1999c, in preparation.
- (28) Keller, S.C., Bessell, M.S. & DaCosta, G. 1999d, in “The Be Phenomenon in Early Type Stars”, IAU Coll. 175, Alicante (Spain), eds. M. Smith, H. Henrichs, and J. Fabregat, PASP.
- (29) Kjeldsen, H., & Baade, D. 1994, in “Pulsation, Rotation and Mass Loss in Early-Type Stars”, IAU Symp. 162, Eds. L.A. Balona, H.F. Henrichs, & J.M. Contel (Kluwer: Dordrecht), p 271.
- (30) Korn, A.J., Becker, S.R., Gummersbach, C.A. and Wolf, B. 1999, A&A in press.
- (31) Kurucz, R.L., 1993, data on CDROM.
- (32) Langer, N & Heger, A. 1998, “Boulder-Munich II: Properties of Hot, Luminous Stars”, ed. Ian Howarth, ASP Conference Series vol. 131 (San Francisco), p. 76
- (33) Lennon, D. J., Dufton, P.L., Mazzali, P. A., Pasian, F. & Marconi, G. 1996, A&A 314, 243
- (34) Maeder, A. 1998, in “Hot stars in open clusters of the Galaxy and the Magellanic Clouds” (La Plata, Argentina, December 1997).
- (35) Maeder, A., Grebel, E.K., & Mermilliod, J-C. 1999, A&A 346, 459
- (36) Mathis, J.S. 1990, ARA&A 28, 37.
- (37) Nandy, K., Morgan, D.H., Willis, A.J., Gondhalekarm P.M. 1981, MNRAS 196, 955.
- (38) Prevot, M.L., Lequeux, J., Maurice, E., Prevot, L., Rocca-Volmerange, B. 1984, A&A 132, 389.
- (39) Reitermann, A., Stahl, O., Wolf, B. & Baschek, B. 1990, A&A 234, 109
- (40) Robertson, J.W. 1974, A&AS 15, 261.
- (41) Sagar, R., Richtler, T. & de Boer, K.S., 1991, A&AS 90, 387.
- (42) Sebo, K.M. & Wood, P.R. 1994, AJ 108, 932
- (43) Talon, S., Zahn, J-P., Maeder, A. & Meynet, G., 1997, A&A 322, 209.
- (44) Walker, A. 1992, Private Communication.
- (45) Watson, A.M., et al. 1994, ApJ 435, L55.
- (46) WFPC2 group, 1997, “SYNPHOT “photflam” and “zeropoint” Values:”, http://www.stsci.edu/ftp/instrument_news/ WFPC2/Wfpc2_phot/wfpc2_photlam.html.
- (47) Whitmore, B., & Heyer, I. 1997, Instrument Science Report WFPC2 97-08.
- (48) Whitmore, B. 1997, in proc. HST Calibration Workshop, eds. S.Casertano et al., STScI.
- (49) Will, J-M., Bomans, D.J. & de Boer, K.S., A&A 295, 54.
- (50) Zorec, J. & Briot, D. 1991, A&A 245, 150.
- (51) Zorec, J. & Briot, D. 1985, RMxAA 10, 317.