Radio galaxy evolution: what you can learn from a Brief Encounter
Abstract
We describe the pitfalls encountered in deducing from classical double radio source observables (luminosity, spectral index, redshift and linear size) the essential nature of how these objects evolve. We discuss the key role played by hotspots in governing the energy distribution of the lobes they feed, and subsequent spectral evolution. We present images obtained using the new 74 MHz receivers on the VLA and discuss constraints which these enforce on models of the backflow and ages in classical doubles.
, , , &
1 Introduction
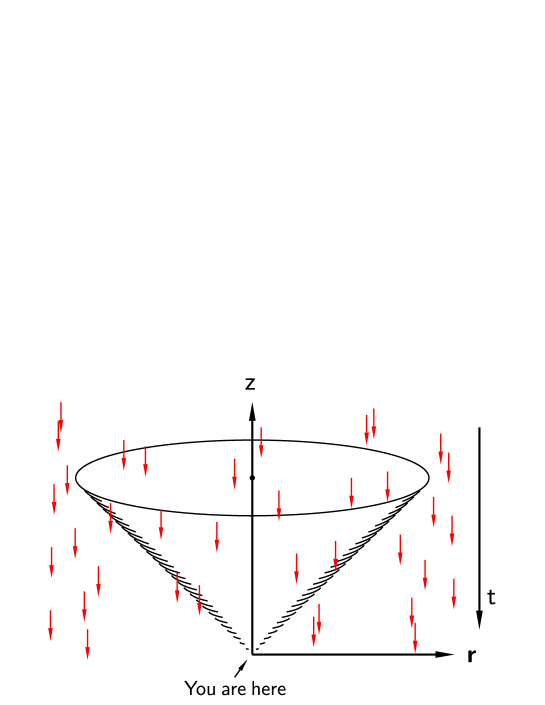
To identify the true nature of the ways in which radio galaxies grow and evolve is not a trivial problem to tackle: we cannot observe any radio galaxy at well-separated intervals throughout its life. We can only make observations of a particular radio galaxy if it intercepts our light-cone. Whether or not any radio galaxy is intercepted by our light-cone, and at what point in its life, is entirely random. Fig. 1 schematically illustrates the randomness of the sampling of any radio galaxy by our light-cone.
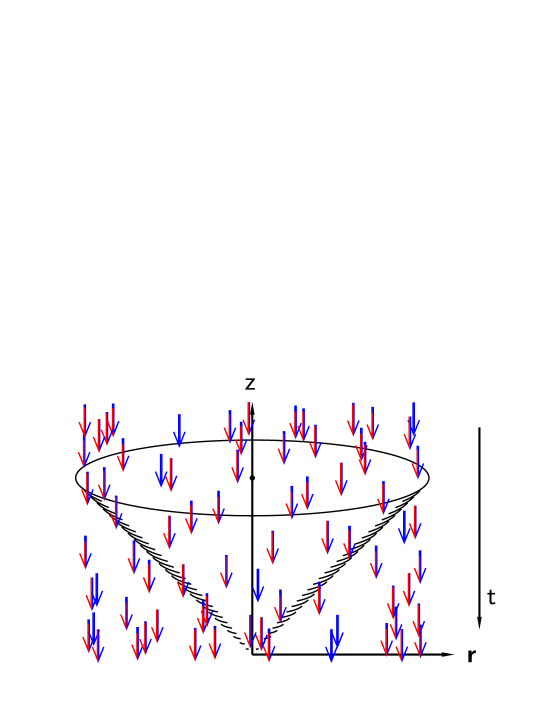
Unavoidably imposed on the random sampling by our light-cone is the effect of more selective sampling of the radio galaxy population determined by the finding-frequency of the survey. Different frequencies even within the radio regime, for example 151 MHz and 1.4 GHz, find different populations with rather different selectivities: added complexities come from the fact that across different radio-frequency regimes different physical processes are responsible for the emission. This is schematically illustrated in Fig. 2. At low frequency (e.g. 151 MHz) emission is largely isotropic while at GHz regimes Doppler boosting preferentially selects objects with a small angle to the light-of-sight. In this way objects having low intrinsic jet-powers may be found by the survey. With GHz surveys very young sources such as GPSs/CSOs may be found which are synchrotron self-absorbed or free-free absorbed at lower frequencies.
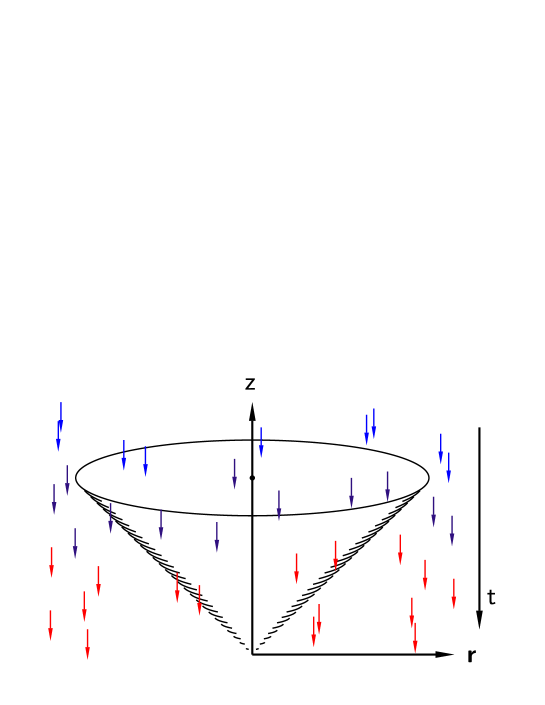
Unfortunately, the effect of a single finding-frequency varies as a function of the redshift of the sources being surveyed. For a given survey finding-frequency , the emission of a given radio galaxy at redshift is sampled at rest-frame , as illustrated in Fig. 3. For objects characterised by steep spectra, this makes their detection at high redshift harder for a given observing frequency sensitivity.
2 No direct evidence for luminosity evolution?
Direct evidence for luminosity evolution in classical doubles, for example the decreasing luminosity of a radio galaxy with increasing size, could not be possible as Fig. 1 simply demonstrates: no radio galaxy has more than a Brief Encounter with our light cone. We cannot make well-spaced measurements along the time-axis of any given radio galaxy.
Even if two properties such as luminosity and linear size might be closely related within an individual source, it does not follow that an anti-correlation will be manifested in the luminosities and linear sizes of a sample of many radio sources. The finding of Neeser et al. (1995) that the luminosities and linear sizes of classical doubles from two complete samples, 3C and 6C, are uncorrelated (which is substantiated by our own study of three complete samples (3C, 6C and also 7C) in Blundell, Rawlings & Willott 1999, see §5.6 therein) should not be taken as the absence of evidence of a dependence of source luminosity on source size/age. Absence of evidence of such a dependence would not in any case constitute evidence of absence of such a dependence. In order to establish a full picture of the essential nature of how a radio galaxy evolves as it gets older, it is essential to correctly understand the influence of the sampling functions of the surveys and to correctly measure the radio source observables (luminosity, spectral index, redshift and linear size). We now address these issues.
3 Sampling biases
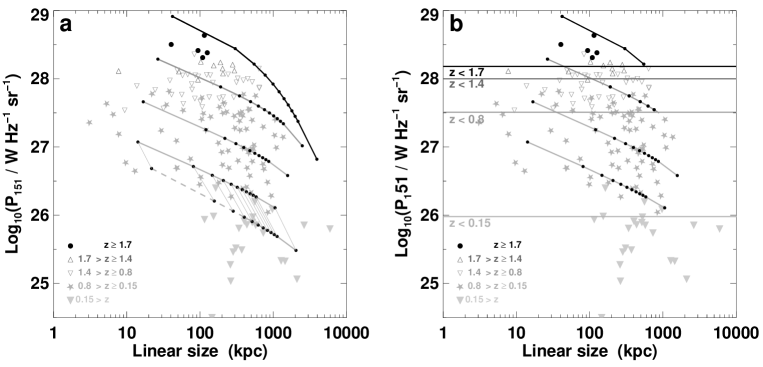
The consequences of a flux-limit, together with the rarity of classical doubles in the local Universe, mean that for a single sample, such as 3C, there will be a tight correlation between the luminosities () and redshifts () of the members of that sample. This is known as the – degeneracy. This is illustrated in the left panel of Fig. 4, which shows the distribution on the – plane of sources from the samples studied by Leahy, Muxlow & Stephens (1989) and Liu, Pooley & Riley (1992). Though these are two different samples, they are both drawn from the 3C sample and subject to the - degeneracy which afflicts the 3C or any other single flux-limited sample. Developing models of radio sources based on just such a set of sources runs the risk of modelling the selection effect of the – degeneracy.
To circumvent such a problem, we have increased coverage of the – plane by using complete samples of radio sources which are selected at lower flux-limits (Rawlings et al. 1998). While the flux-limit of the 3C sample is 12 Jy at 151 MHz, the flux-limit of the faintest sample (7C) is 0.5 Jy. The substantial improvement in coverage of the – plane achieved in this way is illustrated by the right panel in Fig. 4.

4 Measurement of source properties
4.1 Spectral index
The integrated spectrum of a classical double radio source is usually either concave (see Fig. 5) or described by a simple power-law. In order to properly measure the spectral index at a common rest-frame frequency, it is necessary to fit the curvature of the spectrum and perform a -correction to take account of the redshifted sampling of the spectrum. We performed spectral fitting and -corrections as described in Blundell, Rawlings & Willott (1999) to all members of the 3C, 6C and 7C complete samples used in our study, after obtaining from the literature flux-density measurements for each object at 365 MHz, 408 MHz, 1.4 GHz and 4.86 GHz in addition to measurements from our own VLA observations and from the survey measurements at 151 MHz. Hereafter in this paper we refer to the instantaneous slope of the flux-density – frequency plot evaluated at rest-frame 151 MHz as the spectral index at 151 MHz or , and evaluated at rest-frame 5 GHz as the spectral index at 5 GHz or .

4.2 Luminosity
Luminosity is not as fundamental a property of a radio source as jet-power is. This is because in addition to depending on the details of the environment into which the source is expanding, luminosity also depends on the frequency regime in which the luminosity is being evaluated and on the age of the source, even if the bulk kinetic jet-power remains constant. In the context of comparisons between radio-loud and radio-quiet quasars we discuss how luminosity at GHz frequencies is a poor indicator of the underlying jet-power (Blundell & Rawlings, in prep.); this is especially but not exclusively true for those objects having significantly Doppler boosted core emission. For the study we describe here, all luminosities are evaluated at rest-frame 151 MHz, following the spectral fitting procedure mentioned in §4.1.
4.3 Redshift
Many previous studies of samples of radio sources have required the use of redshift estimators for a significant fraction of the sample (e.g. Dunlop & Peacock 1990). The most common estimator employs the –band (2.2 m) magnitude. Use of this estimator is motivated by the small spread in the near-infrared Hubble Diagram (– relation) for radio galaxies in the 3C sample (Lilly & Longair 1984; Best, Longair and Röttgering 1998). It is now known that simple extrapolation of the 3C relation to higher redshifts and/or to fainter radio samples (which contain fewer radio luminous sources at any given redshift) leads to both large uncertainties in the estimated redshifts, and to systematic biases. For the sources in the 3C, 6C and 7C samples used in our study, the redshifts are almost exclusively spectroscopic. In the very few cases where we have been unable to secure spectroscopic redshifts we have estimated redshifts by obtaining multi-colour (optical and near-infrared) information and fitting spectral energy distributions (SEDs) with template galaxy spectra (e.g. Dunlop & Peacock 1993; Willott et al. in prep).
4.4 Linear size
Angular sizes of radio sources were measured by taking the sum of the separation from the core to each hotspot or, in the absence of a core, the hotspot-to-hotspot separation. Angular sizes were converted into linear sizes in the usual way (e.g. Carroll, Press & Turner 1992) for three different cosmologies.
5 Salient correlations and non-correlations
5.1 The – correlation
The low-frequency spectral index (evaluated at 151 MHz in the rest-frame) is less subject to the effects of synchrotron and inverse Compton losses off the CMB than higher-frequency spectral indices () evaluated in the GHz regime. As such, is a closer indicator of the energy distribution as initially injected than is . We find that there is no dependence on redshift of , as shown in Fig. 6 (upper panel).


5.2 The – correlation
In contrast with the picture in §5.1 an increased dependence of GHz spectral index is seen with redshift in Fig. 6 (lower panel). This points to the increasing importance of inverse Compton losses off the CMB with increasing redshift, which was first pointed out by Krolik & Chen (1991).
5.3 The – correlation
Fig. 7 shows that the greater the linear size of a radio source the steeper is its low frequency spectral index. This was the strongest correlation we found out of all of those we examined for the set of complete samples under study. We interpret this as being a consequence of adiabatic expansion losses and telling us that the magnetic fields decrease as the lobes expand, for the following reason. (We consider and reject other possibilities in Blundell, Rawlings & Willott 1999.) For a fixed observing frequency , the relationship between the Lorentz factor () of the particles giving rise to that emission and the ambient magnetic field is given by:
| (1) |
where is the charge on an electron and is its rest-mass. Thus as the magnetic field decreases, higher- particles will be responsible for radiation at that fixed observing frequency. Since for lobe emission the spectrum of the energy distribution of particles is steep and frequently curved these higher- particles will be from a steeper part of the energy distribution, and hence a higher rest-frame 151 MHz spectral index will be observed.

5.4 The – correlation
A correlation between the luminosities of classical doubles and their spectral indices was first suggested in 1960 by Heeschen, and more recently by Laing & Peacock (1980). We find this correlation to be present for the combination of 3C, 6C and 7C complete samples in the sense that the more powerful the radio source, the steeper is its low-frequency spectral index.
One way of depicting the – correlation is to show for the – plane the effects of low-frequency spectral index on the flux-limits and how sources from the different complete samples cluster around the flux-limits (see Fig. 8).

We have modelled this – correlation as coming from a dependence of the steepness of the energy distribution of particles injected into the lobe on jet-power. We do not presume that the injection spectrum is universally given by the canonical value of . We model the steepening of the energy distribution of particles as being controlled largely by classical synchrotron loss suffered in the high magnetic field of the hotspot. We specifically invoke that the hotspot magnetic fields are higher in those sources with higher jet-powers (as detailed in Blundell, Rawlings & Willott 1999). This point is discussed further by De Young (these proceedings). We choose to normalise this dependence of hotspot magnetic field on jet-power by assuming equipartition (of the energy in the particles and the energy in the magnetic field) in the hotspot (for which there is good evidence in the case of Cygnus A, Harris et al. 1994). We discuss further the role of the hotspot in §6.
5.5 The – correlation
The ‘linear-size evolution’ of radio sources has been known for many years (Kapahi et al. 1987, Barthel & Miley 1988). We find for our combination of complete samples selected at low frequency that the decrease of linear size with increasing redshift is quite mild, in the sense that the parameterisation of linear size at constant luminosity and spectral index is given by . We return to the physical mechanism responsible for linear-size evolution of classical double radio sources in §6.
5.6 The – plane
The - plane shows that there is no strong correlation between the luminosities and linear sizes of radio sources in the combination of complete samples. Given the sampling functions alluded to at the start of this paper which influence the nature of the objects which make it into our surveys, it should not be claimed that the absence of a correlation between and in any way might imply that for any given source as grows, will not evolve.

6 Refining models for luminosity evolution
We have formulated a model for evolving radio galaxies which reproduces the above dependencies, and others, and this is detailed in Blundell, Rawlings & Willott (1999). This model is the first model for radio galaxy evolution which incorporates the role played by the hotspot. This role has two aspects.
First, the magnetic field of the hotspot causes significant radiative losses on synchrotron particles during their dwell-time in the hotspot, in the period of time before they are injected into the lobe. We were led to this as discussed in §5.4 by our observation that the radio sources in our complete samples seemed to strongly indicate that the more luminous a radio-source was, the steeper its low-frequency spectrum was (for example, when evaluated at rest-frame 151 MHz). This rest-frame frequency regime is less affected by synchrotron and inverse Compton losses than the GHz regime and thus more closely informs us on the energy distribution of particles as initially injected into the lobe of a radio-source. Modelling a steeper spectrum in a more powerful source came naturally out of invoking stronger magnetic fields (hence stronger radiative losses) in sources with higher jet-powers. By equating the jet-thrust and the pressure in the compact hotspot, and invoking equipartition in the hotspot, we find that the magnetic energy density in the hotspot is proportional to the bulk kinetic power transported in the jet.
Second, as a plasma element expands out of a compact hotspot into a lobe whose pressure is considerably lower (and continues to become lower as the radio lobe expands and gets older) it suffers enhanced adiabatic expansion losses compared to the expansion losses suffered by that element of plasma once it continues to dwell in the lobe. This is consistent with observations of classical doubles which invariably show highly compact hotspots — embedded towards the outermost edges of the smooth, low surface-brightness, extended emission which comprises the lobe — albeit with a bewildering menagerie of shapes and structures (Leahy et al. 1997, Hardcastle et al. 1997 & Black et al. 1992).
The earliest (Scheuer 1974; Baldwin 1982) to the most recent (Kaiser, Dennett-Thorpe & Alexander 1997; Blundell, Rawlings & Willott 1999) models of radio source evolution, with reasonable assumptions about the environments into which radio sources expand, predict that the luminosity of any individual radio source decreases as time — or age — increases. This luminosity decline is enhanced when the role of the hotspot is included and illustrative ‘tracks’ across the – plane of radio sources with given jet-powers and redshifts are shown in Fig. 10.
A combination of the dramatically declining luminosity-with-age of the high- sources, their scarcity in the local Universe, together with the harsh reality of survey flux-limits means that very powerful sources with large linear sizes are rarely seen. This resolves the old problem first posed by Baldwin in 1982 that there is a dearth of large and powerful classical doubles. This problem had been a puzzle: intuitively [and as later modelled by Falle (1991)] the more powerful radio-sources were expected to expand faster than those with lower jet-powers, so the laws of probability alone suggest it should be easy to find large, powerful sources. But they are not: sources with and with are extremely rare in existing surveys (see Fig. 9).
7 The youth-redshift degeneracy
In a recent letter to Nature (Blundell & Rawlings 1999a) we demonstrated how declining luminosity tracks in combination with the consequences of applying a flux-limit at different redshifts would inevitably give rise to an effect which we termed the ‘youth-redshift degeneracy’: the fact that in a given flux-limited sample, those sources at higher redshift must be younger than their low redshift counterparts. This effect applies very strongly to powerful sources when the role of the hotspot is incorporated into the model – tracks, as described in §6.
The youth-redshift (YZ) degeneracy means it is necessary to be careful about the correct interpretation of ‘trends with redshift’. In many cases it is wrong to attribute such trends to changes in cosmic epoch when the effects arise because of source age. We consider briefly five such examples of effects which occur because the high redshift sources are young sources, and hence are being observed not long after the jet-triggering event (which is possibly a galaxy-galaxy merger, Sanders et al 1988).
Linear-size evolution and the YZ-degeneracy The linear size evolution observed in low-frequency flux-limited samples of classical double radio-sources (Kapahi et al. 1987, Barthel & Miley 1988, Blundell, Rawlings & Willott 1999) arises because the high– sources are younger, hence tend to be shorter. It is the positive dependence on jet-power of the rate at which the lobe-lengths grow (Falle 1991) which contributes to the linear size evolution being as mild as it is (see §5.5 and Blundell, Rawlings & Willott 1999).
Structural distortion and the YZ-degeneracy Barthel and Miley (1988) had suggested that higher redshift environments are denser and more inhomogeneous than at low redshift since they found increased distortion in the structures of their high- sample of steep-spectrum quasars compared with their low- sample. Sources which are younger may have the passage of their jets considerably more disrupted where there is a higher density and greater inhomogeneity in the ambient post-recent-merger environment. A general trend of denser inter-galactic environments at high- cannot be inferred from their result.
The alignment effect and the YZ-degeneracy Where the alignment effect of optical light along radio-jet axes is caused by star-formation, it will be more easily triggered close in to the host galaxy or within the product of a recent merger [assuming this is the jet-triggering event (Sanders et al 1988)] than at distances further out sampled by the head of an expanding radio-source later in its lifetime. Where the alignment effect is caused by dust-scattered quasar light, the certain youthfulness of distant radio-galaxies alleviates the near discrepancy (De Young 1998) between radio-source ages and the time-scale for which dust grains can survive in the presence of shocks caused by the advancing radio-jets. The youth–redshift degeneracy is consistent with the finding that the smallest sources in a sample of radio galaxies (all with very similar luminosities) are those which are most aligned with optical emission (Best et al 1996). Best et al. remarked that the sequence of changing optical aligned structure with increasing radio size could be naturally interpreted by comparing it with different phases of the interaction of the radio jets with the interstellar and intergalactic media as the radio-sources age.
Faraday depolarisation and the YZ degeneracy Garrington & Conway (1991) have found a tendency for depolarisation to be higher in sources at higher . Objects with higher which are younger will be in much more recently merged environments with the consequence that inhomogeneities in density or magnetic field will more readily depolarise the synchrotron radiation from the lobes. Moreover, higher- sources being younger and tending to be somewhat shorter will be closer in to the centre of the potential well. The higher density in this region will enhance the observed depolarisation.
The YZ degeneracy and dust emission Many of the highest- radio-galaxies have gas masses comparable to gas-rich spiral galaxies (Dunlop et al. 1994; Hughes et al. 1998) and inferred star-formation rates which, in the local Universe, are rivalled only by galaxy-galaxy mergers like Arp 220 (Genzel et al 1998). If high- objects are being viewed during a similar merging of sub-components the associated star formation could be responsible for a significant fraction of the stellar mass in the remnant galaxy. Since the high- radio-galaxies — those which Hughes et al. detected with SCUBA — are necessarily young ( years, see Fig. 10), and since the whole merger must take a few dynamical crossing times, or years, the implication is that the event which triggered the jet-producing central engine is synchronised with massive star formation in a gas-rich system, perhaps as material streams towards the minimum of the gravitational potential well of the merging system. The YZ degeneracy may help explain why few lower- radio-galaxies show similarly large (rest-frame) far-infrared luminosities compared to the high- population: they are being observed significantly longer after the jet-triggering event.
8 Where are the dying classical doubles?
Dead or relic classical doubles appear to be very rare. (Giovannini et al. 1988, Harris et al. 1995, Harris et al. 1993, Cordey 1987). That there are so few implies that the turn-off timescale, both for the cessation of jet-activity and for the depletion of highly relativistic particles, must be very rapid.
Once there is a cessation of jet-power, this implies that the radio source luminosity will decrease into oblivion. What will govern this decline in luminosity? The radio source will expand causing adiabatic losses in the ways described in §5.3 (see also Scheuer & Williams 1968), but the expansion of the plasma lobe can only occur on timescales consistent with the sound speed so this cannot be a rapid process. A rapid decay time does however come from considering the brevity of the radiative lifetimes of the synchrotron emitting particles.
To radiate at rest-frame 5 GHz in a magnetic field strength of 1 nT, equation 1 tells us that the required Lorentz factor of the electron is given by . The radiative lifetimes of synchrotron emitting particles are often purported to be years, but such values overlook the fact that the lobe of a radio source is an evolving entity and the adiabatic expansion losses (especially the decreasing magnetic field) discussed earlier mean that particles with increasingly higher are required to produce the emission at the same chosen frequency as the source ages. For example, in the situation above, a particle will emit most of its radiation at 5 GHz if the magnetic field strength is 1 nT. If the field lowers adiabatically to 0.1 nT then a particle whose Lorentz factor is is required to produce the emission at the same ‘observing frequency’ of 5 GHz. In a radio lobe, changes in the magnetic field go hand-in-hand with changes in the energies of the particles themselves since it is the expansion of the lobe which governs both. Thus the particle now radiating in the lower -field of 0.1 nT at 5 GHz with would, prior to the decrease in magnetic field strength, have had . The synchrotron cooling rate increases as , shortening the relevant radiative lifetimes further.
We explore quantitatively the radiative lifetimes of synchrotron emitting particles in Blundell & Rawlings (1999b), and find that they appear to be substantially shorter than source ages (see figure 1 of that paper). If we accept that the synchrotron radiative lifetimes are short then there is little difficulty explaining why synchrotron radiation in the GHz regime should cease on the same timescales. There would thus be no problem explaining the rarity of dead classical doubles.
But this picture leaves us with a problem in explaining how many large linear-size, low-powered radio sources have lobes with synchrotron emission often all the way back to the core. These sources are almost certainly the oldest examples of classical doubles which we currently know of and at distances of many 100s kpc from the hotspot, synchrotron emission is seen from particles with a radiative lifetime substantially shorter than the age of the source. Reconciliation of these has traditionally come from assuming a fast bulk backflow speed within the lobe which transports the relativistic particles away from the hotspot rather faster than the lobe itself advances away from the core. But this brings us to another problem with this standard picture: there must be a sink for all of this backflowing emission. As Jenkins & Scheuer (1976) first pointed out, if synchrotron losses play a major part in limiting lobe lengths, then lobes lengths (and by extension backflow reservoirs) should be longer and more extensive at low frequencies than at high frequencies.
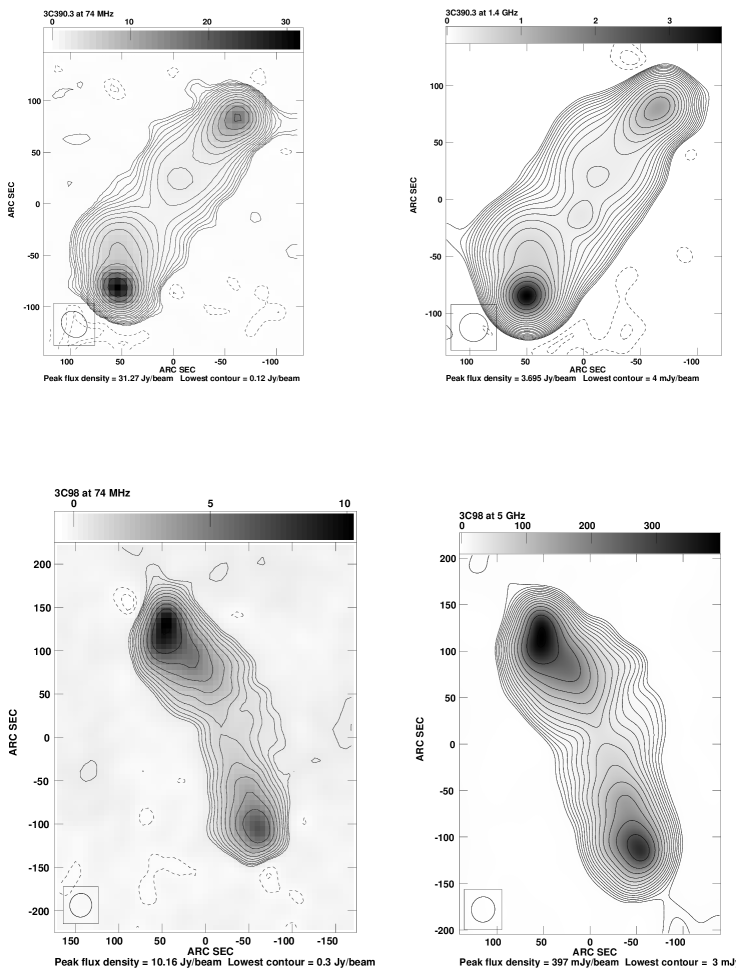
However, we do not find this to be the case. Images of bright 3C sources made using the new 74 MHz receivers on the VLA have remarkably similar silhouettes to fully sampled images at 1.4 GHz. Some examples are shown in Fig. 11 illustrating this, with images at GHz frequencies from the 3CRR Atlas Web-site (Leahy, Bridle & Strom 1996, http://www.jb.man.ac.uk/atlas) shown for comparison. These images show how the fractional contribution of the hotspots changes as a function of frequency and especially that there is no hint of any backflow emanating from the oldest parts of the lobes: in all of the 3C sources we have observed to date there is no evidence for any extended structure which is not already seen at GHz frequencies. A full set of these images together with associated spectral index maps and analysis will be presented in Kassim, Perley & Blundell (in prep.).
A rapid diffusion of the high Lorentz factor particles would reconcile the rapid disappearance of classical doubles (note that converting classical doubles into FRIs would be too slow a process to solve this problem) and the presence of synchrotron emitting material in lobes so far separated from the hotspot that their radiative lifetimes are shorter than the hotspot-travel-time from their location. Particle re-acceleration and inhomogeneous magnetic field strengths would only solve the latter, but not the former, problem. While it is clear that classical diffusion is too slow a process, other diffusion mechanisms which depend on the tangling scale and strength of magnetic fields within the lobes (such as that discussed by Duffy et al. 1995) merit further investigation.
Acknowledgements
K.M.B. thanks the Royal Commission for the Exhibition of 1851 for a Research Fellowship. Basic research in radio astronomy at the US Naval Research Laboratory is supported by the US Office of Naval Research. The VLA is a facility of the National Radio Astronomy Observatory operated by Associated Universities, Inc., under co-operative agreement with the National Science Foundation.
References
- [1] [] Baldwin, J.E. in Extragalactic radio sources (eds Heeschen, D.S. & Wade, C.M.) 21–24 (Proc. of the 97 IAU Symp. Reidel, Dordrecht, 1982).
- [2]
- [3] [] Barthel, P.D. & Miley, G.K., 1988, Nature, 333, 319
- [4]
- [5] [] Best, P.N., Longair, M.S. & Röttgering, H.J.A., 1996, MNRAS, 280, 9l
- [6]
- [7] [] Best, P.N., Longair, M.S., & Röttgering, H.J.A., 1998, MNRAS, 295, 549
- [8]
- [9] [] Black, A.R.S., Baum, S.A., Leahy, J.P., Perley, R.A., Riley, J.M., Scheuer, P.A.G., 1992, MNRAS, 256, 186
- [10]
- [11] [] Blundell, K.M. & Rawlings, S., 1999a, Nature, 339, 330
- [12]
- [13] [] Blundell, K.M. & Rawlings, S., 1999b, to appear in AJ
- [14]
- [15] [] Blundell, K.M., Rawlings, S. & Willott, C.J., 1999, AJ, 117, 677
- [16]
- [17] [] Carroll, S.M., Press, W., & Turner, E.L., 1992, ARAA, 30, 499
- [18]
- [19] [] Cotter, G., Rawlings, S. & Saunders, R., 1996, MNRAS, 281, 1081
- [20]
- [21] [] De Young, D. S., 1998, ApJ, 507, 161
- [22]
- [23] [] Duffy, P., Kirk, J.G., Gallant, Y.A. & Dendy, R.O., 1995, A&A, 302, l21
- [24]
- [25] [] Dunlop, J.S., & Peacock, J.A., 1990, MNRAS, 247, 19
- [26]
- [27] [] Dunlop, J.S. & Peacock J.A., 1993, MNRAS, 263, 936
- [28]
- [29] [] Dunlop, J.S., Hughes, D.H., Rawlings, S., Eales, S.A. & Ward, M.J, 1994, Nature, 370, 347
- [30]
- [31] [] Falle, S.A.E.G., 1991, MNRAS, 250, 581
- [32]
- [33] [] Garrington, S.T. & Conway, R.G., 1991, MNRAS, 250, 198
- [34]
- [35] [] Genzel, R., Lutz, D. & Tacconi, L., 1998, Nature, 395, 859
- [36]
- [37] [] Giovannini, G., Feretti, L., Gregorini, L. & Parma P., 1988, A&A, 199, 73
- [38]
- [39] [] Hardcastle, M.J., Alexander, P., Pooley, G.G. & Riley, J.M., 1997, MNRAS, 288, 859
- [40]
- [41] [] Harris D.E., Stern C.P., Willis A.G., Dewdney P.E., 1993, AJ, 105, 769
- [42]
- [43] [] Harris D.E., Carilli C.L. & Perley R.A., 1994, Nature, 367, 713
- [44]
- [45] [] Harris D.E., Willis A.G., Dewdney P.E., Batty J., 1995, MNRAS, 273, 785
- [46]
- [47] [] Heeschen, D.S., 1960, PASP, 72, 368
- [48]
- [49] [] Hughes, D.H., Dunlop, J.S., Archibald, E.N., Rawlings, S. & Eales, S.A. in Cosmological evolution of the submillimetre luminosity of high-redshift radio galaxies in The birth of galaxies (ed Guiderdoni, B.)
- [50]
- [51] [] Jenkins, C.J. & Scheuer, P.A.G., 1976, MNRAS, 174, 327
- [52]
- [53] [] Kaiser, C. R., Dennett-Thorpe, J. & Alexander, P., 1997, MNRAS, 292, 723
- [54]
- [55] [] Kapahi, V.K., Subrahmanya, C.R. & Kulkarni, V.K., 1987, J. Astrophys Astron., 8, 33
- [56]
- [57] [] Krolik, J.H. & Chen, W., 1991, AJ, 102, 1659
- [58]
- [59] [] Laing, R.A., Riley, J.M., & Longair, M.S., 1983, MNRAS, 204, 151
- [60]
- [61] [] Laing, R.A. & Peacock, J.A., 1980, MNRAS, 190, 903
- [62]
- [63] [] Leahy, J.P., Muxlow, T.W.B., & Stephens, P.W., 1989, MNRAS, 239, 401
- [64]
- [65] [] Leahy, J.P., Black, A.R.S., Dennett-Thorpe, J., Hardcastle, M.J., Komissarov, S., Perley, R.A., Riley, J.M., & Scheuer, P.A.G., 1997, MNRAS, 291, 20
- [66]
- [67] [] Lilly, S.J. & Longair, M.S., 1984, MNRAS, 211, 833
- [68]
- [69] [] Liu, R., Pooley, G. & Riley, J.M., 1992, MNRAS, 257, 545
- [70]
- [71] [] Neeser, M.J., Eales, S.A., Law-Green, J.D., Leahy, J.P., & Rawlings, S., 1995, ApJ, 451, 76
- [72]
- [73] [] Rawlings, S., Blundell, K.M., Lacy, M., Willott, C.J. & Eales, S.A., in ‘Observational Cosmology with the new radio surveys’, eds M.N. Bremer, N. Jackson and I. Pérez-Fournon, Kluwer Academic Publishers, p171, (1998).
- [74]
- [75] [] Sanders, D.B., Soifer, B.T., Elias, J.H., Madore, B.F., Matthews, K., Neugebauer, G. & Scoville, N.Z., 1988, ApJ, 325, 74
- [76]
- [77] [] Scheuer, P.A.G., 1974, MNRAS, 166, 513
- [78]
- [79] [] Scheuer, P.A.G. & Williams, P.J.S., 1968, ARAA, 6, 321
- [80]
Peter Barthel: Another explanation for the - correlation would be enhanced radiative efficiency in a hot confining medium (X-ray halo) such as is present around Cygnus A and proposed to boost its radio luminosity (Barthel & Arnaud, 1996, MNRAS, 283, l45). Cosmologically evolving halos (Gopal-Krishna & Wiita, 1991, ApJ) plus the bias would explain all the cosmological effects you attribute to youth. But, I do like your youth model — guess several mechanisms are at work…
Katherine Blundell: It is true that a more dense confining medium results in a higher radio luminosity (see Fig. 10, which shows how an order of magnitude increase in density will increase the radio luminosity by half an order of magnitude). It is not true that denser media will cause higher spectral indices to be observed, and especially not for low-frequency spectral indices. It is worth reminding ourselves that we are trying to explain an observed correlation of luminosity with low-frequency spectral-index. In fact the reverse effect will be important: for a more dense medium the expansion of the source is slower so the magnetic field does not fall off so quickly. In a higher magnetic field, lower Lorentz factor particles are responsible for the radiation at a fixed observing frequency. Given the usual shape of energy distributions in these objects (i.e. steep curved spectra), lower Lorentz factor particles will give rise to flatter not steeper spectra. Thus this mechanism cannot be responsible for the – correlation.
Paul Wiita: How large was the sample of sources from which you concluded there was no evidence for backflow at 74 MHz that wasn’t seen at 1.4 GHz?
Katherine Blundell: Just a dozen sources to date.
Paul Wiita: Some of the points you made concerning the youth-redshift degeneracy were made in a different context by Gopal-Krishna, myself and Saripalli (MNRAS, 1989, 239, 173) when we modelled the paucity of giant radio galaxies.
Katherine Blundell: Our recent study which led to the ‘youth-redshift degeneracy’ has illustrated that in fact the inverse Compton losses are not by any means the most important factor in causing the deficit of large linear-size radio galaxies. It is actually the drastic effects of a survey flux-limit together with luminosity tracks which decline because of adiabatic expansion losses which predominantly reduces the number of giant radio galaxies found in complete samples above . (It should be noted that giant radio galaxies out to have been found by Cotter, Rawlings & Saunders 1996.) Inclusion of the role of the hotspot also enables us to explain not just the low-numbers of low-powered large radio galaxies, but also the problem posed by Baldwin (1982) that there is an absence of high-power large size sources.