D. Romano, e-mail: romano@sissa.it 11institutetext: SISSA/ISAS, Via Beirut, 2-4, 34014 Trieste, Italy 22institutetext: Osservatorio Astronomico di Trieste, Via G.B. Tiepolo, 11, 34131 Trieste, Italy 33institutetext: Dipartimento di Astronomia, Università di Trieste, Via G.B. Tiepolo, 11, 34131 Trieste, Italy
The Galactic Lithium Evolution Revisited
Abstract
The evolution of the 7Li abundance in the Galaxy has been computed by means of the two-infall model of Galactic chemical evolution. We took into account several stellar 7Li sources: novae, massive AGB stars, C-stars and Type II SNe. In particular, we adopted new theoretical yields for novae. We also took into account the 7Li production from GCRs. In particular, the absolute yields of 7Li, as suggested by a recent reevaluation of the contribution of GCR spallation to the 7Li abundance, have been adopted.
We compared our theoretical predictions for the evolution of 7Li abundance in the solar neighborhood with a new compilation of data, where we identified the population membership of the stars on a kinematical basis. A critical analysis of extant observations revealed a possible extension of the Li plateau towards higher metallicities (up to [Fe/H] 0.5 or even 0.3) with a steep rise afterwards.
We conclude that 1) the 7Li contribution from novae is required in order to reproduce the shape of the growth of A(Li) versus [Fe/H], 2) the contribution from Type II SNe should be lowered by at least a factor of two, and 3) the 7Li production from GCRs is probably more important than previously estimated, in particular at high metallicities: by taking into account GCR nucleosynthesis we noticeably improved the predictions on the 7Li abundance in the presolar nebula and at the present time as inferred from measures in meteorites and T Tauri stars, respectively. We also predicted a lower limit for the present time 7Li abundance expected in the bulge, a prediction which might be tested by future observations.
keywords:
Galaxy: chemical evolution – stars: evolution, abundances – cosmic rays – ISM: abundances plot1 Introduction
Since Spite & Spite (1982) discovered that the oldest, warm halo dwarfs in
the Galaxy all show almost the same 7Li abundance, several papers have
appeared in the literature supporting their initial interpretation that this
is the primordial abundance of 7Li (Spite, Maillard & Spite, 1984; Spite
& Spite, 1986; Rebolo, Molaro & Beckman, 1988, hereafter RMB; but see also
Thorburn, 1994).
The substantial flatness of the plateau and the absence of intrinsic scatter
(Spite et al. , 1996; Bonifacio & Molaro, 1997), coupled with the detection
of the fragile isotope 6Li in the metal-poor stars HD 84937 (Smith et
al. , 1993; Hobbs & Thorburn, 1997; Cayrel et al. , 1999) and perhaps
BD+42 2667 (Cayrel et al. , 1999), are the arguments for claiming that no
significant depletion mechanisms should have acted in these stars to modify
the pristine 7Li abundance (but see also Ryan, Norris & Beers, 1999).
We also note a competing theory, which claims that the highest 7Li abundance - measured in the most Li-rich Population I objects - is the primordial one (Boesgaard et al. , 1998). In this case some depletion mechanisms able to deplete Li in all the halo stars by the same amount acting on a Galactic lifetime timescale are required. Possible mechanisms include diffusion (Vauclair, 1988), rotational mixing (Pinsonneault et al. , 1992) and stellar winds (Vauclair and Charbonnel, 1995).
Recently, Fields & Olive (1998), using a standard model of Galactic cosmic ray (GCR) nucleosynthesis, found that only little 6Li (and 7Li) depletion is allowed in halo stars. So that the observed Spite plateau should be indicative of the primordial Li abundance.
Younger stars span a wide range of lithium abundances. The highest values, measured in Orion T Tauri stars reach A(Li)111A(Li) = log10 (N/NH) + 12. 3.83 dex ( 3.5 dex when corrected for NLTE effects, Duncan & Rebull, 1996). Therefore, some mechanisms of 7Li production are required to increase the Li abundance from the plateau value to the present one. Nuclear reactions in stellar interiors and spallation processes on interstellar medium (ISM) particles involving either high or low energy GCRs have both been proposed as possible mechanisms able to synthesize 7Li and restore it back to the ISM, where it enters into the chemical composition of the new-formed stars.
Lithium evolution has already been studied in detail by several authors. D’Antona & Matteucci (1991), by means of a complete model of chemical evolution, have shown that both the Solar System lithium abundance and the rise from the Spite plateau could be explained assuming Li-production in classical novae and AGB stars. Later, novae were ruled out as lithium producers at a Galactic level (Boffin et al. , 1993). Matteucci et al. (1995) suggested a combination of -process nucleosynthesis from Type II SNe and hot bottom burning in intermediate mass AGB stars to match the observations. Recently, Matteucci et al. (1999) used the same nucleosynthesis prescriptions to calculate the expected 7Li content in the Galactic bulge. Lithium production by low mass AGB stars (C-stars) and standard GCR nucleosynthesis were the key ingredients of the model of Abia et al. (1995), which was able to match also the behaviour of the lithium isotopic ratio. In any case, they had to require a percentage of Li-rich C-stars much higher (6 – 8%) than observed (2 – 3%). However, we note that C-stars at low metallicities are found much more numerous ( 10%, Beers et al. , 1992; Norris et al. , 1997).
In this paper we deal with Galactic lithium evolution taking into account the
lithium production both in stars and from GCRs. The aim of the paper is to
reproduce the observed upper envelope of the diagram A(Li) vs [Fe/H], assuming
that the Population II 7Li is the primordial one.
In §2 we present the data-set we have used to constrain the model results,
in §3 we review the main candidates as stellar lithium producers, in §4
we present the basic assumptions of the chemical evolution model and the
lithium synthesis prescriptions, in §5 we illustrate our main results and
in §6 we draw some conclusions.
2 Observational data
The observed evolution of the 7Li abundance with metallicity, when abundance determinations in disk and halo dwarfs are restricted to stars with effective temperature Teff 5700 K, suggests that there is a general trend towards a larger ISM 7Li content with increasing metallicity. In previous papers (e.g. Matteucci et al. , 1995, 1999) the abundances used to constrain Galactic chemical evolution models were pointing to a smooth increase from the Spite plateau to the Solar System value. In this paper we show the results of an analysis performed on a large selection of data taken from the literature. Li detections for those stars which are tracing the upper envelope of the observational A(Li) vs [Fe/H] diagram have been critically analysed and a rise off the plateau steeper than previously assumed has been found. This result, coupled with a Spite plateau which extends towards larger metallicities, suggests a revision of the various contributions to the 7Li production from different sources. In particular, 7Li producers restoring their lithium to the ISM on long timescales should be preferred.
7Li measurements in stellar atmospheres have been selected from the literature in the metallicity range 1.5 [Fe/H] 0.5 dex 222Sources in the literature: Deliyannis et al. , 1990; Lambert et al. , 1991; Pilachowski et al. , 1993; Pasquini et al. , 1994; Spite et al. , 1996.. This region is particularly interesting because it is the metallicity range where the observed lithium abundance is expected to start growing due to 7Li injection from the first Li factories.
From the point of view of stellar nucleosynthesis, it is important to determine the metallicity at which the Li abundance starts rising off the Spite plateau. For instance, the constancy of the Spite plateau at [Fe/H] 1.5 translates into the requirement that Type II SNe coming from the first stellar generations should contribute only an amount of lithium smaller than the primordial one.
Selection criteria have been applied in order to remove from the sample all those stars which are likely to have passed through phases during which they either destroyed or diluted their initial lithium content. To this purpose, we selected only stars not suffering any 7Li convective depletion, i.e. Teff 5700 K, according to standard models. Stars with Teff 5700 K are cool enough to be threatened by Li burning in deep convective envelopes already during the pre-main sequence (see also Ryan & Deliyannis, 1998). Moreover, we retained only stars included in the HIPPARCOS catalogue which provides accurate information on kinematics and luminosities. Objects recognized as giants or subgiants are likely to show Li surface abundances affected by dilution and have been rejected.
The program stars are listed in Tab.3. For each star we give the HD, DM, G and HIP numbers and the U, V, W heliocentric space-velocity components with the associated errors. The membership to a specific Galactic population (halo or disk, either thin or thick) as derived from the kinematics and the evolutionary status are also provided.
2.1 Evolutionary status
In order to determine the evolutionary status of each star in our sample, we used the theoretical isochrones by Bertelli et al. (1994). We divided the program stars in three metallicity bins ([Fe/H] 0.75; 1.25 [Fe/H] 0.75; and [Fe/H] 1.25). For each bin the data were compared with theoretical isochrones appropriately chosen for different ages at different metallicities. In the bin [Fe/H] 0.75 we used the isochrones of 2 – 9 Gyr; in the bin 1.25 [Fe/H] 0.75 the 6 – 19 Gyr isochrones, and in the bin [Fe/H] 1.25 those of 8 – 20 Gyr. The absolute magnitudes for the stars in our data-base were obtained from the HIPPARCOS parallaxes. The effective temperatures were calculated using the (B V) – Teff calibration of Alonso et al. (1996). Within each metallicity bin and by using the appropriate isochrone we distinguished among turn-off, giant and subgiant stars following the criteria outlined by Beers et al. (1990). We found that most of the stars are turn-off stars; only few among them (HIP 36430, HIP 37723, HIP 86694, HIP 103987, HIP 115167, HIP 116082) are subgiants and are, therefore, not considered in the analysis.
2.2 Kinematics
The heliocentric Galactic space-velocity components, U, V and W, calculated from the star’s proper motion, parallax and radial velocity following the Johnson & Soderblom (1987) analysis, are listed in columns 5, 6, 7 of Tab.3. The uncertainties , and are also given in columns 8, 9, 10. A left-handed coordinate system for U, V, W, so that they are positive in the directions of the Galactic anticenter, the Galactic rotation and the North Galactic Pole, respectively, is adopted. The radial velocities used to complement HIPPARCOS data are from the SIMBAD data-base or from the literature. For 12 objects lacking of radial velocity U, V, W are not provided. Stars for which the relative error on the parallax is greater or equal to 100% () have also no kinematics determination.
With these data at hand we distinguished between a disk population and
a non-disk population. Adopting a selection criterium based on the
studies by Sandage & Fouts (1987) and Beers & Sommer-Larsen (1995), in
order to belong to the disk population we required a star to have V
115 Km s and (U2 + W2) 150 Km
s .
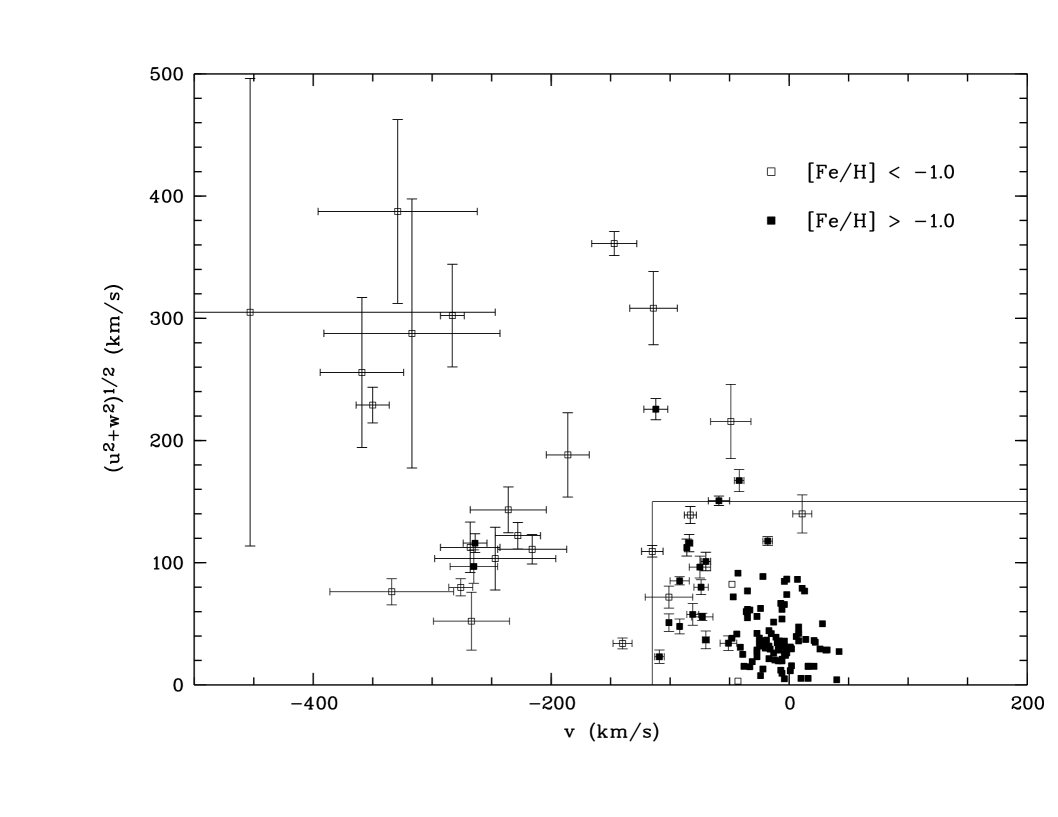
In Fig.1 we show the V vs (U2 + W2) diagram obtained
for our data sample. Stars with metallicities below or above [Fe/H] = 1.0
are shown with different symbols. In this plot the kinetic energy associated
to the rotation around the Galactic center is compared to the kinetic energy
associated to any other motion. As expected, stars with [Fe/H] 1.0
concentrate in the region V 50 Km s,
(U2 + W2) 100 Km s and dilute outside.
These objects compose the bulk of the Galactic disk.
The thick-disk should be envisaged in those stars which rotate more
slowly and with larger random motions. For the sake of simplicity, we choose
here to distinguish only between disk and non-disk stars.
Contrary to common assumption that all halo stars are also metal-poor we found three stars G 170-156 ([Fe/H] = 0.8, HIP 86321), G 17-21 ([Fe/H] = 0.6, HIP 80837) and G 182-19 ([Fe/H] = 0.7, HIP 86431) with metallicities larger than [Fe/H] 1.0 which do not show disk-like motion. One more star BD+01 3421 ([Fe/H] = 0.5, HIP 84905) is possibly belonging to the thick-disk.
On the other hand we found three stars HD 166913 ([Fe/H] = 1.8, HIP 89554), HD 205650 ([Fe/H] = 1.3, HIP 106749) and HD 134169 ([Fe/H] = 1.6, HIP 74079) with metallicity below 1.0 which possess a disk-like motion. These three stars are members of the metal-weak tail of the Galactic disk. Other two stars with these properties have been found by Bonifacio et al. (1999).
Five stars (HIP 104659, HIP 37789, HIP 11952, HIP 37853 and HIP 55022) are lying just on the boundary which separates the halo from the disk stars.
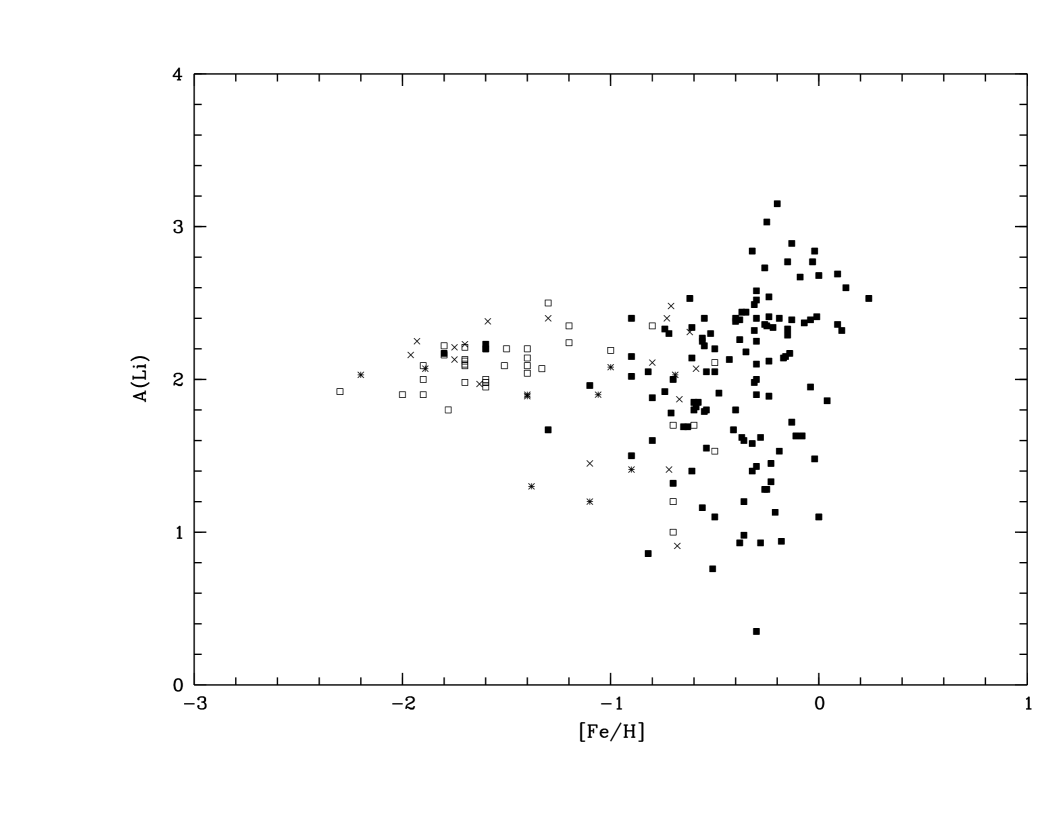
In order to ascertain a possible correlation between the kinematics of the
stars and the 7Li abundance, we drew in Fig.2 the graph A(Li) – [Fe/H]
indicating with different symbols disk stars, non-disk stars and objects
without a precise kinematical membership. From Fig.2 we note that the star
HD 160693 (HIP 86431), with halo-like motion and a metallicity of 0.7,
has A(Li) 1.2 falling well below the Li plateau. On the other hand the
metal-poor stars with disk motions show a Li abundance at the plateau level.
Thus lithium depletion is likely related only to metallicity and independent
from the kinematics.
These findings allow us to assume that the upper envelope of the observational
diagram traces those stars which have suffered only a minor lithium depletion
during their life. This interpretation is also supported by the analysis of
the stars with Be data, whose Be abundances imply Li abundances larger than
actually observed (Molaro et al. , 1997). Therefore, the upper envelope
results from the various lithium enrichment processes occurred during the
overall Galactic lifetime.
Our revised compilation of the data from the literature shows a plateau which
may extend at metallicities larger than previously assumed and points to a
very steep rise off the plateau starting at [Fe/H] 0.5, 0.3.
Details of the star by star critical Li analysis are provided in appendix.
3 Stellar sites for 7Li production
3.1 Novae as lithium factories
Both theoretical and observational evidence suggests that classical novae may
be responsible for a non-negligible contribution to the ISM pollution in
several nuclides (7Li, 13C, 15N, 17O) and radioactive
isotopes (22Na, 26Al) (see Gehrz et al. ,1998 for a review on this
subject). The nova explosion results from thermonuclear runaway on the surface
of a CO or ONeMg white dwarf (WD) accreting hydrogen-rich matter from a main
sequence companion which fills its Roche lobe in a close binary system; so the
material ejected into the ISM shows a composition enriched in elements
synthesized by explosive hydrogen-burning.
The pre-explosion 3He concentration in the accreted envelope plays a key
role in determining how much 7Li will be produced in the outburst.
Starrfield et al. (1978) found that the 7Li yield does scale linearly with
the initial 3He content. Their result was used by D’Antona & Matteucci
(1991) who successfully reproduced the upper envelope of the observed A(Li)
vs [Fe/H] diagram for the solar neighborhood. These authors adopted A(Li) =
2.10 dex as the primordial lithium abundance and explained the observed
increasing trend in lithium abundance with time as due to Galactic enrichment
coming from lithium production by stellar sources, identified in both novae
and AGB stars.
Later, novae nucleosynthesis was discussed by Boffin et al. (1993), who
reinvestigated 7Li production in explosive hydrogen-burning with the
inclusion of the 8B (p,) 9C reaction and ruled out novae
as lithium producers at a Galactic level. In particular, they ruled out
the linear dependence of Li production on the 3He abundance in the
exploding envelope, which was a key ingredient in the D’Antona & Matteucci
model.
Boffin et al. used a parameterized one-zone explosive nucleosynthesis model
and detailed numerical network calculations to demonstrate how the high peak
densities prevailing at the base of the hydrogen-burning shell during the
nova outburst prevent the build-up of 7Li amounts sufficient for ISM
enrichment. However, they also stressed the need for testing their results by
detailed hydrodynamic nova models.
This check was effectively carried out a few years later: Hernanz et
al. (1996), using a hydrodynamic code able to treat both the accretion
and the explosion stages, have obtained large overproduction factors relative
to the solar abundance for 7Be - and hence 7Li. Therefore, although the
final masses injected in the ISM are small, significant production of 7Li
by novae seems possible. In their models, these authors have assumed a solar
composition of the infalling material and the existence of processes able
to mix it with the inner layers of the underlying white dwarf. This assumption
allows one to obtain the enhanced CNO or ONeMg abundances required in order to
give rise to a nova outburst and to explain some observations (see Livio, 1994
for a recent review).
More recently, José & Hernanz (1998) computed an enlarged grid of
hydrodynamical nova models for both CO and ONeMg WDs, spanning a total
range of white dwarf masses of 0.8 – 1.35 M⊙. In these models
different mixing levels - ranging from 25 to 75% - between the accreted
envelope and the underlying WD core were assumed. These models predict
ejected quantities of 7Li able to affect the evolutionary history of
this nuclide on a Galactic scale.
At this point, it is worth emphasizing the strong dependence of these results
on the chemical composition at the onset of the explosion: the predicted
7Li overproduction factors will be correct only if the evolution of 3He
during the accretion phase has been followed in the right manner. Moreover, we
note that if the underlying WD is a CO one, the predicted 7Li abundances
are 1 order of magnitude larger than in the case of an underlying
ONeMg WD (see e.g. Table 1 of Hernanz et al. , 1996).
3.2 Lithium production in massive AGB stars
7Li production in AGB stars is the only Li stellar production mechanism supported by observations.
Smith & Lambert (1990) analysed high-resolution spectra for 27 red giants in
the Magellanic Clouds, spanning a range in bolometric absolute magnitudes
Mbol 5 to 9. They found that Li-rich stars were confined
to those with Mbol 6 to 7, while lower (Mbol
5 to 5.5) and higher (Mbol 7 to 9) luminosity
red giants showed no Li features. In addition, all their Li-strong stars presented C/O 1 and bore evidence of strengthened s-process atomic lines. These
facts were interpreted as a signature of the dredge-up and subsequent envelope
burning mechanism, occuring in the massive AGB stars (M 4 – 8
M⊙). Since every luminous AGB star observed showed the Li I doublet,
it seemed to be very likely that the 7Li produced in the outer envelope was
not destroyed quickly, but it was surviving in the stellar atmosphere and
injected into the ISM by stellar winds. Smith & Lambert derived a maximum
abundance of 7Li as large as A(Li) 4.0 for the luminous AGB stars
and indicated them as a major source of 7Li in a galaxy.
These observational findings were confirmed by theoretical calculations in
which a time-dependent “convective diffusion” algorithm for the hot bottom
envelopes of AGB stars was coupled with a fully self-consistent evolutionary
sequence (Sackmann & Boothroyd, 1992). It was shown that values of A(Li)
lying between 4 and 4.5 could be obtained for stars in the luminosity range M
bol 6 to 7, in excellent agreement with observations of
the most lithium-rich giants in external galaxies (Smith & Lambert, 1990;
Smith et al. , 1995) but in poorer agreement with observations in our Galaxy
(Abia et al. , 1991). According to Sackmann & Boothroyd, super-rich lithium
giants would occur in the mass range M 4 – 6 M⊙, when
the temperature at the base of the convective envelope exceeds 50
10 K and the Cameron-Fowler mechanism333See Cameron & Fowler
(1971) for a detailed description of this mechanism. works (in these models,
stars with M 7 M⊙ ignite carbon in the center before they become
AGB stars and never experience hot bottom burning).
Later, Plez et al. (1993) enlarged the Smith & Lambert’s sample of giants
in the Small Magellanic Cloud (SMC) and pointed out that several of these
metal-poor giants have atmospheric abundances of 7Li too low to provide a
significant contribution to Galactic enrichment. On the other hand, Sackmann
& Boothroyd had shown that a decrease in the metallicity causes the hot
bottom burning to start at smaller masses, resulting in a larger 7Li
production! This seems to lead to a discrepancy with Plez et al.’s
observations, but it should be recalled that low metallicity giants lose their
envelope mass at a smaller rate than more metal-rich giants, thus allowing
Li-burning to occur before the planetary nebula (PN) ejection and thus
preventing significant ISM pollution and explaining Plez et al.’s findings.
Recent studies (Mazzitelli et al. , 1999) confirm that 7Li abundances as
large as A(Li) 4.0 dex at maximum can be found in the atmospheres of
massive AGB stars.
The 7Li production by C-stars (coming from progenitors in the mass range 2 – 5 M⊙) can be regarded as negligible on a Galactic scale, on the ground of the very small number of Li-rich C-stars detected with respect to their total number (see Wallerstein & Conti, 1969; Abia et al. , 1993a, 1993b; but see also Beers et al. , 1992). Such a low number of Li-rich C-stars can be easily explained if it is assumed that these stars represent a short-lived phase with respect to the overall stellar lifetime on the AGB. On the contrary, one should assume that for stars with progenitor masses in the range 5 – 8 M⊙ the envelope ejection in the PN stage shortly follows the lithium production in the envelope itself. We want to recall briefly that lithium production in these stars is thought to be due either to hot bottom burning, occuring during thermal pulses (TPs) at the base of the common envelope, or to a mechanism such as that described by Iben (1973), involving only the region of the outer convective envelope lying near the hydrogen burning shell, during the long timescale of the interpulse phases.
3.3 7Li synthesis in Type II supernova explosions
7Li synthesis in massive stars (M 10 M⊙) is theoretically
explained as being due to a particular mechanism, the neutrino process.
The first realistic exploration of the so-called neutrino process
(-process), acting during SNeII explosion, was undertaken by Woosley et
al. (1990). Such a process occurs in the shells overlying the collapsing core
of a contracting massive star. In these conditions, the flux of neutrinos is
so large that, despite the small cross section, evaporation of neutrons or
protons from heavy elements and helium is expected. The back reaction of these
nucleons on other species alters the outcome of traditional nucleosynthesis
calculations, resulting in a large production of a great number of rare
isotopes. 7Li is one of these; it is thought to be made mainly in the
helium and in the silicon shells from - and -neutrinos interacting
with helium. In their work, Woosley et al. strongly supported the idea that
this lithium production by -process in massive stars could be large
enough to explain the full 7Li Solar System abundance.
This point was later revised when Timmes et al. (1995), using the output
from a grid of 60 Type II supernova models of varying mass and metallicity
(Woosley & Weaver, 1995), computed the chemical evolution of several stable
isotopes, taking into account also the nucleosynthesis from Type Ia supernovae
and from single stars with M 8 M⊙. They found that massive stars
are producing lithium prior to [Fe/H] 1.0 dex, but until this
metallicity value the contributions are small compared to the infall values,
thus preserving the flat shape of the diagram A(Li) vs [Fe/H] inferred
from the observations. Finally, they concluded that Type II supernovae
contribute about one-half the solar 7Li abundance444This result is
achieved for - and -neutrino temperatures in the range 6 – 8
MeV, which is the range suggested by SN 1987 A., pointing to a lower 7Li
production rate by the -mechanism than Woosley et al. (1990). Such an
outcome was confirmed also by Matteucci et al.’s (1995) analysis, where
C-stars plus massive AGB stars on the one hand and Type II SNe on the other
hand were found to contribute each one-half the Solar System 7Li abundance,
although the authors did not conclusively rule out a fraction between 1/4 and
3/4 from both sources, because of the uncertainties in the input
nucleosynthesis.
4 The model
4.1 Basic assumptions
The adopted model of chemical evolution is that of Chiappini et al. (1997), in which we included the 7Li evolution, taking into account Li production from all the stellar sources identified above and from GCR spallation. This model assumes that the halo and thick-disk formed quickly (on a timescale of 2 Gyr) during a first infall episode and the thin-disk formed on a much larger timescale ( 8 Gyr) during a second independent infall episode.
The nova system nucleosynthesis has been included in the model in a detailed way under simple hypotheses. We first computed the nova systems formation rate at the time as a fraction of the formation rate of white dwarfs at a previous time as in D’Antona & Matteucci (1991):
Here is a delay time whose value has to be fixed to guarantee the
cooling of the WD at a level that ensures a strong enough nova outburst.
We chose = 1 Gyr as a suitable average value (D’Antona, 1998)
and assumed that all stars with initial masses in the range 0.8 – 8
M⊙ end their lives as WDs.
is the star formation rate (SFR), is the lifetime of the
star of mass and is the initial mass function (IMF). More about
SFR and IMF parameterization can be found in Chiappini et al. (1997)
concerning the disk of the Galaxy and in Matteucci et al. (1999) concerning
the Galactic bulge.
The rate of nova eruptions is related to the WD formation rate:
where is the formation rate of WDs in binary systems which
will give rise to nova eruptions, and = 10 is the average number
of nova outbursts for a typical nova system (Bath & Shaviv, 1978; see also
Shara et al. , 1986).
The parameter , set equal to a constant value along the overall
evolutionary history of the Galaxy, can be fixed by the rate of nova outbursts
in our galaxy at the present time. Estimates of this quantity in the current
literature range from as few as 11 to as many as 260 nova outbursts
yr. In particular, predictions based on scalings from extragalactic
nova surveys suggest low values (11 – 46 yr, Ciardullo et al. ,
1990; 15 – 50 yr - with the lowest values, between 15 and 25
yr, strongly favored - Della Valle & Livio, 1994), whereas estimates
based on extrapolations of Galactic nova observations give the highest rates
(73 24 yr, Liller & Mayer, 1987; 260 yr, Sharov,
1972; 50 yr, Kopylov, 1955; 100 yr, Allen, 1954)
555Hatano et al. 1997 reanalyzed Liller & Mayer’s data and argued
that the correct rate should be 41 yr rather than 73 24
yr.. We chose for the present time rate of nova outbursts in the
Galaxy 25 yr for the following
reasons: (1) observation of novae in nearby galaxies would avoid, or at least
minimize, most of the problems encountered by Galactic observations; (2) a
recent study of Shafter (1997) shows that the nova rate based on Galactic
observations can be made consistent with the rate predicted from the
extragalactic data, particularly if the Galaxy has a strong bar oriented in
the direction of the Sun (in this latter, most favourable case, the suggested
value is near 20 yr, otherwise, if the bar is weak or
misaligned, the global rate can be reduced only to 30 yr).
4.2 Nucleosynthesis prescriptions
We assumed a homogeneus Big Bang 7Li abundance of 2.2 dex (Bonifacio & Molaro, 1997) as the primordial one and considered all the contributions from the various classes of stellar 7Li factories seen in §3 in the Galactic chemical evolution model.
In this study we adopted the updated lithium yields from theoretical nova
outbursts provided by José & Hernanz (1998). We took the mean mass ejected
as 7Li averaged on 7 evolutionary sequences for CO WDs and the mean mass
ejected as 7Li averaged on so many evolutionary sequences for ONeMg WDs.
ONeMg WDs are believed to originate from stars with initial masses in the
range 7 M⊙ – Mup666Here we assume Mup, the limiting
mass for the formation of a degenerate CO core, equal to 8 M⊙, although
some authors suggest 5 – 6 M⊙ as a more suitable value, when
overshooting is taken into account (Chiosi et al. , 1992; Marigo et al. ,
1996). (but there is still debate on this point). Since the lifetime of a 7
M⊙ star is 0.045 Gyr, we assumed that for 0.045 Gyr
only ONeMg WDs can contribute to nova systems; for times larger than 0.045
Gyr, about 30% of novae occur in systems containing ONeMg WDs, while the
remaining take place in systems accreting hydrogen-rich envelopes onto CO
WDs.
In particular, the prescriptions for 7Li yields from novae we used in our
model are as follows:
for 0.045 Gyr we assumed
Mej = 1.95 10 M⊙
(mean mass ejected by a single nova system during its overall evolution) and
X = 9.24 10
(mean 7Li abundance - in mass fraction - in the ejected material).
For 0.045 Gyr we assumed
Mej = 2.63 10-1 M⊙
with
X = 2.85 10
as the mean lithium abundance in the ejected envelope.
As far as AGB stars are concerned, we included here a metallicity dependence of the lithium yields from massive AGB stars as in Matteucci et al. (1995), which accounts for the lower 7Li abundances observed in the low metallicity SMC AGB stars relative to the higher ones exhibited by their more metal-rich Galactic counterparts. We assumed no production of lithium by AGB stars until a metallicity of Z = 10, then allowing lithium production only in the mass range 5 M⊙ – Mup, where Mup increases from 5 to 8 M⊙ as Z reaches the solar value. The 7Li abundance in the ejected material is assumed to be either A(Li) = 4.15 or A(Li) = 3.50 dex (see Tab.1 for different model prescriptions). Since only a small number of Li-rich C-stars (coming from progenitors with masses in the range 2 – 5 M⊙) are known out of hundreds of C-stars observed in the Galaxy and in the Magellanic Clouds, we assumed their contribution to the lithium enrichment to be almost negligible and followed the D’Antona & Matteucci (1991) prescriptions. In one model (model C) we also completely suppressed this class of lithium factory.
To account for lithium production in Type II supernovae, we considered the metallicity dependent 7Li yields given by Woosley & Weaver (1995). We included in our computation both the full yields (model A and B) and those reduced to a half (model C).
7Li astration in stars of all masses has also been taken into account.
The contribution of GCR spallation has been taken into account by incorporating the absolute yields from Lemoine et al. (1998) into the chemical evolution model. We took the yields from the lower-bound spectrum in their Table 1.
| Model | C-stars | M-AGB | SNeII | novae |
|---|---|---|---|---|
| A | A(Li) = 3.85 | A(Li) = 4.15 | WW95 | no |
| B | A(Li) = 3.85 | A(Li) = 4.15 | WW95 | yes |
| C | no | A(Li) = 3.50 | WW95/2 | yes |
5 Results
In Fig.3 we show the predicted log (), log () trends vs
time in the solar neighborhood for models with = 0.0125. By assuming
a Galactic scale height of 300 pc for WDs - and hence novae - and a Galactic
volume of 10 pc we obtain = 24.5
yr, in good agreement with observations (see section 4.1).
We predict also that the current WD birthrate in the Galaxy should be
= 2.27 10 WDs pc yr,
to be compared with observational estimates which give =
1 10 WDs pc yr (Yuan, 1989) and
(spatial density) 1 10 pc (Weidemann, 1967).
This slight discrepancy, however, can be explained by recent dynamical
calculations (Chamcham, 1998) suggesting that about 40% of the white dwarfs
originally formed in the thick-disk have moved from their birthplaces so that
they should be observed at a higher scale height at the present time.


Note that the oscillations in the theoretical curves in Fig.3 are caused by the introduction of a threshold in the surface gas density (7 M⊙ pc) below which star formation stops, owing to gas instability against density condensations in these conditions (see Chiappini et al. , 1997). The presence of such a threshold leads also to a delay in the WD formation, which starts only after 0.6 Gyr (compare Fig.3 here with Fig.2 in D’Antona & Matteucci, 1991, whose model does not include such a threshold in the gas density).

We ran several models considering separately all the 7Li stellar sources
discussed above. The Galactic lithium enrichment in the solar neighborhood
due only to novae is sketched in Fig.4: novae start injecting material into
the ISM with a time delay of 2 Gyr, when the ISM has already achieved a
metallicity [Fe/H] 0.5 dex. This long time-lag in the occurrence
of an ISM pollution by novae is the direct consequence of two elements
characterizing the evolution of such systems, both acting in the same
direction: 1) the time-lag required to form the WD and 2) the time necessary
for the WD to cool enough to allow strong nova outbursts.
The effects produced by changing from 0.0125 to smaller or greater
values on the predicted A(Li) vs [Fe/H] trend are also shown in Fig.4. We
analysed two possible different choices, = 0.01 and = 0.015.
The first choice leads to = 19.6 yr, the
second one to = 29.4 yr. These estimates
reproduce very well the lower and upper limits of the permitted values
inferred from the analysis of Shafter (1997). We have chosen = 0.0125
as the most suitable value and used it in all the calculations.
In Fig.5 we show the evolution of the 7Li abundance in the solar neighborhood as predicted by two models both allowing lithium production to happen only in AGB stars (prescriptions on lithium production as in model A). If we assume 7Li production to take place in both C-stars and massive AGB stars (dotted line) we obtain a slightly higher 7Li abundance than assuming 7Li production only in massive AGB stars (continuous line).

In Fig.6 we show the effect of 7Li production only by massive stars. We used either the full 7Li + 7Be yields (Woosley & Weaver, 1995) or the same yields reduced to one half.
From figures 4, 5 and 6 we can immediately see how novae, giving rise to a
strong Li-enrichment at high metallicities, can in principle account for the
present 7Li abundance in the gas without any other stellar source. However,
acting on evolutionary timescales as long as 1.5 Gyr at least, they cannot
justify at the same time the rise off the Spite plateau. On the other hand,
Type II supernovae start restoring their 7Li into the ISM at earlier times,
but they are not able to fully explain the present gas content of lithium, if
they are not coupled to other stellar Li producers. The AGB stars present a
quite similar behaviour, but restore their 7Li a bit later than SNeII, and
in minor (if not almost equal) amounts (compare Figs.5 and 6).
Therefore, one single stellar category of 7Li producers could never
explain all the observed features of the diagram A(Li) vs [Fe/H], under
realistic prescriptions about 7Li synthesis!
Therefore we computed three different chemical evolution models for both the solar vicinity and the Galactic bulge, adding together the different stellar sources.


In Figs.7 and 8 we sketch the A(Li) vs [Fe/H] trends obtained in the case of the solar neighborhood evolution and in the case of the bulge evolution, respectively. Models A, B and C are referring to the different nucleosynthesis prescriptions outlined in Tab.1. The observational points plotted in Fig.7 are those given in Tab.4 after the upper limits have been removed. An average value has been taken for the three objects with multiple 7Li detections which are tracing the upper envelope (see the appendix). From Fig.7, we see that model A, using the nucleosynthesis prescriptions from the best model of Matteucci et al. (1995), does not reproduce the highest values of A(Li), found in some of the most metal-rich stars, nor the observed upper envelope in the metallicity range 1.5 [Fe/H] 0.5 dex. Model B, constructed by adding the contribution from nova outbursts to the previous one, produces a curve which becomes much steeper at the highest metallicities, hardly reaching the highest Li abundances exhibited by the most metal-rich stars in our sample. In model C, lithium production from C-stars is set to zero, and 7Li yields from both massive AGB stars and TypeII SNe are reduced. In particular, SNeII yields are assumed to be one half of the original ones. As one can see from Fig.7, model C reproduces at best the observational data in the metallicity range 1.5 [Fe/H] 0.5, but fails in reproducing the meteoritic and the T Tauri 7Li abundances. 7Li production from GCR spallation could be helpful in reproducing the highest observed 7Li abundances.
Molaro et al. (1997), by studying a large sample of stars with 9Be
determinations, found that A(Be)777A(Be) = log10(N/NH)
+ 12. correlates linearly with [Fe/H], with a slope confirmed also by Duncan
et al. (1997) and García-López et al. (1998). 9Be is produced only
by GCR spallation. Using the Steigman & Walker (1992) formula, 7Li/9Be
= 7.6 for PopII stars with Teff 6200 K, one can see that the
7Li amount expected from GCR spallation alone is about 1% of the
primordial 7Li abundance at [Fe/H] 2.5, and that it becomes
more important with increasing metallicity, being about 25% around [Fe/H]
1.0. At larger metallicities one could expect an even larger
contribution, although other authors suggest that GCRs can contribute to the
present ISM 7Li abundance by no more than 10%, on the basis of the
7Li/6Li ratio towards Oph (e.g. Lemoine et al. , 1995).
In order to include GCR nucleosynthesis in our chemical evolution model in a
self-consistent way, we used the absolute yields provided by Lemoine et al.
(1998) for various metallicities. As a result, we produced a smoother rise
from the plateau, and we were finally able to match the meteoritic and
T Tauri lithium abundances (see Tab.2).
The lithium abundance in the Galactic bulge at the present time predicted by
our model C is as high as 4 dex (Fig.8); if novae are not included in
the computation, a lower present Li abundance is expected in the bulge (
3.5 dex, see also Matteucci et al. , 1999).
However, this is only a lower limit, since 7Li production from GCRs was not
included in the bulge model. In fact, giving the uncertainties in the relevant
parameters (see Lemoine et al. , 1998), it seems not so meaningful to
translate the GCR nucleosynthesis results for the solar neighborhood to the
central region of the Galaxy.
| Model | A(Li)SS | A(Li)ISM |
|---|---|---|
| A | 2.91 | 2.90 |
| B | 3.12 | 3.24 |
| C | 2.95 | 3.12 |
| C + GCRs | 3.21 | 3.39 |
6 Conclusions
In this paper we have computed the evolution of the 7Li abundance in the
ISM of the solar neighborhood and the bulge of our Galaxy.
We took into account several stellar 7Li factories (novae, massive AGB
stars, C-stars and Type II SNe), together with the GCR contribution. In
particular, we adopted new nucleosynthesis prescriptions for novae (José
& Hernanz, 1998) and the yields of 7Li of Lemoine et al. (1998) as far
as GCR nucleosynthesis is concerned.
We compiled a new data sample for 7Li abundances in the solar neighborhood
stars identifying the stars belonging to disk and halo Galactic components on
the basis of their kinematics. The identification of metal-rich Li depleted
halo stars provides evidence that Li depletion depends from metallicity only,
thus supporting the use of the upper envelope in the Li data-set as the true
indicator of Li Galactic evolution. The selection of the stars which have
likely preserved their 7Li content reveals a possible extension of the Li
plateau towards higher metallicities, up to [Fe/H] 0.5, 0.3,
with a steeper rise afterwards.
Comparing theoretical predictions with the data we derived the following
conclusions:
-
1 –
In order to reproduce the upper envelope of the A(Li) vs [Fe/H] diagram we need to take into account several stellar Li sources: AGB stars, Type II SNe and novae. In particular, novae are required to reproduce the steep rise of A(Li) between the formation of the Solar System and the present time, as is evident from the data we sampled. On the other hand, 7Li yields for SNeII should be lowered by at least a factor of two in order to reproduce the extension of the Spite plateau.
-
2 –
We produced arguments suggesting that GCRs could be responsible for the production of a non-negligible amount of Li at metallicities larger than [Fe/H] 1.0 dex. In particular, we showed that without any GCR contribution it is impossible to reach the high values observed in meteorites and T Tauri stars: GCRs are responsible for 45% of the Solar System 7Li (prescriptions on stellar nucleosynthesis as in model C).
-
3 –
By adopting the nucleosynthesis prescriptions of our model C for the Galactic bulge, we predicted a lower limit for the present time 7Li abundance in this central region of the Galaxy of the order of 4.0 dex, which is 0.5 dex higher than previously estimated in Matteucci et al. (1999) neglecting the novae contribution.
If new 7Li measurements in stars with [Fe/H] around 0.5 dex will confirm the extension of the plateau towards such high metallicities, a revision of the contribution to the 7Li abundance from GCR spallation too could be needed.
Appendix
Star by star analysis
In order to identify the stars which can be actually considered as tracers of the upper envelope at every metallicity, and discard the depleted ones, we analysed in detail the abundances of all the stars defining the upper envelope in the A(Li) – [Fe/H] diagram for metallicities larger than 1.5 dex. The stars are listed below in order of metallicity.
-
1 –
HIP 42887: Deliyannis et al. (1990) give A(Li) 2.50 and [Fe/H] = 1.30; Glaspey et al. (1994) reduce this upper limit to A(Li) 1.20 and assume [Fe/H] = 1.22. Since these are only upper limits for the Li abundance in this star, we do not take this object into account as a tracer of the upper envelope.
-
2 –
HIP 99423: we assume A(Li) = 2.34 and [Fe/H] = 1.53 for this star (averaging on three measures, see Tab.4).
-
3 –
HIP 3026: only one Li detection (A(Li) = 2.35, [Fe/H] = 1.20).
-
4 –
HIP 86321: two A(Li) determinations in substantial agreement (from the compilation of Deliyannis et al. , 1990). We took their average value: A(Li) = 2.27. For the metallicity we preferred the value 1.00, according with the estimate in Cayrel de Strobel et al. (1992).
-
5 –
HIP 108490: we listed three 7Li determinations for this star in Tab.4. They differ by 0.1 – 0.2 dex, the mean value being 2.30. This estimate agrees with the most recent determination of the atmospheric lithium abundance in this star by Stephens et al. (1997) (A(Li) = 2.39).
-
6 –
HIP 79720 (A(Li) = 2.40, [Fe/H] = 0.73) and HIP 29001 (A(Li) = 2.48, [Fe/H] = 0.71). For these two crucial objects we found a Li detection only by Lambert et al. (1991), and an independent confirmation is desirable considering their importance in the economy of the discussion.
-
7 –
The Li I feature in the atmosphere of HIP 112935 is given as W(Li) = 47 mÅ by Deliyannis et al. (1990), referring to the detection by Duncan (1981), whereas Balachandran (1990) gives less than 1 mÅ (A(Li) 0.82). Moreover, both the Lambert et al. (1991) and Boesgaard et al. (1998) estimates (A(Li) 1.28 and A(Li) 0.90, respectively) agree with the Balachandran one. These upper limits and the detection by Duncan are not consistent; we choose the upper limit as the correct indicator of the 7Li content in HIP 112935.
-
8 –
HIP 14181 (A(Li) = 2.31 and [Fe/H] = 0.62) and HIP 21167 (A(Li) = 2.34 and [Fe/H] = 0.61), both single detections from Lambert et al. (1991).
-
9 –
At [Fe/H] 0.5 there are some stars lying around A(Li) 2.40, then a steep rise occurs at [Fe/H] 0.3: HIP 10306, HIP 11783 and HIP 46853 show that the ISM Li abundance rapidly increases to 3.2 –3.3.
Acknowledgements.
It is a pleasure to thank F. D’Antona for useful discussions about nova systems and AGB stars evolution, M. Della Valle for explanations concerning the observed nova outburst rate in the Galaxy at the present time and J. Danziger for useful comments during the course of this work. We also thank E. Casuso and J. Beckman for providing us with a copy of their paper prior to publication. Finally, we would like to thank an anonymous referee for his/her useful suggestions.This research has made use of the SIMBAD data-base, operated at CDS, Strasbourg, France, of the HIPPARCOS catalogue and of NASA’s Astrophysics Data System Abstract Service.
| HD | DM | G | HIP | U | V | W | kin. | ev. s. | |||
|---|---|---|---|---|---|---|---|---|---|---|---|
| HD 400 | BD+35 8 | HIP 699 | -27. | -9. | -9. | 4. | 8. | 4. | disk | to | |
| HD 693 | BD-16 17 | HIP 910 | -19. | -13. | -18. | 0. | 3. | 10. | disk | to | |
| HD 1581 | CPD-65 13 | HIP 1599 | 73. | -4. | -43. | 4. | 5. | 8. | disk | to | |
| HD 2454 | BD+09 47 | HIP 2235 | -13. | -31. | -14. | 3. | 6. | 8. | disk | to | |
| HD 3567 | BD-09 122 | G 270-23 | HIP 3026 | -137. | -236. | -42. | 19. | 32. | 16. | halo | to |
| HD 3823 | CD-60 118 | HIP 3170 | 113. | -18. | -33. | 3. | 4. | 8. | disk | to | |
| HD 4614 | BD+57 150 | HIP 3821 | 30. | -10. | -17. | 5. | 8. | 1. | disk | to | |
| HD 4813 | BD-11 153 | HIP 3909 | -21. | -3. | -12. | 2. | 2. | 10. | disk | to | |
| HD 5015 | BD+60 124 | HIP 4151 | 6. | 21. | 14. | 6. | 8. | 0. | disk | to | |
| HD 6920 | BD+41 219 | HIP 5493 | -35. | 8. | -9. | 6. | 7. | 4. | disk | to | |
| HD 7439 | BD-08 216 | HIP 5799 | 34. | 22. | -8. | 3. | 2. | 9. | disk | to | |
| HD 7476 | BD-01 162 | HIP 5833 | 27. | 42. | -4. | 3. | 3. | 9. | disk | to | |
| HD 9826 | BD+40 332 | HIP 7513 | -28. | -22. | -15. | 6. | 7. | 3. | disk | to | |
| BD+72 94 | G 245-32 | HIP 8314 | -307. | -114. | 28. | 30. | 20. | 16. | halo | to | |
| HD 11112 | CD-42 638 | HIP 8398 | 89. | -43. | -21. | 3. | 3. | 9. | disk | to | |
| HD 13555 | BD+20 348 | HIP 10306 | 20. | -12. | 4. | 7. | 4. | 6. | disk | to | |
| HD 14802 | CD-24 1038 | HIP 11072 | 19. | -17. | -10. | 3. | 2. | 9. | disk | to | |
| HD 15335 | BD+29 423 | HIP 11548 | 25. | 32. | -14. | 7. | 5. | 5. | disk | to | |
| HD 15798 | BD-15 449 | HIP 11783 | -31. | -4. | 18. | 4. | 1. | 9. | disk | to | |
| HD 16031 | BD-13 482 | HIP 11952 | -11. | -101. | -71. | 10. | 20. | 9. | ? | to | |
| HD 16895 | BD+48 746 | HIP 12777 | 31. | 1. | -1. | 8. | 6. | 2. | disk | to | |
| HD 17051 | CD-51 641 | HIP 12653 | 31. | -17. | -7. | 0. | 5. | 9. | disk | to | |
| HD 18768 | BD+46 678 | HIP 14181 | to | ||||||||
| HD 20407 | CD-46 968 | HIP 15131 | 6. | 16. | -14. | 1. | 5. | 8. | disk | to | |
| HD 20807 | CPD-62 265 | HIP 15371 | 70. | -47. | 17. | 1. | 7. | 7. | disk | to | |
| HD 22484 | BD-00 572 | HIP 16852 | -1. | -15. | -42. | 8. | 1. | 7. | disk | to | |
| HD 22879 | BD-03 592 | G 80-15 | HIP 17147 | 105. | -86. | -40. | 7. | 2. | 7. | disk | to |
| HD 26491 | CD-64 143 | HIP 19233 | 39. | -27. | -16. | 1. | 7. | 7. | disk | to | |
| HD 284248 | BD+21 607 | G 8-16 | HIP 19797 | 353. | -147. | -76. | 10. | 19. | 5. | halo | to |
| HD 28620 | BD+36 907 | HIP 21167 | 4. | -4. | 3. | 10. | 3. | 1. | disk | to | |
| HD 30495 | BD-17 954 | HIP 22263 | 21. | -6. | 0. | 7. | 5. | 6. | disk | to | |
| HD 30649 | BD+45 992 | G 81-38 | HIP 22596 | 57. | -81. | -9. | 9. | 5. | 0. | disk | to |
| HD 32778 | CD-56 1071 | HIP 23437 | 76. | 13. | -11. | 1. | 8. | 6. | disk | to | |
| HD 33256 | BD-04 1056 | HIP 23941 | 9. | -6. | 3. | 8. | 4. | 4. | disk | to | |
| HD 34328 | CD-59 1024 | HIP 24316 | 206. | -350. | 100. | 14. | 14. | 17. | halo | to | |
| HD 34721 | BD-18 1051 | HIP 24786 | 36. | -44. | 21. | 7. | 6. | 5. | disk | to | |
| HD 37655 | CD-43 1954 | HIP 26488 | 86. | -22. | 22. | 4. | 8. | 5. | disk | to | |
| HD 39587 | BD+20 1162 | HIP 27913 | -14. | 2. | -7. | 10. | 2. | 0. | disk | to | |
| HD 41330 | BD+35 1334 | HIP 28908 | -6. | -25. | -33. | 10. | 1. | 1. | disk | to | |
| HD 41640 | BD+16 1001 | HIP 29001 | to | ||||||||
| HD 43042 | BD+19 1270 | HIP 29650 | 33. | -19. | -16. | 10. | 2. | 0. | disk | to | |
| HD 43947 | BD+16 1091 | HIP 30067 | 39. | -11. | -2. | 10. | 3. | 0. | disk | to | |
| HD 48938 | CD-27 3248 | HIP 32322 | 24. | 26. | 17. | 5. | 8. | 2. | disk | to | |
| HD 51530 | BD+26 1405 | HIP 33595 | 18. | 31. | -22. | 10. | 2. | 3. | disk | to | |
| HD 53705 | CD-43 2906 | HIP 34065 | 52. | -73. | -20. | 3. | 9. | 3. | disk | to | |
| HD 55575 | BD+47 1419 | HIP 35136 | 80. | -2. | 33. | 9. | 1. | 4. | disk | to | |
| HD 58551 | BD+21 1596 | HIP 36152 | 60. | -4. | -27. | 9. | 3. | 3. | disk | to | |
| G 90-3 | HIP 36430 | sg | |||||||||
| HD 59984 | BD-08 1964 | HIP 36640 | 29. | -51. | -18. | 7. | 7. | 1. | disk | to | |
| HD 61421 | BD+05 1739 | HIP 37279 | -5. | -9. | -19. | 8. | 5. | 2. | disk | to | |
| HD 62407 | BD+13 1750 | HIP 37723 | 23. | -27. | -17. | 8. | 6. | 7. | disk | sg |
| HD 62301 | BD+39 1998 | HIP 37789 | 7. | -109. | -22. | 9. | 4. | 5. | ? | to | |
| HD 63077 | CD-33 4113 | HIP 37853 | 145. | -59. | 41. | 4. | 9. | 1. | ? | to | |
| HD 65907 | CD-59 1773 | HIP 38908 | -12. | -23. | 34. | 1. | 10. | 3. | disk | to | |
| HD 67458 | CD-29 5555 | HIP 39710 | -61. | -6. | 10. | 4. | 9. | 0. | disk | to | |
| HD 69897 | BD+27 1589 | HIP 40843 | 24. | -39. | 7. | 8. | 2. | 5. | disk | to | |
| HD 73524 | CD-39 4574 | HIP 42291 | 27. | 6. | -29. | 2. | 10. | 0. | disk | to | |
| HD 74000 | BD-15 2546 | HIP 42592 | -249. | -359. | 58. | 63. | 35. | 3. | halo | to | |
| HD 74011 | BD+34 1885 | G 115-19 | HIP 42734 | 28. | -70. | 24. | 8. | 3. | 6. | disk | to |
| BD+25 1981 | G 40-34 | HIP 42887 | 43. | -247. | -94. | 8. | 51. | 28. | halo | to | |
| HD 76932 | BD-15 2656 | HIP 44075 | 47. | -92. | 71. | 4. | 8. | 3. | disk | to | |
| HD 79028 | BD+62 1058 | HIP 45333 | -8. | -7. | -9. | 7. | 3. | 7. | disk | to | |
| HD 82328 | BD+52 1401 | HIP 46853 | 57. | -35. | -24. | 7. | 2. | 7. | disk | to | |
| HD 86560 | BD+53 1378 | HIP 49070 | to | ||||||||
| HD 91347 | BD+49 1966 | G 196-33 | HIP 51700 | -50. | 28. | -3. | 5. | 2. | 8. | disk | to |
| HD 91752 | BD+37 2100 | HIP 51914 | -20. | -4. | -16. | 5. | 1. | 9. | disk | to | |
| HD 91889 | BD-11 2918 | HIP 51933 | -68. | -35. | -36. | 2. | 8. | 6. | disk | to | |
| HD 94028 | BD+21 2247 | G 58-25 | HIP 53070 | 33. | -140. | 8. | 4. | 8. | 9. | halo | to |
| HD 95241 | BD+43 2068 | HIP 53791 | 11. | -33. | -10. | 4. | 1. | 9. | disk | to | |
| HD 97916 | BD+02 2406 | HIP 55022 | -108. | 11. | 89. | 18. | 8. | 11. | ? | to | |
| HD 98991 | BD-17 3367 | HIP 55598 | 52. | -35. | -18. | 2. | 8. | 6. | disk | to | |
| HD 99747 | BD+62 1183 | HIP 56035 | 19. | 21. | -31. | 5. | 4. | 8. | disk | to | |
| HD 102634 | BD+00 2843 | HIP 57629 | 29. | -16. | -4. | 1. | 5. | 9. | disk | to | |
| HD 103799 | BD+41 2253 | HIP 58287 | 32. | -25. | 21. | 3. | 1. | 10. | disk | to | |
| HD 106516 | BD-09 3468 | HIP 59750 | -54. | -74. | -59. | 2. | 6. | 8. | disk | to | |
| HD 107113 | BD+87 107 | HIP 59879 | -37. | 14. | 4. | 5. | 7. | 5. | disk | to | |
| HD 108134 | BD+61 1294 | HIP 60588 | -41. | -6. | -35. | 4. | 4. | 8. | disk | to | |
| HD 108177 | BD+02 2538 | G 13-35 | HIP 60632 | -111. | -228. | 51. | 10. | 19. | 14. | halo | to |
| HD 109358 | BD+42 2321 | HIP 61317 | 31. | -4. | 2. | 2. | 2. | 10. | disk | to | |
| HD 110897 | BD+40 2570 | HIP 62207 | 41. | 7. | 76. | 1. | 2. | 10. | disk | to | |
| HD 114762 | BD+18 2700 | G 63-9 | HIP 64426 | 82. | -70. | 59. | 6. | 4. | 10. | disk | to |
| HD 120162 | BD+69 717 | HIP 67109 | to | ||||||||
| HD 121560 | BD+14 2680 | HIP 68030 | 30. | -20. | -3. | 4. | 0. | 9. | disk | to | |
| HD 123710 | BD+75 526 | HIP 68796 | 36. | -8. | 1. | 3. | 7. | 7. | disk | to | |
| HD 126512 | BD+21 2649 | G 166-25 | HIP 70520 | -85. | -84. | -79. | 5. | 3. | 9. | disk | to |
| HD 128167 | BD+30 2536 | HIP 71284 | -2. | 16. | -5. | 3. | 3. | 9. | disk | to | |
| HD 131117 | CD-30 11780 | HIP 72772 | 59. | -36. | 11. | 8. | 4. | 4. | disk | to | |
| HD 134169 | BD+04 2969 | HIP 74079 | -3. | -3. | -1. | 7. | 1. | 8. | disk | sg-to | |
| G 152-35 | HIP 76059 | ||||||||||
| HD 141004 | BD+07 3023 | HIP 77257 | 49. | -24. | -39. | 7. | 2. | 7. | disk | to | |
| HD 142373 | BD+42 2648 | HIP 77760 | 42. | 11. | -67. | 2. | 6. | 8. | disk | to | |
| HD 142860 | BD+16 2849 | HIP 78072 | -56. | -33. | -25. | 6. | 3. | 7. | disk | to | |
| HD 143761 | BD+33 2663 | HIP 78459 | -55. | -35. | 21. | 4. | 5. | 7. | disk | to | |
| BD+42 2667 | G 180-24 | HIP 78640 | -109. | -268. | -28. | 21. | 25. | 14. | halo | to | |
| HD 146588 | BD+19 3076 | HIP 79720 | to | ||||||||
| HD 148816 | BD+04 3195 | G 17-21 | HIP 80837 | -83. | -264. | -81. | 9. | 10. | 6. | halo | to |
| HD 150453 | BD-19 4406 | HIP 81754 | -5. | 10. | 2. | 10. | 1. | 3. | disk | to | |
| HD 155358 | BD+33 2840 | HIP 83949 | to | ||||||||
| HD 157089 | BD+01 3421 | HIP 84905 | 167. | -42. | -9. | 9. | 4. | 4. | halo | to | |
| HD 159332 | BD+19 3354 | HIP 85912 | 28. | -48. | -26. | 7. | 6. | 4. | disk | to | |
| HD 160291 | BD+48 2541 | HIP 86173 | -34. | 8. | -25. | 3. | 8. | 6. | disk | to | |
| BD+18 3423 | G 170-56 | HIP 86321 | 83. | -265. | -50. | 15. | 20. | 9. | halo | to | |
| HD 160693 | BD+37 2926 | G 182-19 | HIP 86431 | -209. | -112. | 85. | 9. | 10. | 6. | halo | to |
| HD 160617 | CD-40 11755 | HIP 86694 | -59. | -216. | -94. | 12. | 29. | 12. | halo | sg | |
| BD-08 4501 | G 20-15 | HIP 87062 | -141. | -49. | -163. | 15. | 17. | 38. | halo | to |
| HD 165908 | BD+30 3128 | HIP 88745 | 6. | 1. | 10. | 5. | 8. | 4. | disk | to | |
| HD 166913 | CD-59 6824 | HIP 89554 | 45. | -48. | 69. | 9. | 6. | 5. | disk | to | |
| HD 167588 | BD+29 3213 | HIP 89408 | -41. | -17. | -17. | 5. | 8. | 3. | disk | to | |
| HD 168151 | BD+64 1252 | HIP 89348 | 6. | -13. | -51. | 1. | 9. | 5. | disk | to | |
| HD 170153 | BD+72 839 | HIP 89937 | -3. | 40. | -3. | 2. | 9. | 5. | disk | to | |
| HD 174912 | BD+38 3327 | G 207-5 | HIP 92532 | 22. | 8. | -42. | 4. | 9. | 3. | disk | to |
| HD 181743 | CD-45 13178 | HIP 95333 | 47. | -334. | -60. | 13. | 52. | 9. | halo | to | |
| HD 186379 | BD+24 3849 | HIP 97023 | -32. | -27. | -46. | 5. | 9. | 2. | disk | to | |
| HD 187691 | BD+10 4073 | HIP 97675 | 3. | -3. | -25. | 6. | 8. | 2. | disk | to | |
| G 24-3 | HIP 98989 | to | |||||||||
| HD 345957 | BD+23 3912 | HIP 99423 | to | ||||||||
| HD 194598 | BD+09 4529 | G 24-15 | HIP 100792 | 74. | -276. | -30. | 7. | 10. | 7. | halo | to |
| HD 195633 | BD+06 4557 | HIP 101346 | 35. | 8. | -24. | 7. | 8. | 5. | disk | sg-to | |
| HD 199288 | CD-44 14214 | HIP 103458 | -22. | -101. | 46. | 8. | 2. | 7. | disk | to | |
| HD 199960 | BD-05 5433 | HIP 103682 | 7. | -24. | -3. | 6. | 6. | 5. | disk | to | |
| HD 200580 | BD+02 4295 | G 25-15 | HIP 103987 | -96. | -75. | 9. | 9. | 9. | 5. | disk | sg |
| HD 201891 | BD+17 4519 | HIP 104659 | -92. | -115. | -59. | 5. | 9. | 4. | ? | to | |
| HD 202628 | CD-43 14464 | HIP 105184 | 12. | 2. | -27. | 7. | 0. | 7. | disk | to | |
| HD 203454 | BD+39 4529 | HIP 105406 | -20. | -2. | -17. | 1. | 10. | 1. | disk | to | |
| HD 205650 | CD-28 17381 | HIP 106749 | 118. | -83. | 11. | 7. | 5. | 9. | disk | to | |
| HD 207129 | CD-47 13928 | HIP 107649 | 13. | -22. | 1. | 6. | 1. | 8. | disk | to | |
| HD 207978 | BD+28 4215 | HIP 107975 | -13. | 16. | -8. | 1. | 9. | 3. | disk | to | |
| HD 208906 | BD+29 4550 | HIP 108490 | -73. | -2. | -12. | 2. | 9. | 3. | disk | to | |
| BD+17 4708 | G 126-62 | HIP 109558 | 302. | -283. | 11. | 42. | 10. | 24. | halo | to | |
| HD 210918 | CD-41 14804 | HIP 109821 | 47. | -92. | -9. | 6. | 1. | 8. | disk | to | |
| HD 211415 | CD-54 9222 | HIP 110109 | 30. | -41. | 7. | 6. | 2. | 8. | disk | to | |
| BD+07 4841 | G 18-39 | HIP 110140 | 267. | -317. | -107. | 107. | 74. | 128. | halo | to | |
| HD 212698 | BD-17 6521 | HIP 110778 | 19. | -6. | -5. | 4. | 4. | 8. | disk | to | |
| G 18-54 | HIP 111195 | -11. | -267. | 51. | 15. | 32. | 24. | halo | to | ||
| HD 214953 | CD-47 14307 | HIP 112117 | -14. | -38. | -6. | 5. | 1. | 9. | disk | to | |
| HD 216385 | BD+09 5122 | HIP 112935 | 58. | -7. | -33. | 2. | 7. | 7. | disk | to | |
| HD 218470 | BD+48 3944 | HIP 114210 | 30. | -9. | 10. | 3. | 9. | 2. | disk | to | |
| HD 218502 | BD-15 6355 | HIP 114271 | to | ||||||||
| HD 219476 | BD+30 4912 | HIP 114838 | to | ||||||||
| HD 219623 | BD+52 3410 | HIP 114924 | -7. | -27. | -22. | 3. | 9. | 1. | disk | to | |
| HD 219617 | BD-14 6437 | G 273-1 | HIP 114962 | -383. | -329. | -58. | 76. | 67. | 13. | halo | to |
| BD+02 4651 | G 29-23 | HIP 115167 | 299. | -453. | -60. | 192. | 206. | 172. | halo | sg | |
| BD+59 2723 | G 217-8 | HIP 115704 | 180. | -186. | -55. | 36. | 18. | 9. | halo | to | |
| HD 221377 | BD+51 3630 | HIP 116082 | sg | ||||||||
| HD 222368 | BD+04 5035 | HIP 116771 | 8. | -27. | -26. | 0. | 6. | 8. | disk | to |
| HIP | Teff | log g | [Fe/H] | W(Li) | A(Li) | upper limits | ref. |
|---|---|---|---|---|---|---|---|
| HIP 699 | 6190 | 4.13 | -0.35 | 22 | +2.18 | 4 | |
| HIP 910 | 6200 | 4.07 | -0.38 | 34 | +2.39 | 4 | |
| HIP 1599 | 6009 | 4.52 | -0.26 (-0.15) | 40 | +2.36 | 6 | |
| HIP 2235 | 6490 | 4.08 | -0.37 | 4 | +1.62 | u | 4 |
| HIP 3026 | 5950 | 4.00 | -1.20 | 45 | +2.35 | 3 | |
| HIP 3170 | 6037 | 4.34 | -0.35 (-0.35) | 45 | +2.44 | 6 | |
| HIP 3821 | 5950 | 4.47 | -0.31 | 21 | +1.98 | 4 | |
| HIP 3909 | 6250 | 4.32 | -0.15 | 64 | +2.77 | 4 | |
| HIP 4151 | 6200 | 3.98 | +0.00 | 2 | +1.10 | u | 4 |
| HIP 5493 | 5800 | 3.88 | -0.21 | 4 | +1.13 | u | 4 |
| HIP 5799 | 6470 | 4.10 | -0.32 | 4 | +1.58 | 4 | |
| HIP 5833 | 6520 | 4.01 | -0.24 | 29 | +2.54 | 4 | |
| HIP 7513 | 6210 | 4.17 | +0.09 | 30 | +2.36 | 4 | |
| HIP 8314 | 6160 | 4.50 | -1.80 | 27 | +2.22 | 3 | |
| 6160 | 3.00 | 27.0 | +2.22 | 5 | |||
| HIP 8398 | 5800 | 4.03 | -0.07 (-0.20) | 57 | +2.37 | 6 | |
| HIP 10306 | 6360 | 4.07 | -0.32 | 64 | +2.84 | 4 | |
| HIP 11072 | 5905 | 4.19 | -0.19 (-0.07) | 51 | +2.40 | 6 | |
| HIP 11548 | 5860 | 4.06 | -0.22 | 52 | +2.34 | 4 | |
| HIP 11783 | 6440 | 3.94 | -0.25 | 81 | +3.03 | 4 | |
| HIP 11952 | 5929 | 4.00 | -2.20 | 28.0 | +2.03 | 1 | |
| 5970 | 3.90 | -1.89 (-1.89) | 28.0 | +2.07 | 7 | ||
| HIP 12777 | 6310 | 4.30 | -0.02 | 67 | +2.84 | 4 | |
| HIP 12653 | 6074 | 4.22 | -0.04 (+0.01) | 38 | +2.39 | 6 | |
| HIP 14181 | 5720 | 4.04 | -0.62 | 61 | +2.31 | 4 | |
| HIP 15131 | 5879 | 4.32 | -0.55 (-0.37) | 15 | +1.79 | 6 | |
| HIP 15371 | 5856 | 4.40 | -0.38 (-0.50) | 3 | +0.93 | u | 6 |
| HIP 16852 | 5980 | 4.15 | -0.15 | 41 | +2.33 | 4 | |
| HIP 17147 | 5740 | 4.10 | -0.60 | 25 | +1.80 | 2 | |
| HIP 19233 | 5744 | 4.19 | -0.28 (-0.30) | 3 | +0.93 | u | 6 |
| HIP 19797 | 5929 | 4.00 | -1.60 | 25.0 | +1.98 | 1 | |
| HIP 21167 | 6140 | 4.06 | (-0.61) | 34 | +2.34 | 4 | |
| HIP 22263 | 5829 | 4.30 | -0.13 (+0.01) | 56 | +2.39 | 6 | |
| HIP 22596 | 5700 | 4.10 | -0.30 | 33 | +1.90 | 2 | |
| 5740 | 4.22 | -0.51 | 2 | +0.76 | u | 4 | |
| HIP 23437 | 5760 | 4.34 | -0.61 (-0.30) | 8 | +1.40 | 6 | |
| HIP 23941 | 6440 | 4.05 | -0.30 | 3 | +1.43 | u | 4 |
| HIP 24316 | 5730 | 4.60 | -1.60 (-1.60) | 32.0 | +1.98 | 7 | |
| HIP 24786 | 6001 | 4.09 | -0.25 (-0.18) | 39 | +2.35 | 6 | |
| HIP 26488 | 5874 | 4.04 | -0.31 (-0.31) | 46 | +2.32 | 6 | |
| HIP 27913 | 5950 | 4.46 | -0.03 | 95 | +2.77 | 4 | |
| HIP 28908 | 5920 | 4.14 | -0.24 | 19 | +1.89 | 4 | |
| HIP 29001 | 6080 | 4.33 | (-0.71) | 49 | +2.48 | 4 | |
| HIP 29650 | 6590 | 4.27 | +0.04 | 6 | +1.86 | 4 | |
| HIP 30067 | 5950 | 4.28 | -0.30 | 38 | +2.25 | 4 | |
| HIP 32322 | 6018 | 4.30 | -0.56 (-0.59) | 33 | +2.27 | 6 | |
| HIP 33595 | 6020 | 3.94 | -0.56 | 3 | +1.16 | u | 4 |
| HIP 34065 | 5812 | 4.33 | -0.36 (-0.26) | 3 | +0.98 | u | 6 |
| HIP 35136 | 5960 | 4.48 | -0.28 | 10 | +1.62 | 4 | |
| HIP 36152 | 6180 | 4.17 | -0.55 | 36 | +2.40 | 4 | |
| HIP 36430 | 5900 | 3.00 | -1.93 | 43.5 | +2.25 | 5 | |
| HIP 36640 | 5980 | 4.18 | -0.74 | 43 | +2.33 | 4 | |
| HIP 37279 | 6700 | 4.03 | -0.02 | 2 | +1.48 | u | 4 |
| HIP 37723 | 5820 | 4.26 | (-0.71) | 18 | +1.78 | 4 | |
| HIP 37789 | 5900 | 4.19 | -0.69 | 27 | +2.03 | 4 | |
| HIP 37853 | 5778 | 4.27 | -0.90 (-0.78) | 8 | +1.41 | 6 | |
| HIP 38908 | 6072 | 4.50 | -0.36 (-0.20) | 3 | +1.20 | u | 6 |
| HIP 39710 | 5962 | 4.47 | -0.24 (-0.06) | 26 | +2.12 | 6 | |
| HIP 40843 | 6360 | 4.35 | -0.26 | 52 | +2.73 | 4 | |
| HIP 42291 | 5972 | 4.32 | -0.01 (+0.06) | 46 | +2.41 | 6 | |
| HIP 42592 | 6223 | 4.50 | -1.80 | 24.5 | +2.16 | 1 | |
| HIP 42734 | 5740 | 4.15 | -0.65 | 16 | +1.69 | 4 | |
| HIP 42887 | 6780 | 4.10 | -1.30 | 12 | +2.50 | u | 2 |
| HIP 44075 | 5861 | 3.50 | -1.10 | 23.0 | +1.96 | 1 | |
| 5970 | 4.37 | -0.82 | 24 | +2.05 | 4 | ||
| 5900 | 3.00 | -0.90 | 26.7 | +2.02 | 5 | ||
| HIP 45333 | 5880 | 4.18 | -0.08 | 11 | +1.63 | 4 | |
| HIP 46853 | 6380 | 4.09 | -0.20 | 102 | +3.15 | 4 | |
| HIP 49070 | 5910 | 4.13 | (-0.59) | 28 | +2.07 | 4 | |
| HIP 51700 | 5870 | 4.24 | -0.48 | 21 | +1.91 | 4 | |
| HIP 51914 | 6490 | 3.92 | -0.23 | 2 | +1.33 | u | 4 |
| HIP 51933 | 6140 | 4.22 | -0.24 | 38 | +2.41 | 4 | |
| HIP 53070 | 5794 | 4.00 | -1.70 | 35.0 | +2.09 | 1 | |
| 5860 | 4.10 | -1.70 | 33 | +2.10 | 2 | ||
| 5800 | 3.00 | -1.51 | 36.6 | +2.09 | 5 | ||
| HIP 53791 | 5890 | 4.05 | -0.30 | 1 | +0.35 | u | 4 |
| HIP 55022 | 6124 | 4.00 | -1.10 | 3.0 | +1.20 | u | 1 |
| 6000 | 3.00 | -1.38 | 5.0 | +1.30 | u | 5 | |
| HIP 55598 | 6640 | 3.98 | -0.11 | 3 | +1.63 | u | 4 |
| HIP 56035 | 6610 | 3.99 | -0.54 | 5 | +1.80 | u | 4 |
| HIP 57629 | 6390 | 4.18 | +0.24 | 33 | +2.53 | 4 | |
| HIP 58287 | 6220 | 4.04 | (-0.43) | 19 | +2.13 | 4 | |
| HIP 59750 | 6067 | 4.30 | -0.40 | 11.0 | +1.80 | u | 1 |
| 6110 | 4.10 | -0.90 | 6 | +1.50 | u | 2 | |
| 6250 | 4.38 | -0.70 | 3 | +1.32 | u | 4 | |
| HIP 59879 | 6390 | 4.07 | -0.54 | 4 | +1.55 | u | 4 |
| HIP 60588 | 5830 | 4.21 | (-0.58) | 20 | +1.85 | 4 | |
| HIP 60632 | 5847 | 4.50 | -1.90 | 35.0 | +2.09 | 1 | |
| 5900 | 4.10 | -1.90 | 24 | +1.90 | u | 2 | |
| 5861 | -1.90 | 29 | +2.00 | 3 | |||
| HIP 61317 | 5880 | 4.52 | -0.19 | 9 | +1.53 | 4 | |
| HIP 62207 | 5794 | 3.90 | -0.30 | 33.0 | +2.10 | 1 | |
| 5800 | 4.15 | -0.59 | 20 | +1.82 | 4 | ||
| HIP 64426 | 5750 | 4.10 | -0.80 | 17 | +1.60 | 2 | |
| 5740 | 4.00 | -0.80 | 25 | +1.88 | 3 | ||
| 5870 | 4.24 | -0.74 | 22 | +1.92 | 4 | ||
| HIP 67109 | 5900 | 4.38 | (-0.80) | 31 | +2.11 | 4 | |
| HIP 68030 | 6190 | 4.36 | (-0.37) | 38 | +2.44 | 4 | |
| HIP 68796 | 5740 | 4.00 | -0.60 | 23 | +1.85 | 3 | |
| HIP 70520 | 5750 | 4.20 | -0.63 | 16 | +1.69 | 4 | |
| HIP 71284 | 6770 | 4.27 | -0.41 | 3 | +1.67 | u | 4 |
| HIP 72772 | 6000 | 4.09 | +0.13 | 66 | +2.60 | 4 |
| HIP 74079 | 5794 | 3.80 | -1.60 | 44.0 | +2.23 | 1 | |
| 5800 | 4.10 | -1.60 | 46 | +2.20 | 2 | ||
| 5800 | 3.00 | 44.0 | +2.18 | 5 | |||
| HIP 76059 | 5600, 5700 | 4.50, 3.80 | -1.75 (-1.61) | 53.7 | +2.13, +2.21 | 7 | |
| HIP 77257 | 5940 | 4.21 | -0.04 | 20 | +1.95 | 4 | |
| HIP 77760 | 5794 | 3.90 | -0.30 | 69.0 | +2.58 | 1 | |
| 5830 | 4.10 | -0.40 | 56 | +2.40 | 2 | ||
| 5840 | 4.34 | -0.52 | 49 | +2.30 | 4 | ||
| HIP 78072 | 6330 | 4.25 | -0.16 | 17 | +2.15 | 4 | |
| HIP 78459 | 5780 | 4.24 | -0.26 | 6 | +1.28 | 4 | |
| HIP 78640 | 5960 | 4.00 | -1.70 | 28 | +2.12 | 3 | |
| HIP 79720 | 5980 | 4.33 | (-0.73) | 38 | +2.40 | 4 | |
| HIP 80837 | 5534 | 4.00 | -0.50 | 17.0 | +1.53 | 1 | |
| 5810 | 4.10 | -0.70 | 18 | +1.70 | 2 | ||
| HIP 81754 | 6440 | 3.86 | -0.31 | 29 | +2.49 | 4 | |
| HIP 83949 | 5870 | 4.19 | -0.67 | 20 | +1.87 | 4 | |
| HIP 84905 | 5861 | 3.70 | -0.50 | 25.0 | +2.11 | 1 | |
| 5735 | 4.10 | -0.60 | 20 | +1.70 | 2 | ||
| HIP 85912 | 6240 | 3.91 | -0.23 | 4 | +1.45 | u | 4 |
| HIP 86173 | 6070 | 4.19 | (-0.61) | 25 | +2.14 | 4 | |
| HIP 86321 | 6067 | 4.00 | -1.00 | 31.0 | +2.19 | 1 | |
| 6140 | 4.00 | -0.80 | 34 | +2.35 | 3 | ||
| HIP 86431 | 5780 | 4.10 | -0.70 | 7 | +1.20 | u | 2 |
| 5710 | 4.00 | -0.70 | 4 | +1.00 | u | 3 | |
| HIP 86694 | 5861 | 3.50 | -1.60 | 42.0 | +2.20 | 1 | |
| 5900 | 3.00 | 42.0 | +2.23 | 5 | |||
| HIP 87062 | 5600 | 3.00 | -1.78 | 28.3 | +1.80 | 5 | |
| 5830, 5900 | 4.00, 4.00 | -1.40 (-1.58) | 35.1 | +2.09, +2.14 | 7 | ||
| HIP 88745 | 5998 | 4.20 | -0.40 | 41.0 | +2.38 | 1 | |
| 6020 | 4.48 | -0.56 | 34 | +2.25 | 4 | ||
| HIP 89554 | 5861 | 3.30 | -1.80 | 40.0 | +2.17 | 1 | |
| HIP 89408 | 5900 | 4.23 | (-0.38) | 41 | +2.26 | 4 | |
| HIP 89348 | 6590 | 4.09 | -0.32 | 2 | +1.40 | u | 4 |
| HIP 89937 | 6152 | 4.30 | -0.30 | 42.0 | +2.52 | 1 | |
| 5920 | 4.10 | -0.30 | 29 | +2.00 | 2 | ||
| HIP 92532 | 5860 | 4.33 | -0.54 | 29 | +2.05 | 4 | |
| HIP 95333 | 5790, 5900 | 4.50, 3.50 | -1.70 (-1.89) | 40.6 | +2.13, +2.21 | 7 | |
| HIP 97023 | 5880 | 4.11 | (-0.55) | 40 | +2.22 | 4 | |
| HIP 97675 | 6150 | 4.14 | +0.09 | 63 | +2.69 | 4 | |
| HIP 98989 | 5800 | -1.63 | 28.5 | +1.97 | 5 | ||
| HIP 99423 | 5596 | 4.00 | -1.70 | 67.0 | +2.23 | 1 | |
| 5720 | 4.00 | -1.30 | 73 | +2.40 | 3 | ||
| 5600 | 3.00 | -1.59 | 80.8 | +2.38 | 5 | ||
| HIP 100792 | 5808 | 4.00 | -1.60 | 29.0 | +2.00 | 1 | |
| HIP 101346 | 5840 | 3.80 | -0.90 | 40 | +2.15 | 3 | |
| HIP 103458 | 5727 | 4.35 | -0.82 (-0.64) | 3 | +0.86 | u | 6 |
| HIP 103682 | 5810 | 4.20 | +0.11 | 53 | +2.32 | 4 | |
| HIP 103987 | 5730 | 3.50 | -0.70 | 32 | +2.00 | 3 | |
| HIP 104659 | 5794 | 4.50 | -1.40 | 23.0 | +1.89 | 1 | |
| 5810 | 4.10 | -1.40 | 27 | +1.90 | 2 | ||
| 5850 | 4.50 | -1.00 | 27 | +2.08 | 3 | ||
| 5870 | 4.46 | -1.06 | 21 | +1.90 | 4 | ||
| HIP 105184 | 5771 | 4.52 | -0.14 | 41 | +2.17 | 6 | |
| HIP 105406 | 5750 | 4.10 | -0.30 | 64 | +2.40 | 2 |
| HIP 106749 | 5728 | 4.00 | -1.30 | 18.0 | +1.67 | 1 | |
| HIP 107649 | 5948 | 4.13 | -0.15 (-0.05) | 38 | +2.29 | 6 | |
| HIP 107975 | 5780 | 4.10 | -0.50 | 5 | +1.10 | u | 2 |
| HIP 108490 | 5900 | 4.10 | -0.50 | 43 | +2.20 | 2 | |
| 5960 | 4.00 | -0.90 | 50 | +2.40 | 3 | ||
| 6010 | 4.41 | -0.72 | 38 | +2.30 | 4 | ||
| HIP 109558 | 5810 | 4.10 | -2.00 | 25 | +1.90 | 2 | |
| 5890 | 4.00 | -1.70 | 25 | +1.98 | 3 | ||
| HIP 109821 | 5802 | 4.43 | -0.18 (+0.10) | 3 | +0.94 | u | 6 |
| HIP 110109 | 5870 | 4.35 | -0.36 (-0.32) | 10 | +1.60 | 6 | |
| HIP 110140 | 5920 | 4.00 | -1.20 | 37 | +2.24 | 3 | |
| HIP 110778 | 5915 | 4.50 | -0.13 (-0.14) | 114 | +2.89 | 6 | |
| HIP 111195 | 5800 | 3.00 | -1.33 | 34.9 | +2.07 | 5 | |
| HIP 112117 | 6069 | 4.49 | -0.09 (+0.07) | 65 | +2.67 | 6 | |
| HIP 112935 | 6067 | 3.90 | -0.62 | 47.0 | +2.53 | 1 | |
| 6290 | 3.97 | -0.25 | 2 | +1.28 | u | 4 | |
| HIP 114210 | 6600 | 4.21 | -0.13 | 4 | +1.72 | u | 4 |
| HIP 114271 | 6000 | 3.00 | -1.96 | 30.0 | +2.16 | 5 | |
| HIP 114838 | 5930 | 4.01 | (-0.68) | 2 | +0.91 | u | 4 |
| HIP 114924 | 6130 | 4.21 | +0.00 | 64 | +2.68 | 4 | |
| HIP 114962 | 5662 | 3.90 | -1.40 | 42.0 | +2.04 | 1 | |
| 5820 | 4.10 | -1.40 | 43 | +2.20 | 2 | ||
| 5870 | 4.50 | -1.50 | 40 | +2.20 | 3 | ||
| HIP 115167 | 5794 | 4.00 | -2.30 | 27.0 | +1.92 | 1 | |
| HIP 115704 | 5830 | 4.00 | -1.60 | 25 | +1.95 | 3 | |
| HIP 116082 | 6000 | 3.50 | -1.10 | 6 | +1.45 | u | 3 |
| 6320 | 3.89 | (-0.72) | 3 | +1.41 | u | 4 | |
| HIP 116771 | 5998 | 3.90 | -0.50 | 22.0 | +2.05 | 1 | |
| 6260 | 4.16 | -0.17 | 18 | +2.14 | 4 |
References
- [] Abia, C., Boffin, H.M.J., Isern, J., Rebolo, R. 1991, A&A 245, L1
- [] Abia, C., Boffin, H.M.J., Isern, J., Rebolo, R. 1993a, A&A 272, 455
- [] Abia, C., Isern, J., Canal, R. 1993b, A&A 275, 96
- [] Abia, C., Isern, J., Canal, R. 1995, A&A 298, 465
- [] Allen, C.W. 1954, MNRAS 114, 387
- [] Alonso, A., Arribas, S., Martinez-Roger, C. 1996, A&A 313, 873
- [] Anders, E., Grevesse, N. 1989, Geochim. Cosmochim. Acta 53, 197
- [] Balachandran, S. 1990, ApJ 354, 310
- [] Bath, G.T., Shaviv, G. 1978, MNRAS 183, 515
- [] Beers, T.C., Preston, G.W., Shectman, S.A. 1992, AJ 103, 1987
- [] Beers, T.C., Preston, G.W., Shectman, S.A., Kage, J.A. 1990, AJ 100, 849
- [] Beers, T.B., Sommer-Larsen, J. 1995, ApJSupp 96, 175
- [] Bertelli, G., Bressan, A., Chiosi, C., Fagotto, F., Nasi, E. 1994, A&ASupp 106, 275
- [] Boesgaard, A.M., Deliyannis, C.P., Stephens, A., Lambert, D.L. 1998, ApJ 492, 727
- [] Boffin, H.M.J., Paulus, G., Arnould, M., Mowlavi, N. 1993, A&A 279, 173
- [] Bonifacio, P., Centurion, M., Molaro, P. 1999, MNRAS, in press
- [] Bonifacio, P., Molaro, P. 1997, MNRAS 285, 847
- [] Cameron, A.G.W., Fowler, W.A. 1971, ApJ 164, 111
- [] Cayrel, R., Spite, M., Spite, F., Vangioni-Flam, E., Cassé, M., Audouze, J. 1999, A&A 343, 923
- [] Cayrel de Strobel, G., Hauck, B., François, P., Thévenin, F., Friel, E., Mermilliod, M., Borde, S. 1992, A&ASupp 95, 273
- [] Chamcham, K. 1998, private communication
- [] Chiappini, C., Matteucci, F., Gratton, R. 1997, ApJ 477, 765
- [] Chiosi, C., Bertelli, G., Bressan, A. 1992, Ann. Rev. A&A 30, 235
- [] Ciardullo, R., Ford, H.C., Williams, R.E., Tamblyn, P., Jacoby, G.H. 1990, AJ 99, 1079
- [] D’Antona, F., 1998, private communication
- [] D’Antona, F., Matteucci, F. 1991, A&A 247, L37
- [] Deliyannis, C.P., Demarque, P., Kawaler, S.D. 1990, ApJSupp 73, 21
- [] Della Valle, M., Livio, M. 1994, A&A 286, 786
- [] Duncan, D.K. 1981, AJ 248, 651
- [] Duncan, D.K., Primas, F., Rebull, L.M., Boesgaard, A.M., Deliyannis, C.P., Hobbs, L.M., King, J.R., Ryan, S.G. 1997, ApJ 488, 338
- [] Duncan, D.K., Rebull, L.M. 1996, PASP 108, 738
- [] Fields, B.D., Olive, K.A. 1999, New Astronomy 4, 255
- [] García López, R.J., Lambert, D.L., Edvardsson, B., Gustafsson, B., Kiselman, D., Rebolo, R. 1998, ApJ 500, 241
- [] Gehrz, R.D., Truran, J.W., Williams, R.E., Starrfield, S. 1998, PASP 110, 3
- [] Glaspey, J.W., Pritchet, C.J., Stetson, P.B. 1994, AJ 108, 271
- [] Hatano, K., Branch, D., Fisher, A., Starrfield, S. 1997, MNRAS 290, 113
- [] Hernanz, M., José, J., Coc, A., Isern, J. 1996, ApJ 465, L27
- [] Hobbs, L.M., Thorburn, J.A. 1997, ApJ 491, 772
- [] Iben, I.Jr. 1973, ApJ 185, 209
- [] Johnson, D.R.H., Soderblom, D.R. 1987, AJ 93, 864
- [] José, J., Hernanz, M. 1998, ApJ 494, 680
- [] Kopylov, I.M. 1955, Izv. Krymskoi Astrofiz. Obs. 13, 23
- [] Lambert, D.L., Heath, J.E., Edvardsson, B. 1991, MNRAS 253, 610
- [] Lemoine, M., Ferlet, R., Vidal-Madjar, A. 1995, A&A 298, 879
- [] Lemoine, M., Vangioni-Flam, E., Cassé, M. 1998, ApJ 499, 735
- [] Liller, W., Mayer, B. 1987, PASP 99, 606
- [] Livio, M. 1994, in Interacting Binaries, ed. H. Nussbaumer & A. Orr (Berlin, Springer), 135
- [] Marigo, P., Bressan, A., Chiosi, C. 1996, A&A 313, 545
- [] Matteucci, F., D’Antona, F., Timmes, F.X. 1995, A&A 303, 460
- [] Matteucci, F., Romano, D., Molaro, P. 1999, A&A 341, 458
- [] Mazzitelli, I., D’Antona, F., Ventura, P., Zeppieri, A. 1999 in Theory and tests of convective energy transport, PASP, in press
- [] Molaro, P., Bonifacio, P., Castelli, F., Pasquini, L. 1997, A&A 319, 593
- [] Norris, J.E., Ryan, S.G., Beers, T.C. 1997, ApJ 488, 350
- [] Pasquini, L., Liu, Q., Pallavicini, R. 1994, A&A 287, 191
- [] Pilachowski, C.A., Sneden, C., Booth, J. 1993, ApJ 407, 699
- [] Pinsonneault, M.H., Deliyannis, C.P., Demarque, P. 1992, ApJSupp 78, 179
- [] Plez, B., Smith, V.V., Lambert, D.L. 1993, ApJ 418, 812
- [] Rebolo, R., Molaro, P., Beckman, J.E. 1988, A&A 192, 192 (RMB)
- [] Ryan, S.G., Deliyannis, C.P. 1998, ApJ 500, 398
- [] Ryan, S.G., Norris, J.E., Beers, T.C. 1999, ApJ submitted
- [] Sackmann, I.J., Boothroyd, A.I. 1992, ApJ 392, L71
- [] Sandage, A., Fouts, G. 1987, AJ 93, 74
- [] Shafter, A.W. 1997, ApJ 487, 226
- [] Shara, M.M., Livio, M., Moffat, A.F.J., Orio, M. 1986, ApJ 311, 163
- [] Sharov, A.S. 1972, Soviet Astron. 16, 41
- [] Smith, V.V., Lambert, D.L. 1990, ApJ 361, L69
- [] Smith, V.V., Lambert, D.L., Nissen, P.E. 1993, ApJ 408, 262
- [] Smith, V.V., Plez, B., Lambert, D.L., Lubowich, D.A. 1995, ApJ 441, 735
- [] Spite, M., François, P., Nissen, P.E., Spite, F. 1996, A&A 307, 172
- [] Spite, M., Maillard, J.P., Spite, F. 1984, A&A 141, 56
- [] Spite, F., Spite, M. 1982, A&A 115, 357
- [] Spite, F., Spite, M. 1986, A&A 163, 140
- [] Starrfield, S., Truran, J.W., Sparks, W.M., Arnould, M. 1978, ApJ 222, 600
- [] Steigman, G., Walker, T.P. 1992, ApJ 385, L13
- [] Stephens, A., Boesgaard, A.M., King, J.R., Deliyannis, C.P. 1997, ApJ 491, 339
- [] Timmes, F.X., Woosley, S.E., Weaver, T.A. 1995, ApJSupp 98, 617
- [] Thorburn, J.A. 1994, ApJ 421, 318
- [] Vauclair, S. 1988, ApJ 335, 971
- [] Vauclair, S., Charbonnel, C. 1995, A&A 295, 715
- [] Wallerstein, G., Conti, P.S. 1969, Ann. Rev. A&A 7, 99
- [] Weidemann, V. 1967, Z. Astrophys. 67, 286
- [] Woosley, S.E., Hartmann, D.H., Hoffman, R.D., Haxton, W.C. 1990, ApJ 356, 272
- [] Woosley, S.E., Weaver, T.A. 1995, ApJSupp 101, 181
- [] Yuan, J.W. 1989, A&A 224, 108