X-ray-emitting Atmospheres of B2 Radio Galaxies
Abstract
We report ROSAT PSPC spatial and spectral analysis of the eight B2 radio galaxies NGC 315, NGC 326, 4C 35.03, B2 0326+39, NGC 2484, B2 1040+31, B2 1855+37, and 3C 449, expected to be representative of the class of low-power radio galaxies. Multiple X-ray components are present in each, and the gas components have a wide range of linear sizes and follow an extrapolation of the cluster X-ray luminosity/temperature correlation, implying that there is no relationship between the presence of a radio galaxy and the gas fraction of the environment. No large-scale cooling flows are found. There is no correlation of radio-galaxy size with the scale or density of the X-ray atmosphere. This suggests that it is processes on scales less than those of the overall gaseous environments which are the major influence on radio-source dynamics. The intergalactic medium is usually sufficient to confine the outer parts of the radio structures, in some cases even to within 5 kpc of the core. In the case of NGC 315, an extrapolation suggests that the pressure of the atmosphere may match the minimum pressure in the radio source over a factor of in linear size (a factor in pressure).
1 Introduction
Sensitive ROSAT observations have shown that low-power radio galaxies display a mixture of X-ray emission components from a combination of processes. The dominant components are usually (a) an extended atmosphere of X-ray emitting gas and (b) unresolved emission whose primary origin is most likely to be non-thermal radiation associated with the radio-emitting plasma in the innermost parts of the source (Worrall & Birkinshaw 1994; Hardcastle & Worrall 1999). The balance of these and other emission components differs from galaxy to galaxy, and each source must be observed in detail in order to disentangle the emission processes and probe the physics.
The X-rays associated with the most compact active regions of radio galaxies are likely to originate not only as emission from the inner jets, which are affected by relativistic beaming, but also as more isotropically-emitted radiation produced even closer to the central engine of the AGN. Since radio galaxies do not shine as brightly in compact X-ray emission as Seyfert galaxies and quasars, this AGN component is suppressed, due either to low radiative efficiency of accretion-related thermal emission or to asymmetric obscuration. In the latter case the AGN’s contribution to the compact emission should increase towards higher X-ray energies. If models of source unification are to be addressed in the X-ray, the extended non-nuclear emission must be measured and removed to reveal the uncontaminated nuclear properties of the active galaxy.
The existence of an extended X-ray emitting medium is probably essential for prominent radio jets to develop, but to find trends in the morphology of radio structures with gas density and distribution requires studies of the atmospheres on a source-by-source basis. Excluding roughly the inner kpc, it seems in general that the external medium supplies more than enough pressure to confine the radio jets of low-power radio galaxies, assuming a jet pressure calculated using minimum-energy arguments (e.g., Morganti et al. 1988; Killeen, Bicknell & Ekers 1988; Feretti et al. 1995; Trussoni et al. 1997). In some cases an apparent evacuation of the external medium within the jets argues that additional jet pressure is required and must be supplied by something other than thermal material (e.g., Böhringer et al. 1993; Hardcastle, Worrall & Birkinshaw 1998). Such ‘light’ jets should then be affected by buoyancy forces (e.g., Worrall, Birkinshaw & Cameron 1995), and it is of interest to examine how morphological features, such as the disruption of jets into lobe emission, map onto abrupt or gradual changes in the X-ray emitting environment. In exceptional cases it appears that relatively low-powered jets on scales of tens to hundreds of kpc remain overpressured with respect to the external medium (e.g., Birkinshaw & Worrall 1993).
The X-ray emitting medium may play an important role in the fueling of the central engine, particularly if it is involved in a cooling flow that continues into the nuclear regions. However, observations with excellent spatial resolution are needed to distinguish the central part of a cooling flow from the smaller-scale emission associated with the inner radio jets or the AGN itself.
This paper presents a thorough analysis of eight low-power radio galaxies using the best available X-ray data. In §2 we describe the selection of sources, the extent to which they are representative of their parent B2-galaxy sample, and the ROSAT observations. §3 and §4 describe the spatial and spectral distributions of the X-ray emission. In §5 we discuss the physical characteristics of the X-ray emitting environments and how their pressures compare with those of the kpc-scale radio jets. §6 discusses in more detail the giant radio source NGC 315, whose X-ray emission is the most compact amongst the sample objects. Appendix A gives notes and comparisons with previous X-ray work for the other seven radio galaxies of the sample. Our conclusions are summarized in §7.
Throughout the paper we adopt a Friedmann cosmological model with = 50 km s-1 Mpc-1, = 0.
2 Sample Selection and X-ray Exposures
The complete subset of 50 sources from the B2 radio survey identified with elliptical galaxies brighter than (Colla et al. 1975; Ulrich 1989) is the largest unbiased sample of exclusively low-power radio galaxies studied with sensitive pointed X-ray observations to date. 40 of the sources were observed in ROSAT pointings, half by us through various announcements of opportunity as, taking into account sources observed by others, we defined sub-samples with increasingly broader selection criteria so that the largest possible and least biased subset would have been observed at any one time. Following the demise of ROSAT in February 1999, a summary of the X-ray results for the sample was prepared and appears in Canosa et al. (1999), which also references published detailed work by us and others for some of the individual objects.
Most B2 sample sources were observed with the ROSAT High Resolution Imager (HRI), but earlier in the mission observations could be made with the Position Sensitive Proportional Counter (PSPC) which, while having a poorer spatial response than the HRI, had spectral capabilities and was more sensitive to faint diffuse X-ray structures (Briel et al. 1996).
We observed eight sample members (Table X-ray-emitting Atmospheres of B2 Radio Galaxies) with the PSPC, four of which (NGC 315, 4C 35.03, NGC 2484, 3C 449) were also observed later with the ROSAT HRI by us or others in order to probe in more detail the nuclear part of the structure. Figure 1 plots histograms of redshift, absolute V-band galaxy magnitude, and 408 MHz radio power for the complete sub-sample of the 47 out of 50 B2 sample objects with , indicating with solid shading the eight sources discussed in the present paper. Only in absolute radio power are the eight observed sources unrepresentative of the sample as a whole, being biased towards high power: a KS test gives a probability of only of the sub-sample being drawn at random in radio power, whereas similar tests for redshift and galaxy magnitude give probabilities . This bias in total radio power was unintentional, but most likely occurs through our placement of sources with better radio data at higher priority for X-ray observation. For our observations we also avoided sources in known clusters (several B2 radio galaxies are in Abell clusters), although this was a priority for other observers. Six of the sources had no previous X-ray observations and two had been observed with the Einstein Observatory: NGC 315 is reported as unresolved and variable at significance between two observations separated by about 7 months (Fabbiano, Kim & Trinchieri 1992), whereas the emission from 3C 449 was resolved by the Imaging Proportional Counter (Miley et al. 1983). Only three other B2 bright-sample radio galaxies which are not in the Coma cluster or an Abell cluster have on-axis exposures of ks with the ROSAT PSPC, and all exhibit extended X-ray emission: 3C 31 (Trussoni et al. 1997; Komossa & Böhringer 1999), NGC 507 (Kim & Fabbiano 1995), and NGC 3665 (Massaglia et al. 1996).
Dates and exposure times for the PSPC observations reported here are given in Table 2, along with net counts within a radius large enough to incorporate most of the extended emission. Earlier reports on some aspects of these data for five of the sources appear in Worrall & Birkinshaw (1994), Worrall et al. (1995), and Hardcastle et al. (1998). A discussion of the extended emission in 0326+39, 1040+31, and 1855+37 has not appeared elsewhere. In this paper we present results derived in a consistent fashion for the gaseous X-ray emitting environments of all eight sources, and we compare these environments and discuss their relationships to the radio structures that they host.
The observations of NGC 315 were split into two observing periods separated by six months. Because of the reported variability in the Einstein data, and in order to measure the level of likely systematic error in our analysis procedures, we treated the two exposures separately for much of the analysis. The fluxes measured in the two exposures are in good agreement (Table 2) and do not confirm the earlier reports of variability.
3 Spatial distribution of X-ray emitting gas
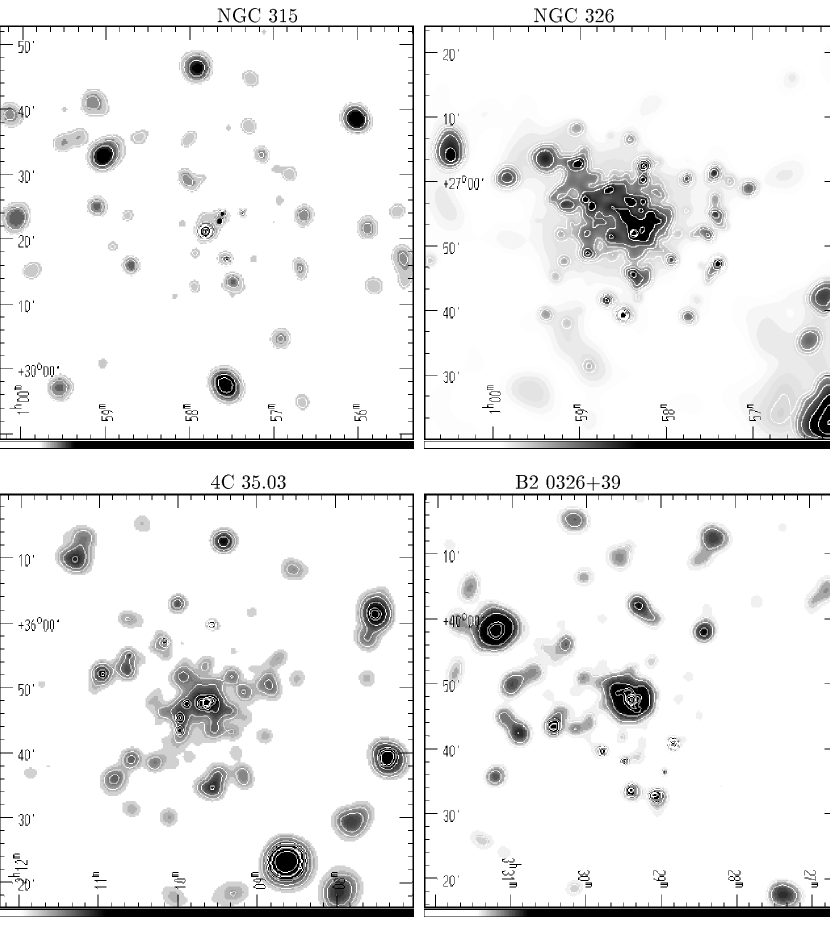
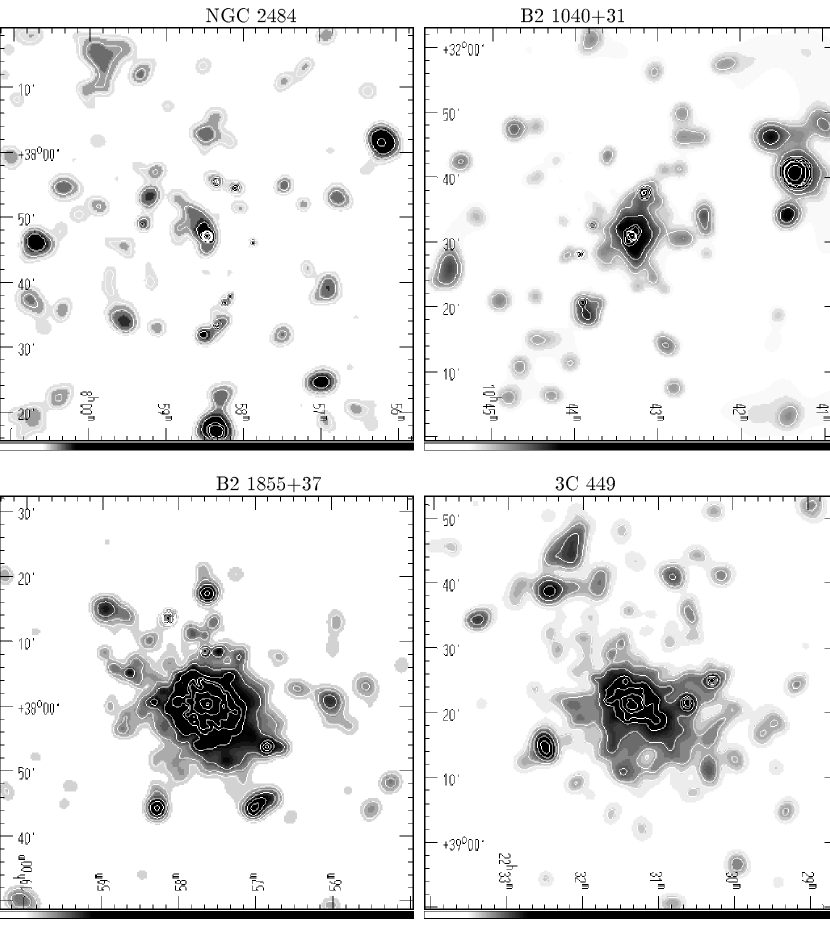
X-ray images of all eight sources are presented in Figures 2 and 3. For these images the Extended Source Analysis Software (EXAS) of Snowden (1995) was used to model and subtract background components and correct for exposure and vignetting, except for NGC 326 which used an earlier procedure which was based on IRAF/Post Reduction Off-line Software (PROS) tools and which was found to give similar results (Worrall et al. 1995). The adaptive smoothing technique described by Worrall et al. (1995) has been applied to all the images in order that the display should distinguish clearly between unresolved sources and diffuse emission. The PSPC point response function (PRF) increases at off-axis angles, as is evident in the images. Extended emission is seen around all the radio galaxies, which lie in the center of the fields. The angular extent is not anti-correlated with luminosity distance, as would be expected if the radio galaxies are in environments of similar spatial scale.
Although asymmetries are evident in the gas distributions, the construction of a radial profile, after subtraction of emission from contaminating unresolved sources, is a useful tool for characterizing with a small number of parameters the spatial distribution of gas. It is a reasonably robust way of separating unresolved emission associated with the radio galaxy, and the models can be extrapolated to radii where emission no longer lies significantly above the level of the background in order to get the best possible measurement of the total luminosity of the source. In comparison with Worrall & Birkinshaw (1994) and Canosa et al. (1999) the on-source extractions used in our radial profiles are generally to larger radii, to allow a better description of the fall-off of gas with radius and a more precise determination of gas temperature. The fitting is therefore less good at characterizing the properties of compact, unresolved, emission. Several faint nearby contaminating unresolved sources were defined by eye as localized excesses, and regions of typically 1 to 2.5 arcmin in radius enclosing them were excluded from the on-source and background areas for both structural and spectral analyses.
Single component -models111Counts per unit area per unit time described by , describing gas in hydrostatic equilibrium (e.g., Sarazin 1986), and a combination of -model and unresolved emission, have been convolved with the energy-dependent PRF and fitted to the radial profile for each source. Only counts within the energy band for which the PRF is well modelled (0.2-1.9 keV; Briel et al. 1996) are used in the spatial analysis. In contrast to Worrall & Birkinshaw (1994) who assumed , fits were performed for a range of between 0.35 and 0.9. In general results are fairly insensitive to , but the values of and core radius, , are highly correlated, as shown in Figure 4, making FWHM a better indicator of spatial extent than . Radial profiles and the best-fit models are given in Figure 5, and parameter values are listed in Table 3. All profiles are significantly improved by the inclusion of nuclear unresolved emission, except perhaps for NGC 315. In most sources the fraction of counts in this unresolved emission is relatively small, largely due to a large on-source extraction radius.
4C 35.03, NGC 2484, and 3C 449 were also observed with the HRI (see notes in Appendix A). In each case the amount of nuclear unresolved flux as measured with the PSPC matches that measured with the HRI, and so we can conclude that the compact component is more peaked and of angular size a factor of 3–4 times smaller than the PSPC PRF shown in Figure 5. The more complicated case of NGC 315 is discussed in §6.
4 The X-ray spectra
Spectral fits to the data were carried out over the full energy range of the PSPC, and results are given in Table 4. For sources where the spatial fitting gives of the counts in a central component we have attempted a two-component (thermal plus power-law) spectral fit. The relative numbers of counts in the two components are generally less well constrained than in the radial-profile component separation; results in column 5 of Table 4 (expressed only over the energy band 0.2-1.9 keV for consistency with the spatial separation) can be compared with column 2 of Table 3. Best-estimate fluxes, luminosities (Table 4) and temperatures (Table 5) for the thermal gas are interpolated from the single-component and two-component fits. Spectral fits assume the only absorption to be that due to gas in the line of sight in our Galaxy, and we have fixed the abundances at 30% solar, consistent with results for more luminous clusters. The abundance fraction is fairly poorly constrained by the PSPC data, particularly for two-component fits. However, for all sources the best fit is for % solar, and fits with 100% solar abundances give values of more than 2.7 larger than , indicating they are unacceptable at % confidence. Although the PSPC’s spectral resolution is relatively poor, the peak response is well matched to the temperatures found for the gaseous distributions around these radio galaxies.
5 Characteristics of the Radio-Galaxy Environments
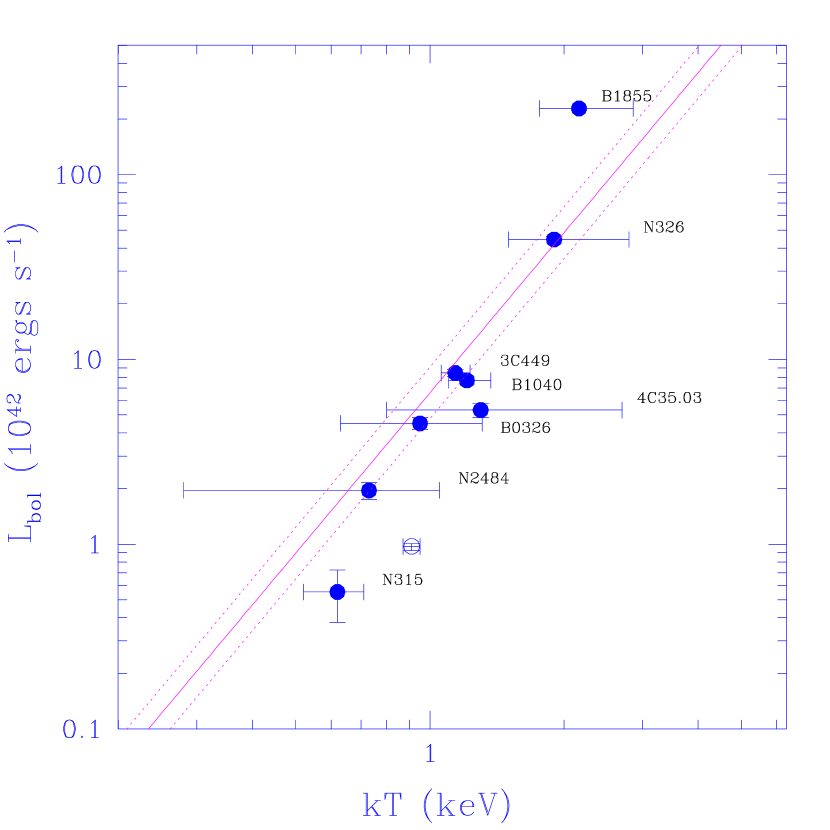
In Figure 6 we compare the bolometric luminosity and temperature of the X-ray emitting gas around each radio galaxy to the extrapolated but well constrained luminosity-temperature () relation for more luminous clusters (with keV) from Arnaud & Evrard (1999). Agreement is good. Since X-ray luminosity is governed by the gas mass while the temperature is determined by the total gravitating mass, the result implies that there is no relationship between the presence of a radio galaxy and the gas fraction of the environment. This is an interesting point, since the X-ray gas may play a role in the fuelling of radio galaxies, particularly in the presence of cooling flows. However, as seen from Table 5, NGC 315 is the only source with a central cooling time which is much less than the Hubble time, and this is the only source for which the gas distribution is of galaxy size rather than cluster (or group) size. There is no evidence for cluster-scale cooling flows in the present data.
Radio-source size is not correlated with the size of the X-ray emitting medium (Figure 7), where note that FWHM (Table 3) is a scale factor for the size of the X-ray emitting medium rather than its total (much larger) extent. The lack of a correlation is perhaps not surprising, given that the sound crossing time in X-ray gas of extent kpc, at Myr, is comparable to typical radiative ages of low-power radio galaxies, at Myr (Parma et al. 1999), and so only for the oldest sources might it be expected that the gas has had time to adjust to the presence of the radio galaxy. Conversely, the lack of correlation suggests that it is small-scale processes, on size scales less than those of the overall gaseous environments, which are the major influence on radio-source dynamics and propagation.
As the spatial resolution of X-ray measurements improves, it is not surprising that inferred central gas densities decrease, as gas is resolved into larger regions. Morganti et al. (1988) infer significantly higher central densities than our values (Table 5) for a sub-sample of B2 radio galaxies measured with Einstein, although none of the objects is in common with sources in this work. Moreover, they tentatively claim an anti-correlation between largest linear extent of radio source and central gas density, interpreting this to be evidence that the gas has a direct influence on the morphology of the radio source. No such anti-correlation is evident in our results (Figure 8), and again this can be understood in terms of the long timescale for X-ray gas to react to the influence of a radio source.
For all the sources we have compared minimum pressures in various parts of the radio structures with the pressure from the X-ray gas. For the radio pressure calculations it was assumed that the synchrotron spectrum extends above 50 MHz, that the electron energy spectrum is of form, and that electrons and protons contribute equally to the internal energy. Results for six of the sources are given in Figure 9, and individual notes appear in the Appendix A and §6.
Within the limitations of the available radio-mapping data, the diffuse outer parts of all eight radio sources exhibit minimum pressures close to or below the local pressures implied by the best-fit X-ray atmospheres. In inner parts of the sources, where strong jets are seen, the minimum pressures in the kpc-scale structures sometimes lie above the pressure of the ambient gas. Thus if we are to believe that the radio structures are in pressure equilibrium with the external medium, we require that at small angles from the cores there be an additional confinement mechanism, while at large angles from the cores additional internal pressure is needed. There are several mechanisms for additional internal or external pressure. By definition, the minimum pressures are likely to be underestimates, with higher true pressures likely if the sources have substructure, contain a large population of non-radiating relativistic particles or entrained ambient material (on which limits can be placed by depolarization studies if the magnetic field has a simple topology), or are simply far from equipartition. If the sources are not in the plane of the sky, then projection effects tend to overestimate the local ambient pressures. Additional external confinement may be provided by magnetic fields or local pressure enhancements near the radio sources and associated with the source dynamics.
There are three exceptions to this general pattern. 3C 449 and 4C 35.03 are underpressured over their entire structures, and NGC 315 may remain close to pressure equilibrium throughout its length. NGC 315 is 1.7 Mpc in size, easily the largest in our sample, and here an extrapolation beyond the region of clear X-ray detection suggests the source may remain close to pressure equilibrium over a factor variation in the ambient gas pressure. We would speculate that it is because NGC 315 is close to pressure equilibrium that it is able to grow to such a large scale. The detected X-ray emitting atmosphere extends only to arcmin (70 kpc), however. Thus it is not certain that the extrapolated X-ray pressure estimates at the largest scale of the source are realistic.
6 The Special Case of NGC 315
The spatial structure of the X-ray emission around NGC 315 is unique amongst the sample in its compactness. Canosa et al. (1999) attributed all the (mildly extended) ROSAT HRI flux, within an on-source extraction radius of 50 arcsec, to unresolved emission of luminosity ergs s-1 (statistical errors), because of limitations due to the aspect-correction errors in the ROSAT Standard Analysis Software System (SASS) data. However, the PSPC data show that extended emission is definitely present (Fig. 5), and the nature of the most compact regions of the source need further investigation.
Although the PSPC spatial analysis prefers the presence of a point source with only marginal significance (and not at all when the two observations are combined), a substantial AGN-related contribution to the PSPC data seems justified since
-
1.
there is a significant improvement in spectral fits when a power-law component is included (Table 4),
-
2.
a two-temperature thermal fit (assuming 30% cosmic abundances) gives 56% of the counts in a thermal of temperature 0.6 keV, and the rest in a hot component of 2.8 keV, in which case the temperature is surprisingly high given the emission’s compactness and luminosity (Fig. 6), and
-
3.
the presence of significant power-law emission is suggested by the relatively strong radio core and the correlation of radio-core and compact-X-ray luminosity shown by the larger sample of B2 radio galaxies, including NGC 315 (Canosa et al. 1999).
However, the luminosity in unresolved emission from the PSPC spectral (and spatial) fitting, at ergs s-1, is significantly smaller than the total luminosity in the HRI data, and roughly equal to the contribution from gas measured with the PSPC. This suggests that the unresolved emission increased by a factor up to two (depending on the precise contribution of thermal emission to the HRI flux) in the two years separating the PSPC and HRI observations. This is not impossible if the emission is non-thermal and radio-related in nature, and the result is supported by the earlier Einstein report of variability.
We have re-examined the HRI data for spatial extent after first applying software just released to correct approximately the effects of a recently identified programming error in the SASS aspect-correction software (Harris 1999). The result is that the HRI data still give an unacceptable fit to the nominal PRF, and prefer a single-component -model, but of very small core radius ( arcsec, ), inconsistent with the PSPC data. The extent of residual aspect errors is uncertain, but broadening the PRF by a few arcsec results in a combination of a point source and beta component being the preferred model, and brings results into closer agreement with those from the PSPC data.
A further complication is that this is the only source from the current sample where the cooling time is sufficiently short (Table 5) to suggest the presence of a cooling flow. However, although the cooling time is estimated to equal the Hubble time at a radius of kpc, there is no abrupt steepening in the PSPC radial profile at such a radius (Fig. 5) as might be expected from the on-set of a cooling flow. If for the HRI data a single-component cooling-flow model fit (of the type described in Hardcastle, Worrall & Birkinshaw 1999) is attempted, then no improvement over a point source plus -model is achieved unless the cooling radius of the gas is kpc, which not only implies an atmosphere less than Myr old, but also is inconsistent with the larger cooling radius suggested by the PSPC data. It certainly remains possible that a very small-scale cooling flow contributes to the unresolved emission, and we now await data from the Chandra Observatory, whose arcsec resolution will significantly improve our knowledge of the inner regions of this source.
The minimum pressures of various regions in the inner radio jet of NGC 315 were estimated from a 1.4 GHz WSRT map kindly provided by Alan Willis, and supplemented by the lower-resolution results of Mack et al. (1998) in the outer parts of the source. Figure 9 shows these minimum pressures superimposed on the pressure of the X-ray emitting atmosphere estimated from the best-fitting -model (Table 5) and extrapolated beyond the regions of clear X-ray detection. This figure suggests that if the radio jet lies close to the plane of the sky, then only the knot at about 5 arcmin from the core may lie significantly out of pressure balance: all the other parts of the jet and the outer radio source may lie near pressure equilibrium or be confined by the external medium. Given the wide range in pressures (a factor ), this suggests that the structure of NGC 315 may be strongly influenced by the X-ray emitting atmosphere over the entire region outside 20 arcsec from the nucleus. Within 20 arcsec of the nucleus the radio data available to us have insufficient resolution to allow a useful estimate of the minimum pressure: similarly, structures of smaller angular size in other parts of NGC 315 may be far from pressure balance.
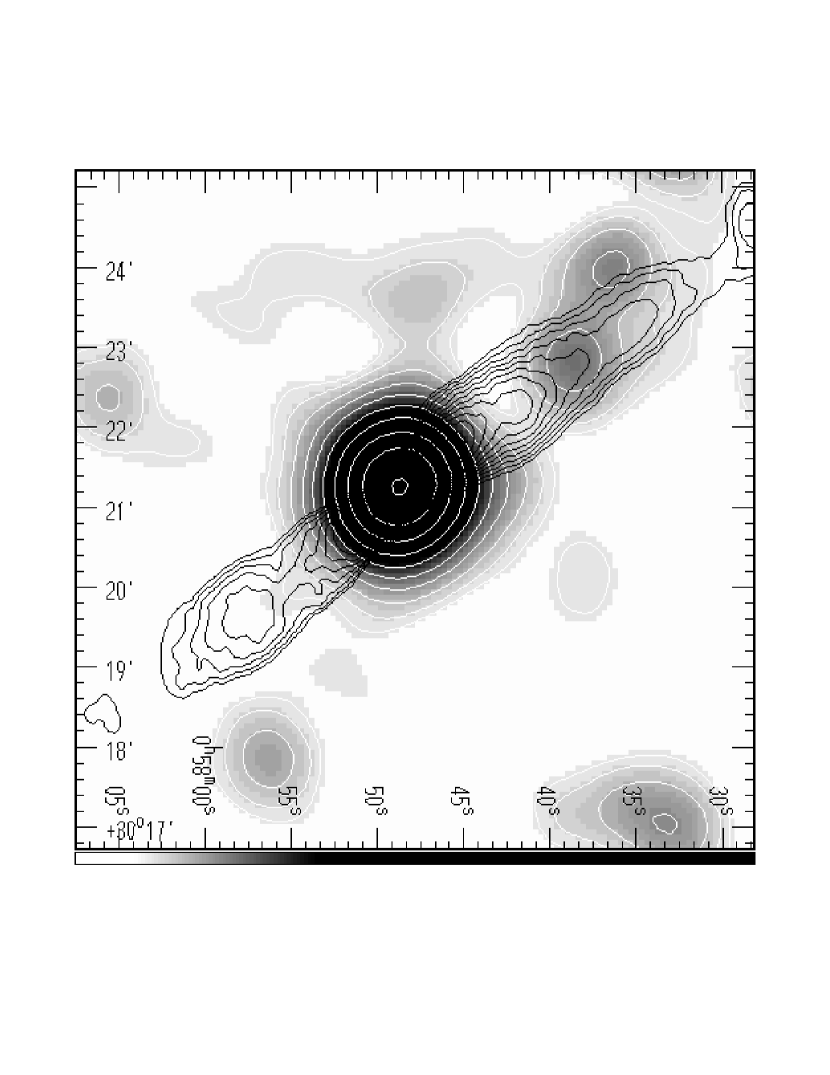
Figure 10 shows an overlay of the inner part of the radio source on the PSPC X-ray emission. There is a possible small-scale extension of the X-ray emission along both jets, but the two X-ray excesses to the northwest, one of which lies on the jet, are most likely associated with background sources for which optical candidates are visible on the Palomar Sky Survey images.
7 Conclusions
The analyses of these eight B2 radio galaxies lead to several conclusions which we may expect to be generic of low-power radio galaxies as a class:
-
1.
All eight X-ray sources exhibit multiple components.
-
2.
The extended atmospheres have a wide range of linear sizes, and follow the cluster X-ray luminosity/temperature correlation.
-
3.
No large-scale cooling flows are found, although a small-scale cooling flow may be present in NGC 315.
-
4.
There is no correlation of radio-source size with the scale or density of the X-ray atmosphere, suggesting that it is processes on scales less than those of the overall gaseous environments which are the major influence on radio-source dynamics.
-
5.
The outer parts of the radio sources are usually pressure-confined by the X-ray atmospheres, if they are close to minimum energy.
-
6.
For NGC 315, an extrapolation of the pressure of the atmosphere suggests that pressure balance may be maintained over a factor of in gas pressure and an overall size of Mpc, although the detected X-ray gas has a FWHM of only kpc. Deeper X-ray images are needed to test this possibility.
Appendix A Notes on individual Sources
NGC 315. This source is discussed in detail in section 6.
NGC 326. Further results based on the ROSAT PSPC observation appear in Worrall et al. (1995), including an interpretation of the strongly distorted radio structure as due to a buoyant backflow of radio plasma in the X-ray emitting medium. Werner, Worrall & Birkinshaw (1999)’s spectroscopy of cluster galaxies gives a velocity dispersion which is consistent with expectations from the X-ray derived cluster properties. The minimum radio pressures presented in Figure 9 were estimated from the low-resolution 1.4 GHz radio map and higher-resolution 4.9-GHz maps described by Worrall et al. (1995). The inner radio jets appear to be close to pressure balance with the X-ray gas, while the outer parts of the source appear underpressured, in accordance with the usual pattern (§5).
4C 35.03. The ROSAT HRI data are consistent with an unresolved source of luminosity ergs s-1 (Canosa et al. 1999), which is about 25% that of the thermal gas (Table 4) and in good agreement with the fraction of unresolved emission in the PSPC radial profile (Table 3). The radial profile is relatively insensitive to the value of , but prefers a flatter distribution than which was assumed by Worrall & Birkinshaw (1994). The unresolved X-ray emission appears not to be a smooth continuation of the extended gas: it may predominantly be either a galaxy-scale atmosphere (Trussoni et al. 1997) in which case it would be cooling rapidly, or a point-source component associated with the active nucleus. The latter interpretation is favored here. Our approved Chandra observation should settle this matter. The radio appearance of the source has been described by Fanti et al. (1986): it exhibits small ( arcsec) jets to either side of the core, embedded in a roughly elliptical halo of lower-brightness emission. The minimum radio pressures in the jets and the halo, as calculated by Parma et al. (1986), are a factor of four or more below the pressure of the X-ray emitting atmosphere, indicating that the source is likely to be well-confined by the external gas. This may account for the sharp edges of the radio image, and suggests that even the inner radio jets’ dynamics are strongly affected by the gas environment.
0326+39. In Canosa et al. (1999) our spatial decomposition of the PSPC data uses a smaller on-source region to probe the unresolved X-ray component. There are no ROSAT HRI observations of this source. The source was mapped in detail at radio frequencies by Bridle et al. (1991), and the minimum pressures in the jets shown in Figure 9 are taken from Figure 14 in that paper (adjusted to our choice of ). It can be seen that the jets are overpressured relative to the X-ray gas within about 20 arcsec of the core, and underpressured thereafter. This angle from the core marks an abrupt transition in the radio image, where the jets decrease suddenly in brightness. It can be seen that this does not correspond to any particular feature in the best-fitting (and flat) -model atmosphere, but higher resolution and more sensitive X-ray observations are required.
NGC 2484. The ROSAT HRI data are consistent with an unresolved source of luminosity ergs s-1 (Canosa et al. 1999). The best-fit luminosity in unresolved emission from the PSPC is ergs s-1, in excellent agreement. Our forthcoming Chandra observation should discriminate between an AGN and compact-gas origin for the unresolved emission. The PSPC radial profile is relatively insensitive to the value of for the extended emission, but prefers a steeper distribution than which was assumed by Worrall & Birkinshaw (1994). The radio structure is shown in de Ruiter et al. (1986) to be that of a weak, one-sided, jet within a diffuse, low surface-brightness, envelope. The minimum pressure in different parts of the radio source is compared with the gas pressure based on the X-ray model in Figure 9.
1040+31. In Canosa et al. (1999) our spatial decomposition of the PSPC data uses a smaller on-source region to probe the unresolved X-ray component. There are no ROSAT HRI observations of this source. Parma et al. (1986) give a map of this source that shows it to have a strong core, a small one-sided jet, fainter lobes, and several “warm spots”. The minimum pressure in the extended emission, estimated by Parma et al. based on their map is (scaled to our cosmology) about N m-2, or about double the central pressure in the X-ray emitting gas. The radio source has a total angular size of about 40 arcsec, roughly equal to the core radius of the X-ray emission.
1855+37. In Canosa et al. (1999) our spatial decomposition of the PSPC data uses a smaller on-source region to probe the unresolved X-ray component, a particularly small fraction of the overall emission. There are no ROSAT HRI observations of this source. The radio structure has been described by Parma et al. (1986). It appears as a small (10 arcsec) double source, with a weak additional component to the south. The minimum pressure in the source is approximately N m-2, comparable with the central pressure implied by the X-ray model, but no information is available on structures less than about 4 kpc in size, which may have higher pressures. Thus it appears that, like 4C 35.03, the extended structure of this source is limited by external gas pressure, but any jets which may be present on smaller scales are likely to be overpressured.
3C 449. The spatial decomposition of the ROSAT HRI data (Canosa et al. 1999) finds less extended emission than that that reported here from the PSPC (understandable due to the lower sensitivity of the HRI), while the unresolved emission of ergs s-1 is in excellent agreement (see Tables 3 & 4). The pressure balance between radio structures and ROSAT PSPC-measured X-ray emitting gas is discussed by Hardcastle et al. (1998), who in particular point out the implications of an apparently underpressured southern radio lobe displacing X-ray emitting plasma. The minimum pressures in the radio jets and lobes of 3C 449 were calculated and compared with the pressure of the X-ray emitting atmosphere by Hardcastle et al. (1998). The conclusion of that paper still stands: the entire source appears underpressured relative to the external medium. A jet angle relative to the line of sight is needed if projection effects are to redress this balance, but this seems unlikely.
References
- (1) Arnaud, M. & Evrard, A.E. 1999, MNRAS, 305, 631
- (2) Baars J.W.M., Genzel R., Pauliny-Toth I.I.K., Witzel A. 1977, A&A, 61, 99
- (3) Birkinshaw, M. & Worrall, D.M. 1993, ApJ, 412, 568
- (4) Böhringer, H., Voges, W., Fabian, A.C., Edge, A.C., Neumannn, D.M. 1993, MNRAS, 264, L25
- (5) Bridle, A.H., Davis, M.M., Fomalont, E.B., Willis, A.G. & Strom, R.G. 1979, ApJ, 228, L9
- (6) Bridle, A.H., Baum, S.A., Fomalont, E.B., Fanti, R., Parma, P. & Ekers, R.D. 1991, A&A, 245, 371
- (7) Briel, U.G. et al. 1996, Rosat Users’ Handbook, available from http://heasarc.gsfc.nasa.gov/docs/rosat/ruh/handbook
- (8) Canosa, C.M., Worrall, D.M., Hardcastle, M.J. & Birkinshaw 1999, MNRAS, in press
- (9) Colla, G., Fanti, C., Fanti, R., Gioia, I., Lari, C., Lequeux, J., Lucas, R., & Ulrich, M.-H. 1975, A&A, 38, 209
- (10) de Ruiter, H.R., Parma, P., Fanti, C. & Fanti, R. 1986, A&AS, 65, 111
- (11) Ekers, R.D., Fanti, R., Lari, C. & Parma, P. 1981, A&A, 101, 194
- (12) Fabbiano, G., Kim, D.-W. & Trinchieri, G. 1992, ApJS, 80, 513
- (13) Fanti, C., Fanti, R., de Ruiter, H.R. & Parma, P. 1986, A&AS, 65, 145
- (14) Fanti, C., Fanti, R., de Ruiter, H.R. & Parma, P. 1987, A&AS, 69, 57
- (15) Feretti, L., Fanti, R., Parma, P., Massaglia, S., Trussoni, E. & Brinkmann, W. 1995, A&A, 298, 699
- (16) Hardcastle, M.J. & Worrall, D.M. 1999, MNRAS, in press
- (17) Hardcastle, M.J., Worrall, D.M. & Birkinshaw, M. 1998, MNRAS, 296, 1098
- (18) Hardcastle, M.J., Worrall, D.M. & Birkinshaw, M. 1999, MNRAS, 305, 246
- (19) Harris, D.E. 1999, BAAS, 31, 729
- (20) Killeen, N.E.B. Bicknell, G.V. & Ekers, R.D. 1988, ApJ, 325, 180
- (21) Kim, D.-W. & Fabbiano, G. 1995, ApJ, 441, 182
- (22) Komossa, S. & Böhringer, H. 1999, A&A, 344, 755
- (23) Mack, K.-H., Klein, U., O’Dea, C.P., Willis, A.G. & Saripalli, L. 1998, A&A, 329, 431
- (24) Massaglia, S., Trussoni, E., Caucino, S., Fanti, R., Feretti, L., Parma, P. & Brinkmann, W. 1996, A&A, 309, 75
- (25) Miley, G.K., Norman, C., Silk, J. & Fabbiano, G. 1983, A&A, 122, 330
- (26) Morganti, R., Fanti, R., Gioia, I.M., Harris, D.E., Parma, P. & de Ruiter, H. 1988, A&A, 189, 11
- (27) Parma, P., de Ruiter, H.R., Fanti, C. & Fanti, R. 1986, A&AS, 64, 135
- (28) Parma, P., Murgia, M., Morganti, R., Capetti, A., de Ruiter, H.R. & Fanti, R. 1999, A&A, 344, 7.
- (29) Sarazin, C.L. 1986, Rev.Mod.Phys., 58, 1
- (30) Snowden, S.L. 1995, EXAS available from ftp://legacy.gsfc.nasa.gov/rosat/software/fortran/sxrb.
- (31) Stark, A.A., Gammie, C.F., Wilson, R.W., Bally, J., Linke, R.A., Heiles, C. & Hurwitz, M. 1992, ApJS, 79, 77
- (32) Trussoni, E., Massaglia, S., Ferrari, R., Fanti, R., Feretti, L., Parma, P. & Brinkmann, W. 1997, A&A, 327, 27.
- (33) Ulrich, M.-H. 1989, in BL Lac Objects, eds. L. Maraschi, T. Maccacaro & M.-H. Ulrich (Berlin: Springer-Verlag), 45
- (34) Werner, P.N., Worrall, D.M. & Birkinshaw, M. 1999, MNRAS, 307, 722
- (35) Worrall, D.M. & Birkinshaw, M. 1994, ApJ, 427, 134
- (36) Worrall, D.M., Birkinshaw, M. & Cameron 1995, ApJ, 449, 93
- (37)
- (38)


| B2 name | Other name | ( cm-2)a | kpc/arcminb | LAS (arcsec)c | ref | |
|---|---|---|---|---|---|---|
| 0055+30 | NGC 315 | 0.0165 | 5.77 | 28 | 3650 | 1 |
| 0055+26 | NGC 326 | 0.0472 | 5.47 | 77 | 150 | 2 |
| 0206+35 | 4C 35.03 | 0.0375 | 5.90 | 62 | 89 | 3 |
| 0326+39 | 0.0243 | 14.21 | 41 | 340 | 2 | |
| 0755+37 | NGC 2484 | 0.0413 | 5.02 | 68 | 138 | 3 |
| 1040+31 | 0.036 | 1.82 | 60 | 54 | 3 | |
| 1855+37 | 0.055 | 8.01 | 89 | 10 | 3 | |
| 2229+39 | 3C 449 | 0.0171 | 11.05 | 29 | 840 | 2 |
| aafootnotetext: From Stark et al. (1992). bbfootnotetext: = 50 km s-1 Mpc-1, = 0. ccfootnotetext: Largest angular size of radio structure |
References. — (1) Bridle et al. 1979; (2) Ekers et al. 1981; (3) Fanti et al. 1987
| Source | Dates | RORa | Exp.(s)b | Radius (arcmin) | net countsc |
|---|---|---|---|---|---|
| NGC 315 | 1992 Jan 17–Feb 1 | 700424 | 10,343 | 3 | |
| ′′ | 1992 Jul 19–21 | ′′ | 17,869 | 3 | |
| ′′ | total | ′′ | 29,626 | 3 | |
| NGC 326 | 1992 Jul 24–29 | 700884 | 19,409 | 6 | |
| 4C 35.03 | 1992 Jul 24–27 | 700316 | 14,843 | 6 | |
| 0326+39 | 1993 Aug 15–25 | 701442 | 18,931 | 5 | |
| NGC 2484 | 1991 Oct 30–Nov 1 | 700315 | 15,172 | 3 | |
| 1040+31 | 1993 May 10–21 | 700883 | 21,952 | 6 | |
| 1855+37 | 1993 Sep 27-28 | 701445 | 8,771 | 8 | |
| 3C 449 | 1993 Jan 4–10 | 700886 | 9,151 | 10 | |
| aafootnotetext: Rosat Observation Request number. bbfootnotetext: Livetime used in analysis. May be shorter than in the distributed files due to additional screening for high background. ccfootnotetext: 0.2-1.9 keV in source-centered circle of radius given in column 5, after areas of any contaminating point sources removed from on-source and background regions. For NGC 326, counts at radii 3 arcmin are for position angles 125∘–290∘ only, i.e., region of least extent. |
| Source | FWHM (kpc) | dof | |||||
|---|---|---|---|---|---|---|---|
| NGC 315e | 0.9 | 35 | 14.3/13 | 3.6 | 0.08 | ||
| ′′ | 0.67 | 10 | 13.9/13 | 2.5 | 0.14 | ||
| ′′ | – | 0.67 | 6 | 14.6/14 | – | – | |
| NGC 326 | 0.9 | 267 | 9.4/7 | 24.8 | |||
| 4C 35.03 | 0.35 | 30 | 7.1/10 | 19.2 | 0.001 | ||
| 0326+39 | 0.35 | 60 | 11.8/17 | 43.3 | |||
| NGC 2484 | 0.9 | 140 | 12.4/12 | 8.7 | 0.01 | ||
| 1040+31 | 0.4 | 40 | 14.3/22 | 10.9 | 0.003 | ||
| 1855+37 | 0.4 | 70 | 19.3/20 | 22.1 | |||
| 3C 449 | 0.35 | 40 | 7.5/12 | 8.9 | 0.01 | ||
| aafootnotetext: Ratio of counts in nuclear unresolved component to the total. statistical uncertainties. bbfootnotetext: FWHM of -model component (). 90% uncertainties for one interesting parameter. ccfootnotetext: F statistic, which tests the improvement of adding the unresolved emission to a -model alone. ddfootnotetext: Random probability of exceeding F. eefootnotetext: Results for January, July, and combined data listed separately. fffootnotetext: Extended emission very asymmetric – results are for direction of least extent (see Worrall et al. [1995] for details). |
Note. — Best-fit values for . and are highly correlated and so uncertainties are not given but can be deduced from Figure 4.
| Thermal Model | Thermal + Power-Law Model | Total Thermal | |||||||
|---|---|---|---|---|---|---|---|---|---|
| 0.2-2.5 keV | |||||||||
| norma | norma | flux | |||||||
| (keV) | EM/ | /dof | (keV) | EM/ | /dof | ||||
| source | cm-5 | cm-5 | (cgs) | (ergs/s) | |||||
| NGC 315 | 49.9/30 | 20.2/28 | 3.0 | ||||||
| NGC 326 | 25.3/29 | – | – | – | – | 24 | |||
| 4C 35.03 | 27.2/30 | 26.2/28 | 5.1 | ||||||
| 0326+39 | 23.0/22 | 20.2/20 | 8.5 | ||||||
| NGC 2484 | 30.0/29 | 21.1/27 | 1.8 | ||||||
| 1040+31 | 29.6/30 | – | – | – | – | 10 | |||
| 1855+37 | 25.2/26 | – | – | – | – | 67 | |||
| 3C 449 | 21.7/30 | – | – | – | – | 34 | |||
| aafootnotetext: EM is volume-weighted emission measure () and is luminosity distance. bbfootnotetext: Best-fit fraction of 0.2 - 1.9 keV counts in the power law (error % confidence). | |||||||||
Note. — Fits assume Galactic and abundances of 0.3 solar. Errors in and EM/ correspond to (i.e. for 2 interesting parameters). For NGC 326, results exclude the central excess and are taken from Worrall et al. (1995). For sources where spatial fitting gives of the counts in a central component, we investigate how the thermal parameters are affected if a power-law component is included. Flux and luminosity are best overall estimates for the total thermal component. The error on the luminosity combines in quadrature the statistical error and that arising from the uncertainty in the fraction of unresolved emission, but does not take into account an uncertainty in the correction for flux beyond the on-source extraction region, made using the best-fit core radius and (or and corresponding best-fit core radius if ).
| Source | |||||||
|---|---|---|---|---|---|---|---|
| cts arcmin-2 ks-1 | kpc | (keV) | cm-3 | dynes cm-2 | years | ||
| NGC 315 | 17211 | 0.67 | 4.7 | ||||
| NGC 326 | 2.00.05 | 0.9 | 343 | ||||
| 4C 35.03 | 3.70.3 | 0.35 | 31 | ||||
| 0326+39 | 3.90.2 | 0.35 | 41 | ||||
| NGC 2484 | 1.50.2 | 0.9 | 159 | ||||
| 1040+31 | 7.00.3 | 0.4 | 40 | ||||
| 1855+37 | 17.50.4 | 0.4 | 104 | ||||
| 3C 449 | 10.00.3 | 0.35 | 19 |
Note. — Based on -model component only. The model normalization, , is converted to physical quantities by convolving a thermal spectrum (with temperature given in Column 5 and based on Table 4) with the instrument response. Density and pressure decrease with radius from the tabulated central values as , and cooling time is proportional to 1/density. Multiply pressure values by 0.1 to give in units of N m-2 (Pascals). The result for NGC 315 is the best based on both epochs of PSPC data.