The Sagittarius Dwarf Irregular Galaxy (SagDIG): distance and star formation history111Based on observations made with the 2.5 m Nordic Optical Telescope operated on the island of La Palma by NOT S.A. in the Spanish Observatorio del Roque de Los Muchachos of the Instituto de Astrofísica de Canarias.
Abstract
The distance, star formation history and global properties of the Local Group dIrr galaxy SagDIG are derived based on an [] colour–magnitude diagram of stars. A distance of Mpc is obtained from the magnitude of the TRGB. This corresponds to 1.17 Mpc to the barycenter of the Local Group and 1.34 to M 31, being DDO 210, at 0.35 Mpc, the nearest galaxy to SagDIG. The metallicity is estimated from the colour of the RGB to be [Fe/H] . SagDIG is hence a probable member of the Local Group and a candidate for the lowest-metallicity star forming galaxy known.
The radial density profile of the galaxy has been obtained together with other integrated properties (magnitude, colour and central surface density). The galaxy density profile is fitted by an exponential law of scale length , corresponding to 140 pc.
The star formation history of SagDIG has been analysed, based on synthetic colour–magnitude diagrams. The galaxy is currently in a high star formation activity epoch, forming stars at a rate about 10 times greater than the average for its entire life. This is a common feature of galaxies classified as dIrrs.
Key Words.:
galaxies: dwarf — galaxies: individual (SagDIG) — galaxies: star formation history — galaxies: structure — Local Group1 Introduction
The Sagittarius dwarf irregular galaxy (SagDIG) is a blue, low surface brightness galaxy which was found on the ESO and SERC survey plates by Cesarsky et al. (1977) and Longmore et al. (1978). Both teams detected the galaxy in the 21-cm line with a negative radial velocity which indicates its probable membership in the Local Group. Its brightest blue stars are asymmetrically distributed, being concentrated on the eastern side of the galaxy. Based on their apparent magnitude, , Cesarsky et al. (1977) estimated the galaxy distance modulus to be . Skillman, Terlevich, & Melnick (1989) estimated the metallicty of its ionized gas to be 3% of the solar value and Strobel, Hodge, & Kennicutt (1991) give an map of the galaxy. Later on, Lo, Sargent & Young (1993) and Young & Lo (1997) undertook detailed investigations of SagDIG in the H i line with the VLA and showed that its velocity field is dominated by chaotic motions rather than by rotation ( km/s). For the H i mass and the total (virial) mass of SagDIG Lo et al. (1993) derived and respectively.
Surprisingly, SagDIG remains the least optically studied dIrr galaxy among the Local Group members (see, for example, bibliography in Gallart et al. 1996a and Mateo 1998). Even the existing estimates of its integrated magnitude are spread over a range of 15.5 – 13.8. The scarcity of studies devoted to SagDIG encouraged us to undertake the detailed CCD imaging of the galaxy that we present here. The paper is organized as follows. Section 2 gives a short description of the observations. In Sec. 3 the colour–magnitude diagram (CMD) is described and the distance and metallicity of the galaxy are derived from the tip of the red giant branch (TRGB) and the colour of the red giant branch (RGB), respectively. In Sec. 4 the radial distribution of stars is studied and the integrated magnitude obtained. The star formation history is derived in Sec. 5. Section 6 presents a summary of the global properties of SagDIG. Finally, the conclusions of the paper are summarized in Sec. 7.
2 Observations and data reduction
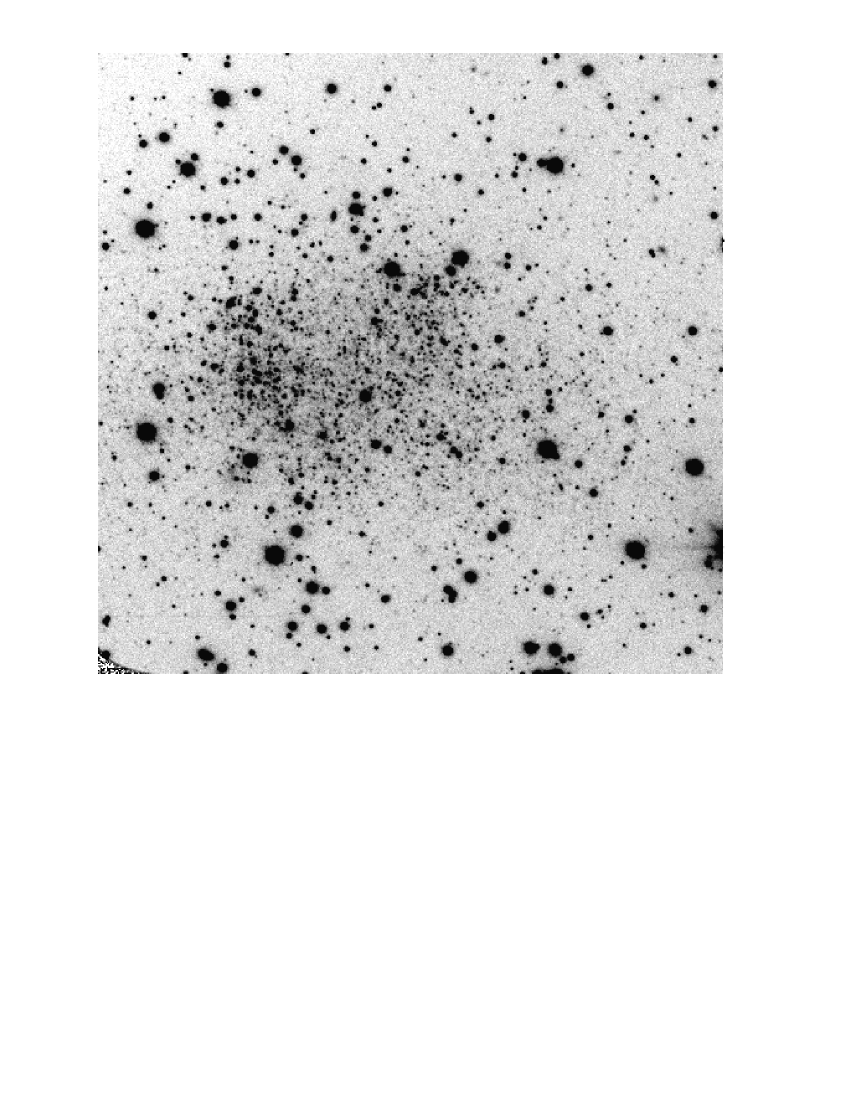
SagDIG was observed on 1997 July 28 with the HiRAC CCD camera of the 2.56 m NOT at Roque de los Muchachos Observatory in La Palma island (Canary Islands, Spain). The seeing was . A 20482048 CCD detector was used binned to and provided a total field of 3.7 with a resolution of /pixel after rebinning. Two frames were obtained in both the and bands with total exposures 2000 s in and 1800 s in . In order to estimate foreground galactic star number counts another field (8′ to the east) was imaged with exposures of 1200 s () and 1000 s (). Standard stars from Landolt (1992) were used for calibration. Details of the calibration can be found in Aparicio, Tikhonov & Karachentsev (1999). A band frame of SagDIG is shown in Figure 1.
The derived images were processed with MIDAS implementation of the DAOPHOT II program (Stetson 1987; Stetson, Davis & Crabtree 1990). A total of about 1550 stars were measured in the SagDIG frames down to a limiting magnitude . Figure 2 plots the PSF fitting errors as provided by ALLSTAR for and magnitudes.
Completeness has been analyzed using the usual procedure of artifitial star trials (Stetson 1987). A total of 2000 artifitial stars were added to the and frames of SagDIG in several steps of 100 stars each with magnitudes and colors in range and . Stars were considered as recovered if they were found both in and with magnitudes not exceding 0.75 mag brighter than the initial, injected ones. The completeness curves for blue and red stars are shown in Figure 3.
Besides stellar photometry we also carried out aperture photometry of the galaxy in circular diaphragms that allows the total integrated magnitude and colour to be measured.
3 Distance and metallicity from the colour–magnitude diagram
The vs. CMD of the resolved stars in the SagDIG frame is shown in Figure 4. SagDIG lying close to the direction of the Galactic center, has a CMD heavily contaminated by foreground stars. Figure 5 shows the CMD of the aforementioned nearby field. In both figures, only stars with and parameters in the intervals and in both filters have been plotted, being 1513 in Fig. 4 and 648 in Fig. 5. Comparison of both CMDs shows that for , the former is almost free from foreground stars, while most of the stars redder than that value and brighter than must be Galactic members. Two features can be recognized to originate in SagDIG: the blue sequence with , extending up to and the sequence of red stars at to 1.4, extending up to . The former is identified as being produced by young main sequence and He-burning blue-loop stars while the latter can be recognized to be the red giant branch (RGB), and should also contain asymptotic giant branch (AGB) stars.
3.1 Distance
The distance to SagDIG can be obtained from the tip of the RGB (TRGB), which for metal poor systems like SagDIG (see below) can be assumed to be at (Da Costa & Armandroff 1990).
The magnitude of the TRGB has been obtained applying a Sobel filter (kernel [–1,0,+1]; see Myler, & Weekes 1993) to the luminosity function of stars with . To minimize the effects of foreground contamination, only the stars at less than 1′ from the center of SagDIG have been used (see below for the dimensions of the galaxy). The resulting luminosity function and Sobel filtered luminosity function are shown in Figure 6. The TRGB corresponds to the peak at (bottom panel), the one at at being produced by a density fluctuation inside the RGB. The error can be estimated as 1/2 of the peak width at 62% of its maximum and turns out to be .
We have adopted a Galactic reddening for SagDIG of or from the IRAS/DIRBE map (Schlegel, Finkbeiner & Davis 1998). The above values yield a distance modulus of or Mpc, where the standard error includes uncertainties in the exact location of the TRGB, extinction, and photometric calibration. SagDIG is at Mpc from the barycenter of the Local Group and at 1.34 from M31. The closest galaxies to SagDIG are DDO 210, at 0.35 Mpc and NGC 6822, at 0.56 Mpc. Hence SagDIG seems to be a rather isolated galaxy in the periphery of the Local Group.
The average magnitude of the three brightest stars in a galaxy is a simple, frequently used method to estimate the distance. However, for low surface brightness galaxies without very young stars this method usually leads essentially to overestimating the distance. For ilustrative purposes, we have obtained the distance to SagDIG by this method also. The mean apparent magnitude of the three brightest blue stars can be estimated from our photometry using the relation obtained from blue [] standard stars of Landolt (1992). Applying this to the stars with in Fig. 4 the mean apparent magnitude of the three brightest ones is , or if the brightest blue star [, ] is assumed to be a foreground contaminator and neglected. Moreover, the integrated magnitude of the galaxy can be estimated using the values and derived in Sec. 4 and the relation by Makarova, & Karachentsev (1998). It results . Using the standard relation from (Karachentsev & Tikhonov 1994) with it is obtained (26.36) if the brightest star is (is not) considered, which is about 1 mag more than the distance modulus via TRGB or more than 50% larger in the distance. It must be noted that Cesarsky et al. (1977) obtained , which would result in and that these authors claimed a distance modulus of , close to the TRGB estimate. However Cesarsky et al. estimate was based on rough eye photometry on photographic plates and could well be affected of severe blending.
3.2 Metallicity
The metallicity of SagDIG was measured by Skillman, Terlevich, & Melnick (1989) from a low surface brightness HII region in the galaxy. They obtained . Alternatively, we have estimated the mean metallicity of the stars in SagDIG from the mean colour of the RGB at , i.e. 0.5 mag fainter than the TRGB. At this level we have a mean assuming a reddening of . Lee et al. (1993) provided a calibration for the metallicity of the RGB based on the colours at for Galactic globular clusters (Da Costa, & Armandroff, 1990): [Fe/H] . Using this calibration we obtain a value for the mean metallicity of [Fe/H] . This value is quite smaller than the Skillman et al.’s one. However, it must be noted that it corresponds to intermediate and old stars in the galaxy and, more important, that Lee et al.’s relation is used in extrapolation, since the least metallic globular cluster (M 15) used by Da Costa, & Armandroff (1990) has [Fe/H]. In any case, SagDIG lies at the extreme metal-poor end of dwarf galaxies. Figure 7 shows the RGB fiducials of Da Costa, & Armandroff (1990) overplotted to the distance and reddening corrected CMD of SagDIG.
4 Radial density profile and integrated photometry
The radial density profile of SagDIG has been obtained by counting stars in circular concentric annuli from the apparent optical center of the galaxy. Figure 8 shows the results. It is apparent from this figure that the galaxy vanishes at , the background level corresponding to about 0.016 stars arcsec-2. From the nearby companion field that we have taken, a similar but slightly lower value of 0.013 stars arcsec-2 is obtained.
Subtracting the former value of the background to the density profile, an exponential law has been fitted to the region , which results in a scale length of or 140 pc.
Total integrated magnitudes and colours have also been obtained. To reduce the effects of foreground contamination, we have first remove all the stars with and . The sky level has been approximated by a 2-dimension polynomial, using regions with few stars near the edges of the images. Then, integrated photometry of SagDIG has been performed with increasing circular apertures. The galaxy magnitude in each band has then been measured as the asymptotic value of the derived growth curve. The colour has been determined as the difference of total magnitudes in each band. The results are and .
Figure 9 shows the CMDs for 2 circular regions centered in the galaxy center and radii 60′′ and 120′′, respectively. It visualizes the relative contribution of SagDIG and foreground stars for increasing radial distances.
5 The star formation history of SagDIG
The heavy foreground contamination of SagDIG makes the analysis of the SFH difficult. It is based on the distribution of stars in the CMD and uses star counts in low populated areas of the CMD also (see Gallart et al. 1999). Fortunately enough, the bluest part of the SagDIG CMD, populated by youngest stars, is free from contamination and can provide information about the very recent SFH. Besides this, the RGB area can be used, after appropriate correction of foreground contamination to estimate the averaged SFR for ages older than Gyr (Aparicio, Bertelli & Chiosi 1999).
To start with, a qualitative idea of the stellar ages can be obtained from a glance at Figure 10, which shows the CMD of SagDIG corrected from the reddening and distance given in Section 3. Five isochrones from the Padua library (see Bertelli et al. 1994 for the key reference) have been over-plotted with metallicity and ages 20, 50, 200 Myr and 1 and 10 Gyr. The RGB and AGB are shown for the latter. Only the stars within a radius of from the center of the galaxy have been plotted, which approximately corresponds to the maximum extension of the galaxy (see Sec. 4). It is worth noting that at least some of the stars in the strip extending from to are probably extended intermediate-mass AGBs belonging to SagDIG (see below). Note also the separation between the MS and the blue-loop sequence, and that the brightest blue stars are blue-loopers.
A simplified version of the method proposed by Aparicio, Gallart & Bertelli (1997b) has been employed to obtain the SFH of SagDIG. In practice, a synthetic CMD with arbitrary, constant SFR of value , the IMF of Kroupa, Tout & Gilmore (1993) with lower and upper cut-offs 0.1 M⊙ and 30 M⊙, respectively, and a metallicity, , taking random values from to , independently of age have been used. To avoid small number statistics effects, the synthetic CMD have been computed with 50000 stars with . This guarantees that the relevant regions of the CMD (see below) are well populated and that the synthetic CMD does not introduce further statistical errors to the SFH result. In Sec. 3 the metallicity of SagDIG was estimated at [Fe/H] . This is an extremely low value, probably corresponding to . However, the Padua library is not complete for such low metallicities. For this reason the former metallicity range has been used as representative of a very low metallicity galaxy. Finally, since our results for the SFR can only be an estimate, we have neglected the effects of binary stars.
The resulting synthetic CMD has then been divided into three age intervals: Gyr, Gyr and Gyr. Following the nomenclature introduced in Aparicio et al. (1997b), each of the synthetic diagrams corresponding to the three previously defined age intervals will be called partial model CMDs and any linear combination of them will be denoted as global model. Three regions have been defined in the observed and partial model CMDs as shown in Fig. 10, with the criterion that they sample different age intervals and stellar evolutionary phases, namely the youngest blue-loops [; ], the MS plus young blue-loops [; ], and the RGB+AGB region below intervals: the TRGB [; ]. In practice, the two youngest time intervals are sampled by blue stars only, the oldest age included in box 2 of Fig. 10 being in fact about 0.2 Gyr. Although stars of any age above 0.2 Gyr populate box 3 (Fig. 10), this box is in practice dominated by low-mass stars, which are therefore older than about 1 Gyr, so that the sampling of stars in the age interval 0.2–1 Gyr remains poor. This interval should be solved using AGB stars brighter than the TRGB. But the low star counts usually found in the upper AGB together with the high foreground contamination prevent us from making any estimate based on that region. In summary, we will give the average SFR for the 0.2–15 Gyr interval, but the bad sampling of the 0.2–1 Gyr interval must be borne in mind.
We denote by the number of stars of the observed CMD lying in region and by the number of stars of partial model (age interval) populating region . After completeness and foreground correction, take the following values: , , and (inner ). The number of stars populating a given region in a global model is then given by
| (1) |
and the corresponding SFR
| (2) |
where are the linear combination coefficients; is a scaling constant which transforms from the arbitrary units used in the computation to final, physical units; if is inside the interval corresponding to partial model and otherwise. In the simple approach we are using, the coefficients can be analytically solved to produce . This results in the SFRs for the three considered intervals of time given in Table 1. The first three lines give the SFR for the time intervals Gyr; Gyr and Gyr. The three next lines give the same normalized to the area of SagDIG, considered to extend to the Holmberg radius. Quoted errors have ben calculated assuming Poisson statistics in the star counts.
Figure 11 shows the synthetic CMD corresponding to the former solution of the SFH. No simulation of observational effects has been done. As a result, the lowest part of the diagram is much more clearly defined than that of Fig. 4. Note in particular the separation between MS and blue-loop stars, which is only marginally visible in the observational CMD. Interestingly a large amount of bright AGB stars populate the synthetic CMD, indicating, as previously stated, that, at least, some of the stars in the strip extending from to of Fig. 4 are AGBs. Unfortunately, the strong foreground contamination prevents using these stars to improve the SFH result.
The current SFR of SagDIG can also be estimated from the flux given by Strobel et al. (1991). Using our estimate of the distance and following the procedure shown in Aparicio et al. (1999) with an upper mass for stars M⊙, the current SFR results M⊙yr-1; i.e., an order of magnitude smaller than the value obtained from the CMD and given in Table 1 for the last 50 Myr (). The disagreement can be solved if an upper cut-off for stellar masses of is imposed.
Summaryzing, SagDIG seems to be experiencing a strong burst of star formation which drives it to form stars at a rate 10 times larger than the average of its entire life. This picture is frequently found in galaxies classified as dIrr: (NGC 6822: Gallart et al. 1996b,c; Pegasus: Aparicio Gallart, & Bertelli 1997a, Gallagher et al. 1998; Sextans A: Dohm-Palmer et al. 1997, Van Dyk, Puche & Wong 1998; Antlia: Aparicio et al. 1997c; DDO 187: Aparicio et al. 1999). This might imply that an important bias could exist in the classification of dwarfs as bona-fide dIrrs towards objects experiencing strong star formation bursts.
6 Global integrated properties of SagDIG
A summary of the basic parameters of SagDIG is given in Table 2. Except where otherwise stated, the data listed are from this paper. The parameters listed in Table 2 are: (1,2) - equatorial coordinates of the galaxy center; (3) - the standard angular dimensions; (4) - the heliocentric radial velocity (data for the four first lines are from NED); (5) - the radial velocity with respect to the Local Group centroid (Karachentsev & Makarov 1996); (6,7) - interstellar reddening and extinction (Schlegel et al. 1998); (8,9) - integrated colour and apparent magnitude of the galaxy; (10) - the central surface brightness in ; (11,12) - the apparent reddening-corrected -magnitude of the TRGB, and the median reddening corrected colour of the RGB measured at ; (13) - the mean metallicity estimated from using the calibration by Lee et al. (1993); (14-17) - the distance modulus and linear distance from the Milky Way, from the Local Group centroid, and from M 31; (18,19) - the total absolute magnitude and the standard linear diameter of the galaxy; (20,21) - the hydrogen mass-to-luminosity ratio and the total (virial) mass-to-luminosity ratio, for which the total luminosity in obtained through and the hydrogen and total mass from Lo et al. (1993) have been used.
As the presented data show, SagDIG is one of the faintest, smallest irregular systems in the Local Group. According to its values of and , SagDIG seems to be an usual gas-rich dIrr. Its low central brightness and low luminosity follow the common relation between these parameters for dwarf galaxies (Caldwell et al. 1998). But the derived low mean metallicity of SagDIG displaces it from the main sequences [Fe/H] vs. and [Fe/H] vs. for dwarf galaxies (Lee 1995; Grebel & Guhathakurta 1999). The unusually low metallicity of SagDIG needs, of course, an independent confirmation. But if correct, studying the gas in SagDIG would become an interesting task because it could be the lowest metallicity dIrr known, with smaller than that of I Zw 18 even.
Being at more than 1 Mpc both from the Milky Way and from M31, SagDIG is apparently situated outside these two subsystems of the Local Group. Together with Sex A, Sex B, NGC 3109, Antlia and UGCA 438, it forms a scattered envelope of the Local Group populated by dIrr galaxies. In fact, SagDIG seems to be a rather isolated dwarf galaxy whose autonomous evolution proceeds without strong tidal influence from massive neighbours.
7 Conclusions
We have presented and CCD photometry of stars in the Local Group dIrr galaxy SagDIG. The colour–magnitude diagram shows a well defined red giant branch, and a sequence of blue stars. Based on the magnitude of the TRGB we have derived the distance modulus of SagDIG to be for an adopted extinction of . From the mean colour of the RGB , a mean metallicity [Fe/H] is obtained. With this low Fe abundance, SagDIG could be the lowest metallicity star forming dIrr known.
The absolute total magnitude, the total colour, and the central surface brightness of SagDIG are derived to be , and mag arcsec-2. The radial star density distribution is fitted by an exponential law of scale length , corresponding to 140 pc.
The star formation history of SagDIG has been estimated from the number of blue and red stars in the colour–magnitude diagram and using a synthetic CMD as reference. The star formation rate has been evaluated for the intervals of time 0.2–15 Gyr, 0.05–0.2 Gyr and 0–0.05 Gyr, for which has been obtained yr-1, yr-1, and yr-1, respectively (see a summary in Table 1). The current strong enhancement of the observed star formation rate is a common feature of galaxies classified as dIrrs.
Acknowledgements.
We thank N. A. Tikhonov for a fruitful collaboration. We thank the anonymous referee for his/her usefull comments, that help improving the paper. This work was partially supported by INTAS-RFBR grant 95-IN-RU-1390. AA is financially supported by the IAC (grant P3/94) and by the DGES of the Kingdom of Spain (grant PB97-1438-C02-01). NASA’s Extragalactic Database (NED) has been used in our work.References
- (1) Aparicio, A., Bertelli, G,. & Chiosi, C. 1999, in preparation
- (2) Aparicio, A., Dalcanton, J., Gallart, C., & Martínez-Delgado, D. 1997c, AJ, 114, 1447
- (3) Aparicio, A., Gallart, C., & Bertelli, G. 1997a, AJ, 114, 669
- (4) Aparicio, A., Gallart, C., & Bertelli, G. 1997b, AJ, 114, 680
- (5) Aparicio, A., Tikhonov, N., & Karachentsev, I. 1999, AJ, submitted
- (6) Bertelli, G., Bressan, A., Chiosi, C., Fagotto, & F., Nasi, E. 1994, A&AS, 106, 275
- (7) Caldwell, N., Armandroff, T. E., Da Costa, G. S., & Seitzer, P. 1998, AJ, 115, 535
- (8) Cesarsky, D. A., Laustsen S., Lequeux J., Schuster H.E., & West R.W. 1977, A&A, 61, L.31
- (9) Da Costa, G. S., & Armandroff, T. E. 1990, AJ, 100, 162
- (10) Dohm-Palmer, R. C., Skillman, E. D., Saha, A., Tolstoy, E., Mateo, M., Gallagher, J., Hoessel, J., Chiosi, C., & Dufour, R. J. 1997, AJ, 114, 2527
- (11) Gallart, C., Aparicio, A., & Vílchez J. M. 1996a, AJ, 112, 1928
- (12) Gallart, C., Aparicio, A., Bertelli, G., & Chiosi, C. 1996b, AJ, 112, 1956
- (13) Gallart, C., Aparicio, A., Bertelli, G., & Chiosi, C. 1996c, AJ, 112, 2596
- (14) Gallart, C., Freedman, W., Aparicio, A., Bertelli, G., & Chiosi, C. 1999, AJ, in press
- (15) Gallagher, J. S., Tolstoy, E., Dohm-Plamer, R. C., Skillman, E. D., Cole, A. A., Hoessel, J. G., Saha, A., & Mateo, M. 1998, AJ, 115, 1869
- (16) Grebel, E. K., & Guhathakurta, P. 1999, ApJ, 511, in press
- (17) Karachentsev, I. D., & Makarov, D. I. 1996, AJ, 111, 794
- (18) Karachentsev, I. D., & Tikhonov, N. A. 1994, A&A, 286, 718
- (19) Kroupa, P., Tout, C. A., & Gilmore, G. 1993, MNRAS, 262, 545
- (20) Landolt, A. U. 1992 AJ, 104, 340
- (21) Lee, M. G. 1995, AJ, 110, 1129
- (22) Lee, M. G., Freedman, W.L., Madore, B.F. 1993, AJ, 106, 964
- (23) Lo, K. Y., Sargent, W. L. W., & Young, K. 1993, AJ, 106, 507
- (24) Longmore, A. J., Hawarden T.G., & Webster B.L., Goss W.M., Mebold U. 1978, MNRAS, 183, 97P
- (25) Makarova, L. M., & Karachentsev, I. D. 1998, A&AS, 133, 181
- (26) Mateo, M. 1998, ARA&A, 36, 455
- (27) Myler, H. R., & Weekes, A. R. 1993, Computer IMaging Recipes in C (Prentice Hall, NJ)
- (28) Schlegel, D. J., Finkbeiner, D. P., & Davis, M. 1998, ApJ, 500, 525
- (29) Skillman, E. D., Terlevich, R., & Melnick, J. 1989, MNRAS, 240, 563
- (30) Stetson, P. B. 1987 PASP, 99, 191
- (31) Stetson, P. B., Davis, L. E., & Crabtree, D. R. 1990 in CCDs in Astronomy, PASP Conf. Ser., 8, 289
- (32) Strobel, N. V., Hodge, P., & Kennicutt, R. C. 1991, ApJ, 383, 148
- (33) Van Dyk, S. D., Puche, D., & Wong, T. 1998, AJ, 116, 2341
- (34) Young, L. M., & Lo, K. Y. 1997, ApJ, 490,710.
| SFR | |
|---|---|
| ( yr-1) | |
| ( yr-1) | |
| ( yr-1) | |
| ( yr-1 pc-2) | |
| ( yr-1 pc-2) | |
| ( yr-1 pc-2) |
| Parameter | SagDIG |
|---|---|
| (1) R.A.(1950) | |
| (2) Dec.(1950) | |
| (3) (′) | |
| (4) (km s-1) | |
| (5) (km s-1) | |
| (6) | 0.12 |
| (7) , | 0.38, 0.22 |
| (8) | 0.65 |
| (9) | 13.77 |
| (10) (mag | |
| (11) | |
| (12) | |
| (13) [Fe/H] | |
| (14) | |
| (15) (Mpc) | |
| (16) (Mpc) | 1.17 |
| (17) (Mpc) | 1.34 |
| (18) | |
| (19) (kpc) | 0.89 |
| (20) () | 1.3 |
| (21) () | 6.8 |