Si AND Mn ABUNDANCES IN DAMPED LYMAN SYSTEMS WITH LOW DUST CONTENT11affiliation: The data presented herein were obtained with the NASA/ESA Hubble Space Telescope and with the Keck I Telescope. The W.M. Keck Observatory is operated as a scientific partnership among the California Institute of Technology, the University of California, and the National Aeronautics and Space Administration. The Observatory was made possible by the generous financial support of the W.M. Keck Foundation.
Abstract
We have measured the abundances of Zn, Si, Mn, Cr, Fe, and Ni in three damped Lyman systems at redshifts from high resolution echelle spectra of QSOs recorded with the Keck I telescope. In all three cases the abundances of Cr, Fe, and Ni relative to Zn indicate low levels of dust depletions. We propose that when the proportion of refractory elements locked up in dust grains is less than about 50%, it is plausible to assume an approximately uniform level of depletion for all grain constituents and, by applying a small dust correction, recover the intrisic abundances of Si and Mn. We use this approach on a small sample of damped systems (6 – 8 cases) for which it is appropriate, with the aim of comparing the metallicity dependence of the ratios [Si/Fe] and [Mn/Fe] with analogous measurements in Milky Way stars. The main conclusion is that the relative abundances of both elements in distant galaxies are broadly in line with expectations based on Galactic data. Si displays a mild enhancement at low metallicities, as expected for an -capture element, but there are also examples of near-solar [Si/Fe] at [Fe/H] . The underabundance of Mn at low metallicities is possibly even more pronounced than that in metal-poor stars, and no absorption system has yet been found where [Mn/Fe] is solar. The heterogeneous chemical properties of damped Lyman systems, evident even from this limited set of measurements, provide further support for the conclusion from imaging studies that a varied population of galaxies gives rise to this class of QSO absorbers.
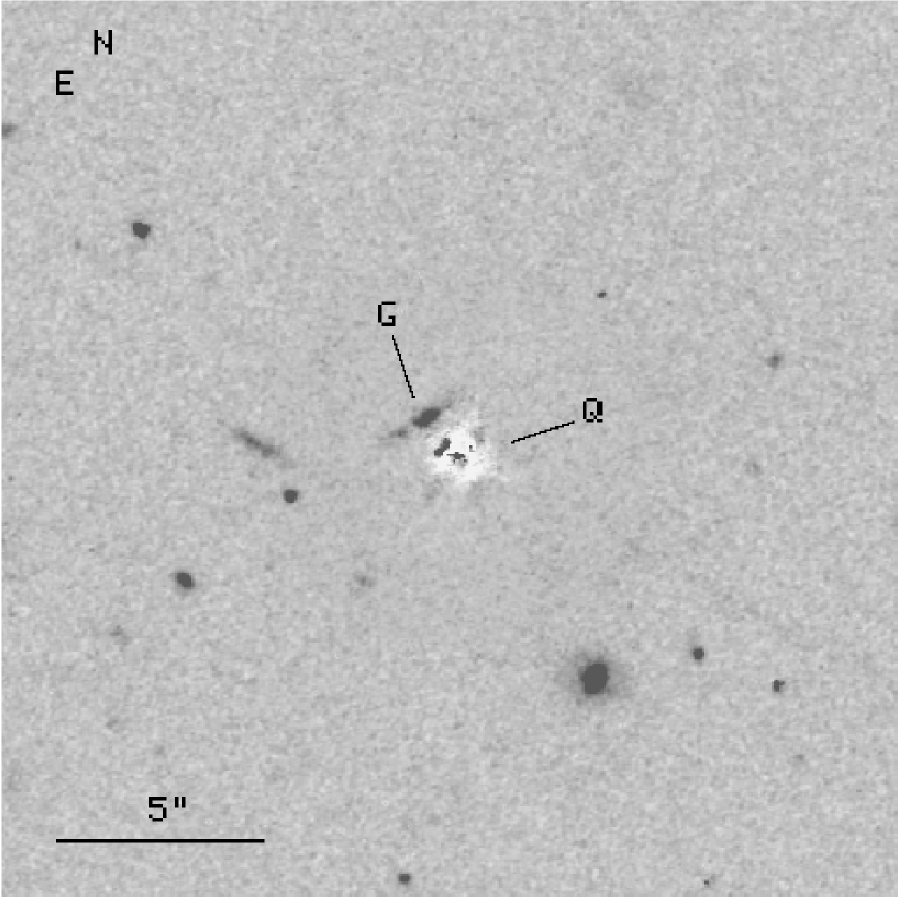
We also present a Hubble Space Telescope image of the field of one of the QSOs, Q0058+019, showing the presence of an edge-on late-type galaxy only 1.2 arcseconds from the absorption sight-line. If this is the galaxy producing the damped Lyman system at , it is of relatively low luminosity () and at an impact parameter of kpc.
1 INTRODUCTION
This is the fourth paper in a series dealing with metal abundances in damped Lyman systems (DLAs) at intermediate redshifts (). The number of such systems known has been increasing slowly over the past few years with the growing database of Hubble Space Telescope (HST) QSOs observed at wavelengths below 3000 Å which are inaccessible from the ground. In Pettini et al. (1999, Paper III) we combined measurements of the abundance of Zn in 10 DLAs at with earlier surveys at higher redshifts to determine the evolution of the metallicity of H I gas in the universe. We found that, somewhat surprisingly, the metal content of DLAs apparently does not increase with cosmic time, and that the column density-weighted mean value of the Zn abundance remains roughly constant at between and 0.4 .111In the usual notation, [Zn/H] = log (Zn/H) log (Zn/H)⊙. This result is apparently at odds with the common interpretation of DLAs as the high redshift progenitors of present day spiral galaxies; disk stars in the Milky Way, for example, had already reached [Fe/H] at (Edvardsson et al. 1993), a point first made by Meyer & York (1992). The persisting low metallicity of DLAs may be explained by abundance gradients (Prantzos & Silk 1998) but, more generally, is consistent with the finding from HST imaging that galaxies of different morphological types and with a range of surface brightnesses contribute to the absorption cross-section for H I (Le Brun et al. 1997). To some extent this may well be a consequence of the fact that DLAs selected with HST are likely to be preferentially dust- and therefore metal-poor, simply because the background QSOs would otherwise be too faint to be accessible with a 2.5 m telescope.
Whatever the connection between them and present-day galaxies, damped Lyman systems remain our best route to accurate determinations of element abundances at high redshifts. Element ratios in Galactic stars and nearby H II regions have long been scrutinized with a view to deciphering the clues they hold both to the origin of different stellar populations and to the stellar yields (see, for example, Wheeler, Sneden, & Truran 1989 for a review of the main ideas underlying this field of work). As pointed out by Pettini, Lipman, & Hunstead (1995), abundance measurements in DLAs are potentially an important extension of this technique (and one yet to be fully exploited), allowing access to elements which are not well observed in stars, to lower metallicities than those of present-day H II regions, and to a wider range of environments and physical conditions than local studies. A possible complication in interpreting interstellar abundances is accounting for the fractions of refractory elements which are missing from the gas-phase having been incorporated into dust grains; however, we are aided in this respect by the generally low dust depletions which seem to apply to many DLAs (Pettini et al. 1997a).
In this paper we analyse Keck I HIRES observations of several elements, ranging from Mg to Zn, in three DLAs at . One of these, at = 0.61251 in Q0058+019 (= PHL 938), has not been studied before while for the other two, at = 1.00945 in Q0302223 and = 0.85967 in Q0454+039, we previously published only intermediate resolution observations (Pettini & Bowen 1997, Paper II; Steidel et al. 1995, Paper I respectively). In addition, we present an HST WFPC2 image of the field of Q0058+019 where we resolve a galaxy which is a highly plausible candidate for the damped absorber, being very close to the QSO sight-line. We use the pattern of element abundances in these and other DLAs where corrections for dust depletion are estimated to be small to explore the metallicity dependence of the abundances of Si (an -element) and Mn.
2 HST OBSERVATIONS
2.1 FOS Spectroscopy
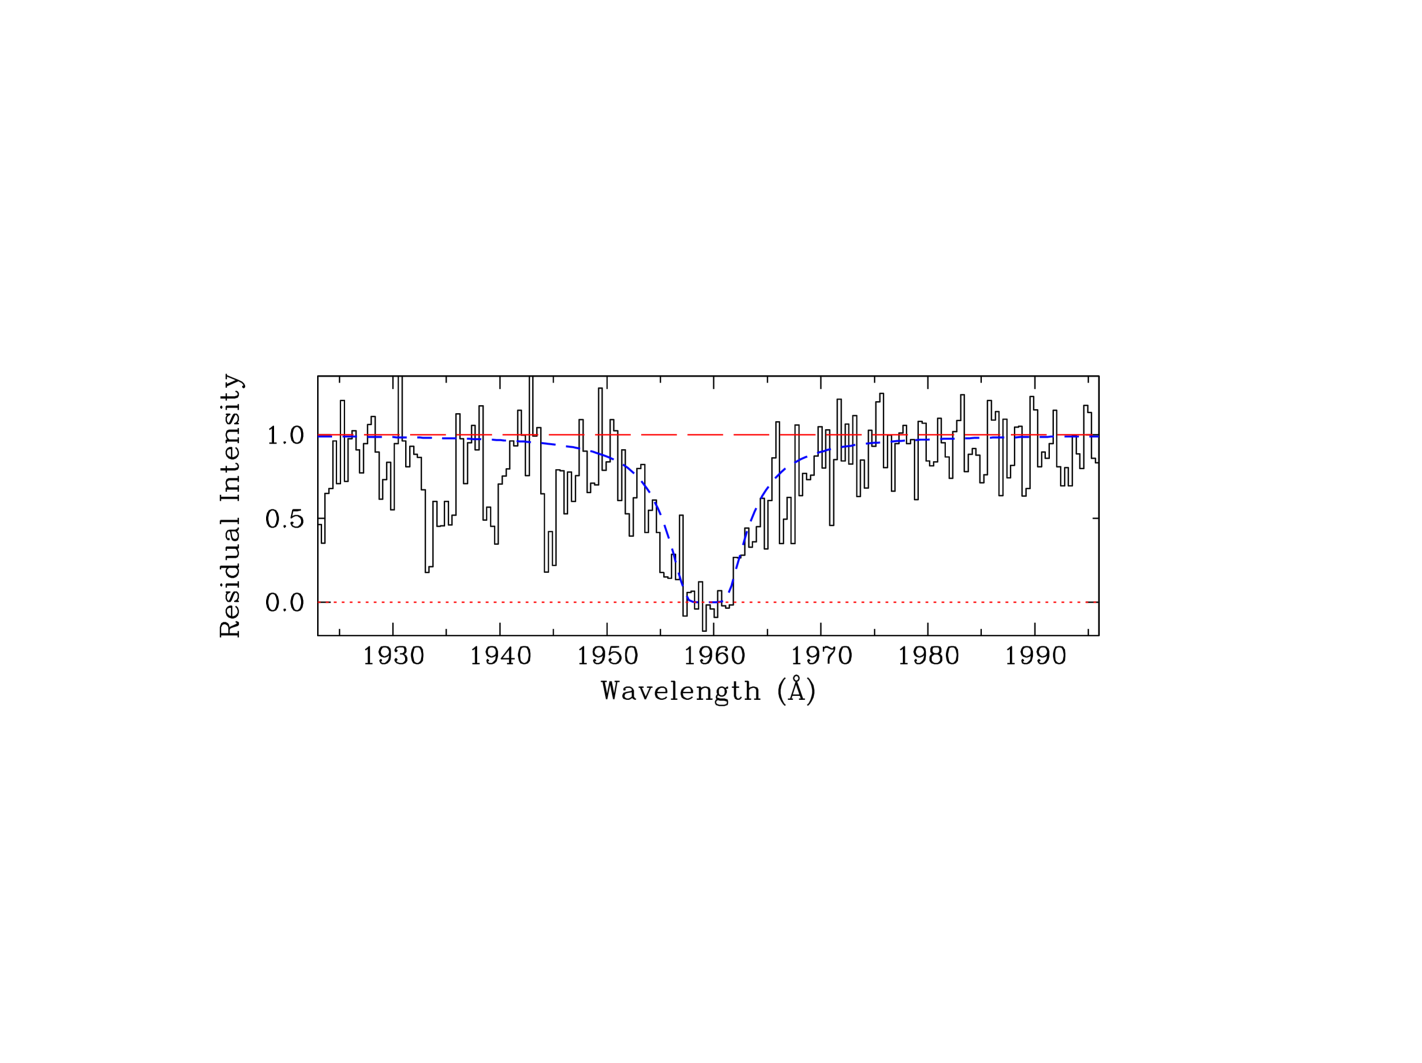
A trawl of the HST Faint Object Spectrograph (FOS) data archive revealed that Q0058+019 exhibits a damped Lyman line at Å, shown in Figure 1. In producing this spectrum we resampled the pipeline calibrated data to a linear dispersion of 0.51 Å per pixel (one quarter diode steps) and applied a correction of +8% of the continuum level to bring the core of the Lyman line to net zero flux. A fit to the absorption profile yielded a neutral hydrogen column density (H0) = () cm-2 at an absorption redshift = 0.6118. The column density error, which includes the effect of the correction applied to the zero level, is larger than is usually the case because the signal-to-noise ratio of the short FOS exposure is only . Even so, the value of (H0) is lower than the threshold (H0) cm-2 for DLAs originally adopted by Wolfe et al. (1986), reflecting the shift of the column density distribution toward lower values at , as first noted by Lanzetta, Wolfe, & Turnshek (1995). The difference between the redshift of the Lyman line and = 0.61251 measured from the metal absorption lines in the HIRES spectrum (§3) corresponds to approximately half a diode on the detector and is typical of the accuracy with which the zero point of the FOS wavelength scale can be determined (Rosa, Kerber, & Keyes 1998).
The FOS spectra of Q0302223 and Q0454+039 have been described in Papers II and I respectively; from a re-examination of the damped Lyman line profiles we deduce (H0) = () cm-2 and () cm-2 at = 1.00945 and = 0.85967 respectively, in good agreement with the values published in the earlier papers.
2.2 WFPC2 Imaging
The field of Q0058+019 was imaged with the Wide Field Planetary Camera (WFPC2) as part of a larger HST program to study the morphology and environments of galaxies producing Mg II absorption systems. A set of four exposures was taken through the F702W filter (with an effective wavelength of 6900 Å) in a two-point dither pattern; the total exposure time was 5000 s. The individual CCD frames were reduced using the pipeline calibration procedure and then coadded by “drizzling” onto a master output pixel grid using the DITHER and DITHERII IRAF packages (Fruchter & Hook 1999).
The next step involved subtracting the QSO image to reveal any galaxies at small separations. The HST Mg II absorber imaging program was purposefully designed to facilitate this subtraction process by constructing an empirical point spread function (PSF) using images of many QSOs. Since the PSF characteristics (FWHM, shape, bleeding) depend sensitively on the level of saturation, QSOs observed in the program were grouped by flux so that an appropriate PSF could be determined using only QSOs of similar flux to Q0058+019. Subtraction of this median PSF (with the DAOPHOT IRAF package) then yielded the final image reproduced in Figure 2.
A faint galaxy is clearly visible approximately 1.2 arcsec to the
north-east of the QSO.
Given its proximity to the QSO sight-line
this is the most likely candidate for the
damped Lyman absorber at = 0.61251.
Apparently the model PSF does not reproduce accurately one of the
diffraction spikes in the QSO image, leaving a residual flux deficit
which cuts through the galaxy. When this is taken into account,
the object morphology is suggestive of a late-type galaxy seen at a high
inclination angle, .
Table 1 lists relevant measurements, assuming
and adopting a km s-1 Mpc-1,
cosmology.
We converted the measured F702W magnitude
to an AB magnitude in the photometric system of
Steidel & Hamilton (1993) by reference
to ground-based images of the field (the [6930/1500] filter is
a very close match to the WFPC2 F702W filter), and obtained
. For the above cosmology this in turn corresponds to an
absolute magnitude in the rest-frame -band (in the conventional Vega-based
magnitude system) . No K-correction was applied because
at 6930 Å is close to the effective wavelength of the
-band.
Adopting (e.g. Folkes et al. 1999),
we conclude that the candidate damped Lyman absorber is a
galaxy of relatively low luminosity, with .
Other DLAs have been found to be associated with compact galaxies,
dwarfs, low surface brightness galaxies, and even an S0
(Le Brun et al. 1997; Lanzetta et al. 1997; Rao &
Turnshek 1998). We now add a low luminosity spiral to the list
and thereby reinforce the conclusion of these earlier studies
that damped Lyman systems are drawn from a diverse
population of galaxies with a wide range of morphologies and
luminosities.
3 KECK OBSERVATIONS
The spectra of the three QSOs were recorded at high spectral resolution with the HIRES echelle spectrograph (Vogt et al. 1994) on the Keck I telescope on Mauna Kea, Hawaii on 23 and 24 September 1998. Relevant details of the observations are collected in Table 2. We used the UV-blazed cross-disperser grating to record interstellar lines of interest in the three DLAs longward of the atmospheric cut-off near 3200 Å. Thus, in Q0058+019 we cover from Zn II to Mg I at = 0.61251, while the spectra of Q0302223 and Q0454+039 extend from Si II to Mn II at = 1.00945 and 0.85967 respectively (for Q0302223 this necessitated a second grating setting). Given the good seeing (0.5 to 0.7 arcsec), we used the 0.86 arcsec wide entrance slit which projects to 3 pixels on the 2048x2048 Tektronix CCD detector resulting in a resolution of 6.5 km s-1 FWHM.
The echelle spectra were extracted with Tom Barlow’s customised
software package, following the steps described in Paper III.
The signal-to-noise ratios of the reduced spectra were measured directly
from the rms fluctuations about the continuum level.
In general the value of S/N varies along each spectrum due to the
presence of broad emission lines at the QSO redshifts and increasing
atmospheric absorption below 3600 Å; the values (per pixel) listed in
column (10) of Table 2 refer to the region near rest frame wavelength
Å and should be representative of most of the
absorption lines recorded. As can be seen from column (11) our
Keck spectra are sensitive to rest frame equivalent
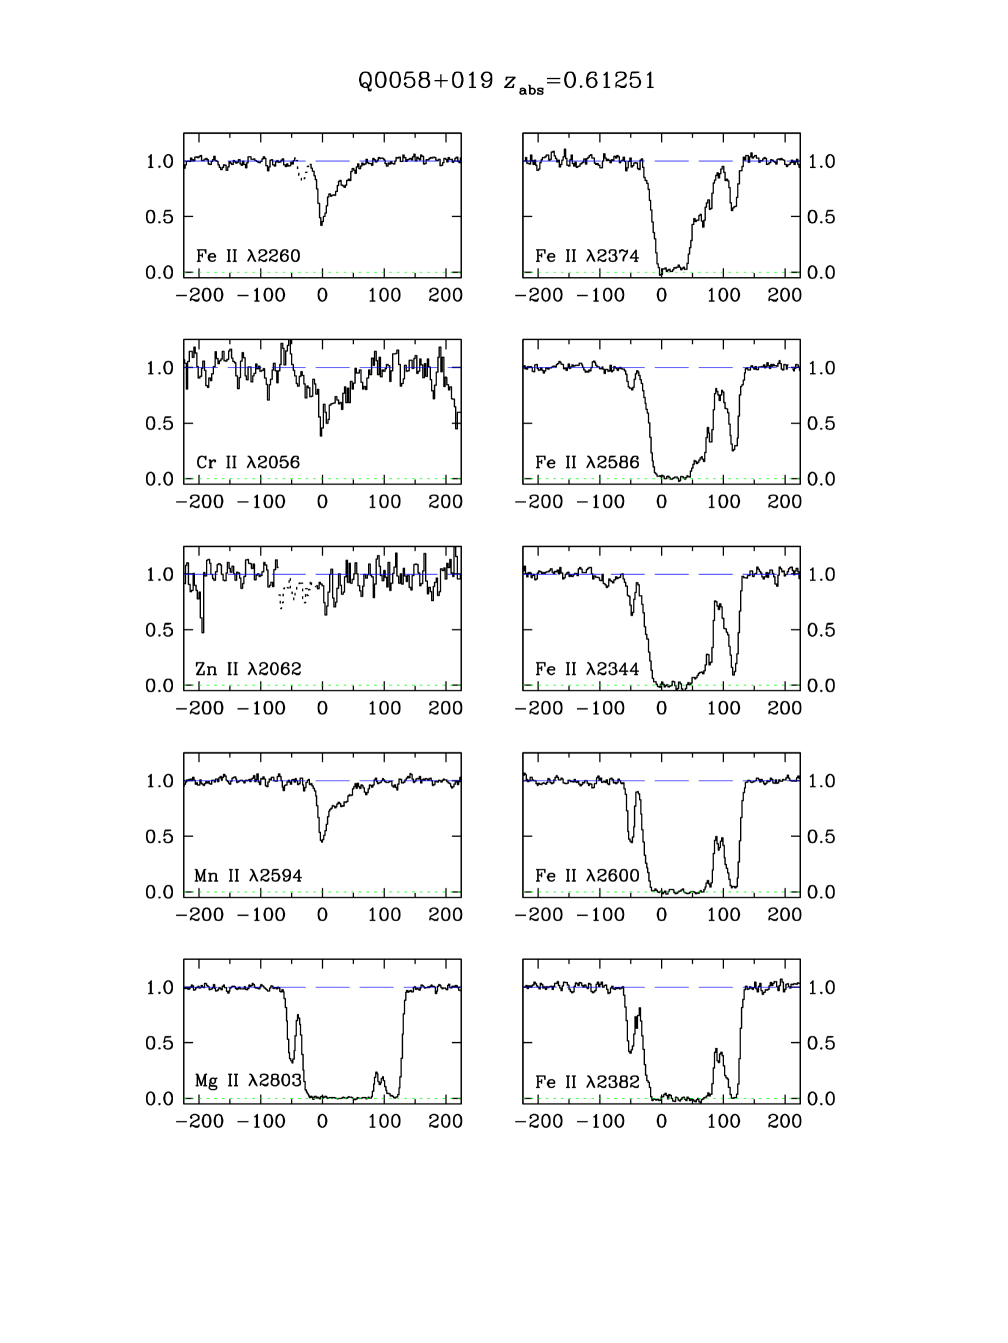
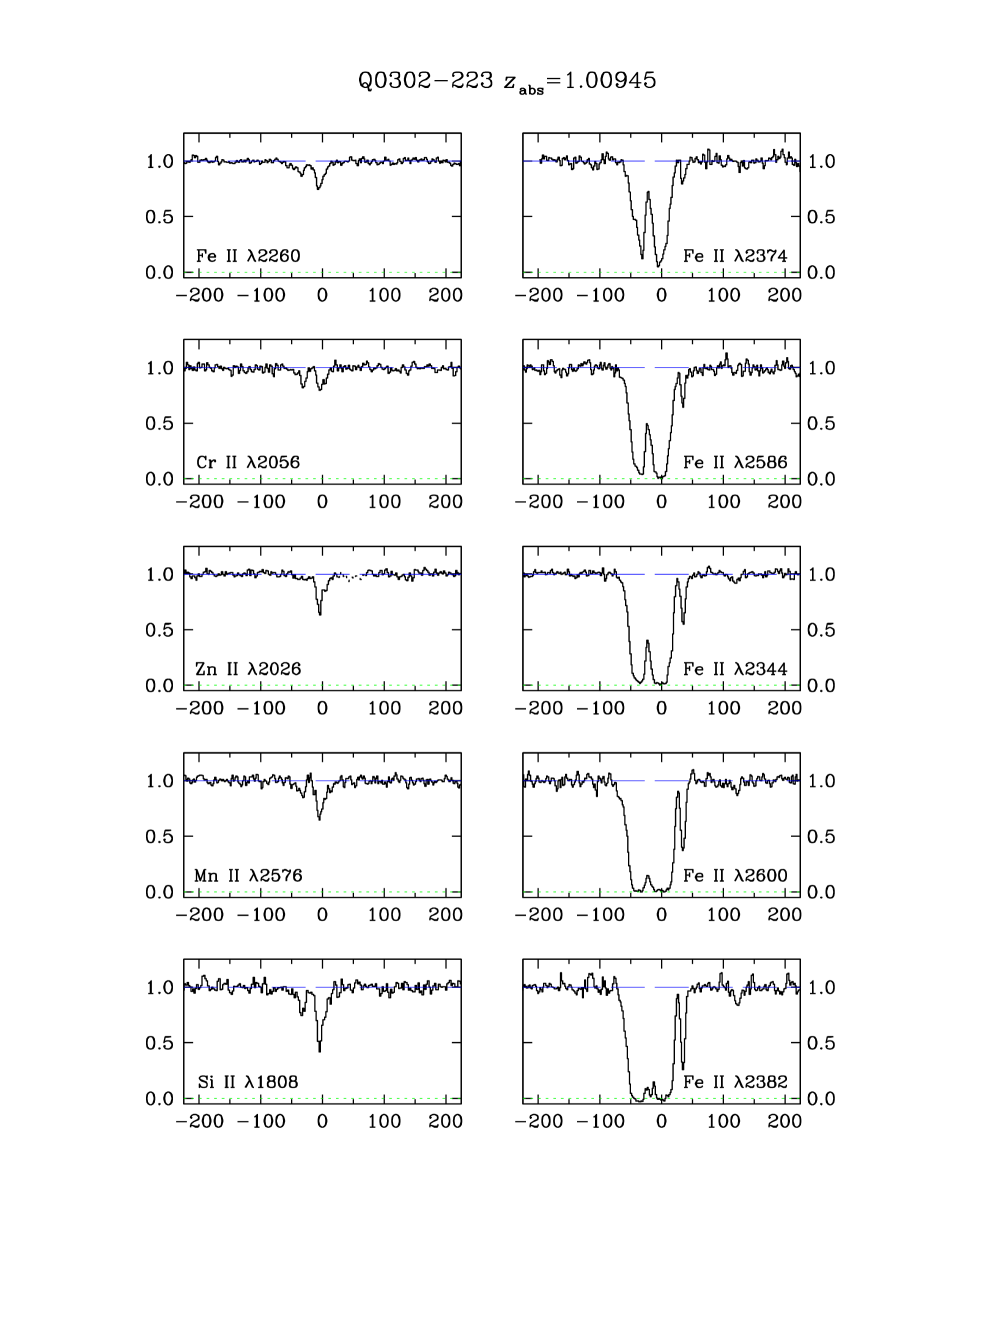
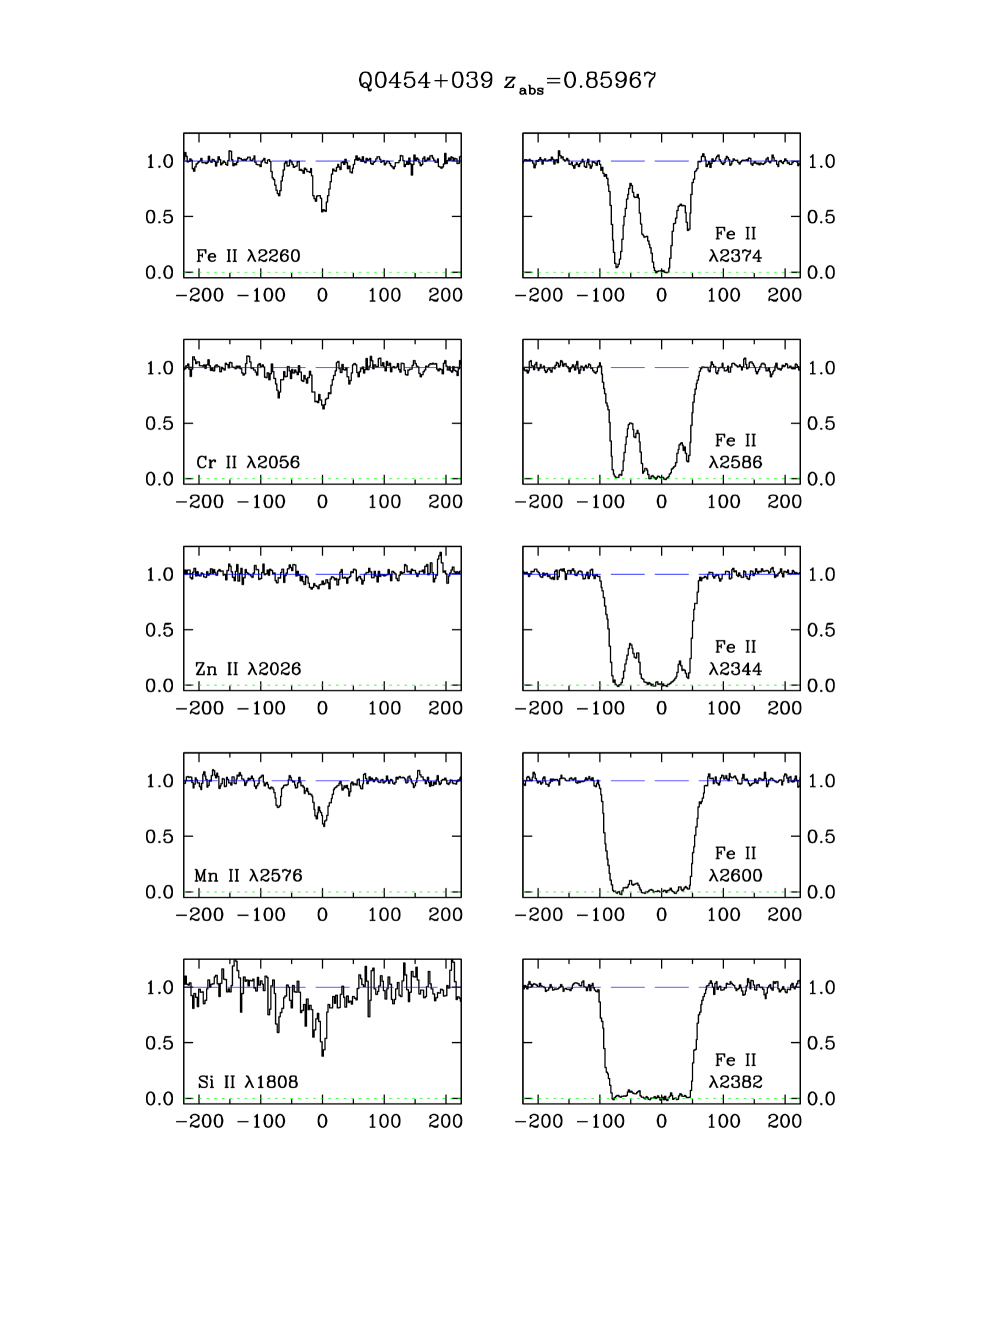
widths of only a few mÅ. Figures 3, 4, and 5 show examples of
absorption lines of varying strengths in each damped system.
4 ION COLUMN DENSITIES AND ELEMENT ABUNDANCES
When recorded at high spectral resolution the metal lines in QSO absorption systems commonly break up into multiple components; as can be seen from Figures 3, 4, and 5, the three DLAs observed here are no exception with the strongest absorption lines extending over 100 to 200 km s-1. We analysed these complex absorption profiles with the VPFIT software written by Bob Carswell. The procedure has been described in detail before (e.g Paper III). As our data include seven transitions of Fe II with widely different -values, spanning a range of , the model fits produced with VPFIT are well constrained and allow us to determine the redshift, velocity dispersion parameter b (, where is the one-dimensional velocity dispersion of the ions along the line of sight, assumed to be Gaussian), and ion column density N of each component. Details of the profile fits are collected in Table 3. The important point is that the total ion column densities do not depend on the fine detail of the profile decomposition because for each species considered we observe sufficiently weak transitions that the corresponding absorption lines fall on the linear part of the curve of growth. The exception is the Mg II doublet which is strongly saturated (see Figure 3) and is therefore not included in the present analysis.
The total column densities of the first ions of Zn, Si, Mn, Cr, Fe, and Ni in each DLA are listed in Table 4, together with (H0). In deriving these values we used the compilation of -values by Morton (1991) with the revisions proposed by Savage & Sembach (1996). For Ni II we took advantage of the recent radiative lifetime measurements by Fedchack & Lawler (1999) which have led to a reduction by a factor of 1.9 of the -values of the and transitions relative to the values proposed by Zsargó & Federman (1998). The ensuing upward revision of (Ni+) by a factor of is significant for the interpretation of the pattern of relative element abundances, as discussed below (§5).
Since in DLAs the elements considered here are predominantly singly ionized, their abundances can be deduced directly by dividing the values of N in columns (4) to (9) by the values of (H0) in column (3) of Table 4. Comparison with the solar system abundance scale of Anders & Grevesse (1989) finally gives the relative abundances listed in Table 5. (We have included in Table 5 the abundance measurements from Paper III, with the appropriate revisions for (Ni+), as they will be considered in the discussion below.) We now briefly describe the results for the three DLAs which are the subject of the present paper.
1. Q0058+019; : Among the species observed in our HIRES spectra Zn gives the most direct measure of metallicity, free from the complication of dust depletion. In this low redshift DLA the Zn II doublet lines fall at 3267 and 3326 Å respectively, where observations are difficult due to atmospheric absorption. Although noisy, we clearly detect both lines; given the relatively low column density of hydrogen in this system, the presence of Zn II absorption in itself implies high abundances and indeed we deduce [Zn/H] . The conclusion that this absorber has near-solar metallicity does not rest on the poorly observed Zn II lines alone; as can be seen from Table 5, the abundances of Cr and Fe, two other iron-peak elements, are also within a factor of of solar and could be higher if some fraction of these elements has been incorporated into dust grains, as discussed below (§5).
Evidently, DLAs with near-solar abundances are not rare at ; out of the six measurements available to date, three have metallicities (see Figure 7 of Paper III). However, a wide range of values of [Zn/H], spanning dex, persists at all redshifts. It is intriguing that systems with high metallicity are invariably at the low end of the distribution of neutral hydrogen column density, so that the census of metals seen in absorption is dominated by gas with high (H0) and low metal content.222Thus, the new measurement for this DLA has a minimal effect on the column-density weighted average in the redshift interval derived in Paper III. It is highly likely that selection effects play a role here; DLAs with large columns of molecules (and therefore probably high metallicity) are known to exist (e.g. the = 0.68466 21 cm absorber towards B0218+357—Carilli, Rupen, & Yanny 1993; Wiklind & Combes 1995), but are too faint to be studied spectroscopically at optical and ultraviolet wavelengths. It is a lingering concern, however, that such selection effects are still largely unquantified.
Galaxies in the local universe exhibit a rough correlation between metallicity and -band luminosity which apparently persists at least to (Kobulnicky & Zaritsky 1999). Referring to these authors’ Figure 4 it can be seen that, with and [Zn/H] , the = 0.61251 absorbing galaxy in Q0058+019 is somewhat metal-rich for its luminosity but is not inconsistent with the local relationship given the observed scatter. What is perhaps more remarkable is to find a near-solar abundance at relatively large distances from the centre of the galaxy. If the DLA arises in the disk, the high inclination of the galaxy, , places it at a galactocentric distance of /cos kpc. If the absorption takes place in the halo, it would imply the existence of a cloud with (H I) cm-2 and solar metallicity kpc above the mid-plane of the galaxy. In either case it would seem that this galaxy does not have a marked abundance gradient, either along or perpendicular to the disk.
2. Q0302223; : As can be seen from Figure 4, two main groups of components, separated by 36 km s-1, produce most of the absorption seen in this DLA; additional weaker components, at and km s-1 relative to = 1.00945 are visible in the stronger Fe II lines. Although the Zn II and Cr II lines are weak, the corresponding column densities and abundances in Tables 3 and 4 are in excellent agreement with the values reported in Paper II which were measured from data of much lower resolution (0.88 Å compared to 0.08 Å FWHM). HST WFPC2 imaging (Le Brun et al. 1997) has revealed two compact galaxies close to the line of sight. At they would have absolute luminosities and and impact parameters and kpc respectively. It remains to be established with spectroscopic observations which of the two galaxies is associated with the damped absorber.
3. Q0454+039; : Two groups of components,
separated by km s-1, are responsible for most of the
absorption in this DLA (Figure 5). Again, the column densities
we deduce for Zn+, Cr+, and Fe+ are in excellent agreement
with the values measured
by Steidel et al. (1995) from 2.3 Å resolution Lick spectra,
once allowance is made for the different -values used.
These authors also reported the presence of a compact galaxy close to the
line of sight to the QSO, subsequently confirmed with WFPC2 images by Le
Brun et al. (1997). If this is the absorber, it is at a projected
separation of kpc and it has an absolute luminosity
. The low element abundances we find,
approximately 1/10 of solar, indicate that this galaxy apparently does
not conform to the metallicity-luminosity relation
discussed by Kobulnicky & Zaritsky (1999); in this respect it
is more in line with present-day H II galaxies.
5 DUST DEPLETIONS
The pattern of relative abundances measured in the interstellar gas of distant galaxies responds to two effects, the selective depletion of refractory elements onto dust grains and inherent differences from the solar system scale, reflecting the past history of star formation which may well have been different from that of the Milky Way disk. Our goal here is to separate these two effects and, by accounting for the first, gain an insight into the second. In this endeavour we are guided by the extensive body of data on element abundances in stellar populations and the interstellar medium (ISM) of our Galaxy.
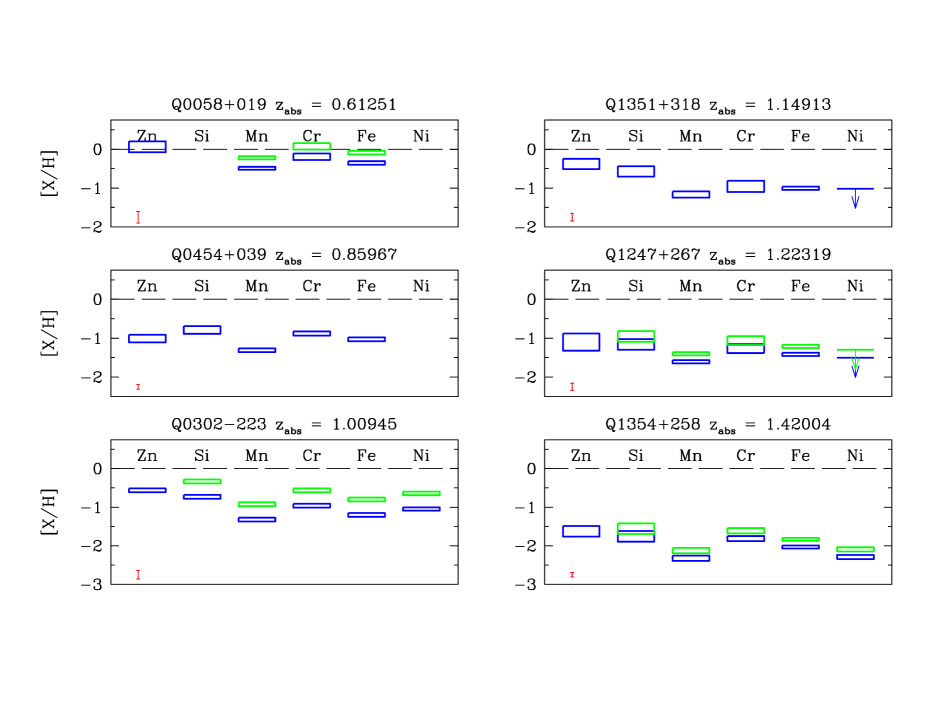
Of the elements considered here, Zn, Cr, Fe, and Ni all track each other closely in Galactic stars with metallicities (e.g. Ryan, Norris, & Beers 1996). Dust depletion, on the other hand, is more significant for Cr, Fe, and Ni than for the generally undepleted Zn (Savage & Sembach 1996). It follows from these considerations that we can take the ratios [Zn/Cr], [Zn/Fe], and [Zn/Ni] as indicative of the fractions of these refractory elements which are missing from the gas-phase, e.g.
| (1) |
where and are the fractions of Cr in gaseous and solid form respectively.333Recently, Howk & Sembach (1999) have drawn attention to the fact that ionization effects may boost the (Zn+)/(Cr+) ratio thereby mimicking dust depletion. However, this is unlikely to be the case for the DLAs considered here. Such effects would also increase the (Ni+)/(Cr+) ratio by similar factors, contrary to our measurements. Based on the calculations by Howk & Sembach (1999), the observed [Ni/Cr] implies very low ionization parameters, as expected for clouds with (H I) cm-2.
The boxes with the heavy outline in Figure 6 show the abundances measured in the six intermediate redshift DLAs listed in Table 5. Two conclusions can be drawn from inspection of this Figure. First, the depletions of Cr, Fe and, when available, Ni are roughly comparable, as is the case in the local ISM (Savage & Sembach 1996).444The revision in the oscillator strengths of the Ni II lines mentioned in §4 has brought this element into better agreement with Fe and Cr, resolving an apparent puzzle which had been noted by Lu et al. (1996) and in Paper III. Second, the depletion levels are relatively modest, ranging from near-zero in Q0454+039 to a factor of in Q1351+318 (% of Cr, Fe, and Ni in the gas). Such values are typical of DLAs in general (Pettini et al. 1997a), whereas in the disk of the Milky Way the same elements are depleted by more than one order of magnitude (see Figure 6 of Savage & Sembach 1996).
It is unclear what lies at the root of this difference. It is interesting that the ISM of the Small Magellanic Cloud also exhibits only mild depletions (Welty et al. 1997), but metallicity alone is unlikely to be the explanation, because there is no trend in our data for a dependence of [Zn/Cr] on [Zn/H] (for example Cr and Fe are depleted by only a factor of in Q0058+019, where [Zn/H] is approximately solar). In any case, it appears that in most DLAs the balance between the incorporation of refractory elements into, and their release from, dust grains is shifted relative to the physical conditions prevailing in cool disk clouds on the Milky Way, so that on average there are roughly equal proportions of these elements in gas and dust. Note that this is unlikely to be the result of dust-related selection effects analogous to those mentioned earlier (§4). The total column densities of metals in the DLAs studied here are too low to produce significant dust reddening, even if 100% of the elements which make up the grains were in solid form.
Finally on this topic, we point out that in two cases, Q0302223
and Q0454+039, we can determine depletions separately for the two
well resolved groups of components which make up the absorption lines
(see Figures 4 and 5).
The results are summarised in Table 6.
Predictably, in Q0454+039 both components appear to be dust-free (since
their sum is!). In Q0302223, however, we see that the gas with
the higher optical depth, at the adopted systemic redshift = 1.00945,
has [Zn/Cr, Fe, Ni] , while in the component at
km s-1 the same ratio is only .
Reduced depletions in interstellar clouds with high
velocities are commonplace in the local ISM, where they have been known for
nearly 50 years (Routly & Spitzer 1952) and are understood to arise from
grain destruction in interstellar shocks.
6 ELEMENT RATIOS
Two of the elements covered by our observations, Si and Mn, exhibit metallicity dependent ratios (relative to Fe) in Galactic stars, presumably because their nucleosynthesis follows different channels from that of the Fe-peak group. Furthermore, in the local ISM both elements show a degree of dust depletion. When overall depletion levels are high, Mn and Si are normally less underabundant than Fe, Cr, and Ni. However, such differences become less pronounced as depletions are reduced (Figure 6 of Savage & Sembach 1996)—all elements tend to the same depletion as the overall depletion level approaches zero. If we restrict ourselves to cases where [Zn/Cr] (and therefore in eq. (1) so that dust correction factors are ), we may be justified in assuming that to a first approximation all refractory elements are depleted by the same factor.555In future it should be possible to test this assumption by measuring the abundance of S, an undepleted -element. If the assumption is correct, we expect [S/Si] = [Zn/Cr, Fe, Ni]. The boxes with the light outline in Figure 6 show element abundances corrected for the dust fractions implied by the observed [Zn/Cr] ratios; in each case adopting the mean [Zn/Cr, Fe, Ni] ratio would produce very similar results. We take these values to represent the total abundances (gas + dust) of the element concerned and, having made this correction, we can now proceed to compare the abundances of Si and Mn in DLAs of different metallicities with analogous measurements in Galactic stars.
The approach taken here is similar to, but more conservative than, the analysis by Vladilo (1998) who also used the ratio of Zn to Fe-peak elements to correct for dust depletion. The main difference is in the fact that Vladilo applied the correction to all DLAs for which relevant measurements were available, irrespectively of the degree of depletion, with the assumption that dust in DLAs has the same composition as in the Milky Way ISM. In our opinion we are on safer ground by limiting ourselves to cases where because our conclusions do not then depend sensitively on the unknown detailed make-up of interstellar dust at high redshift.
6.1 Silicon
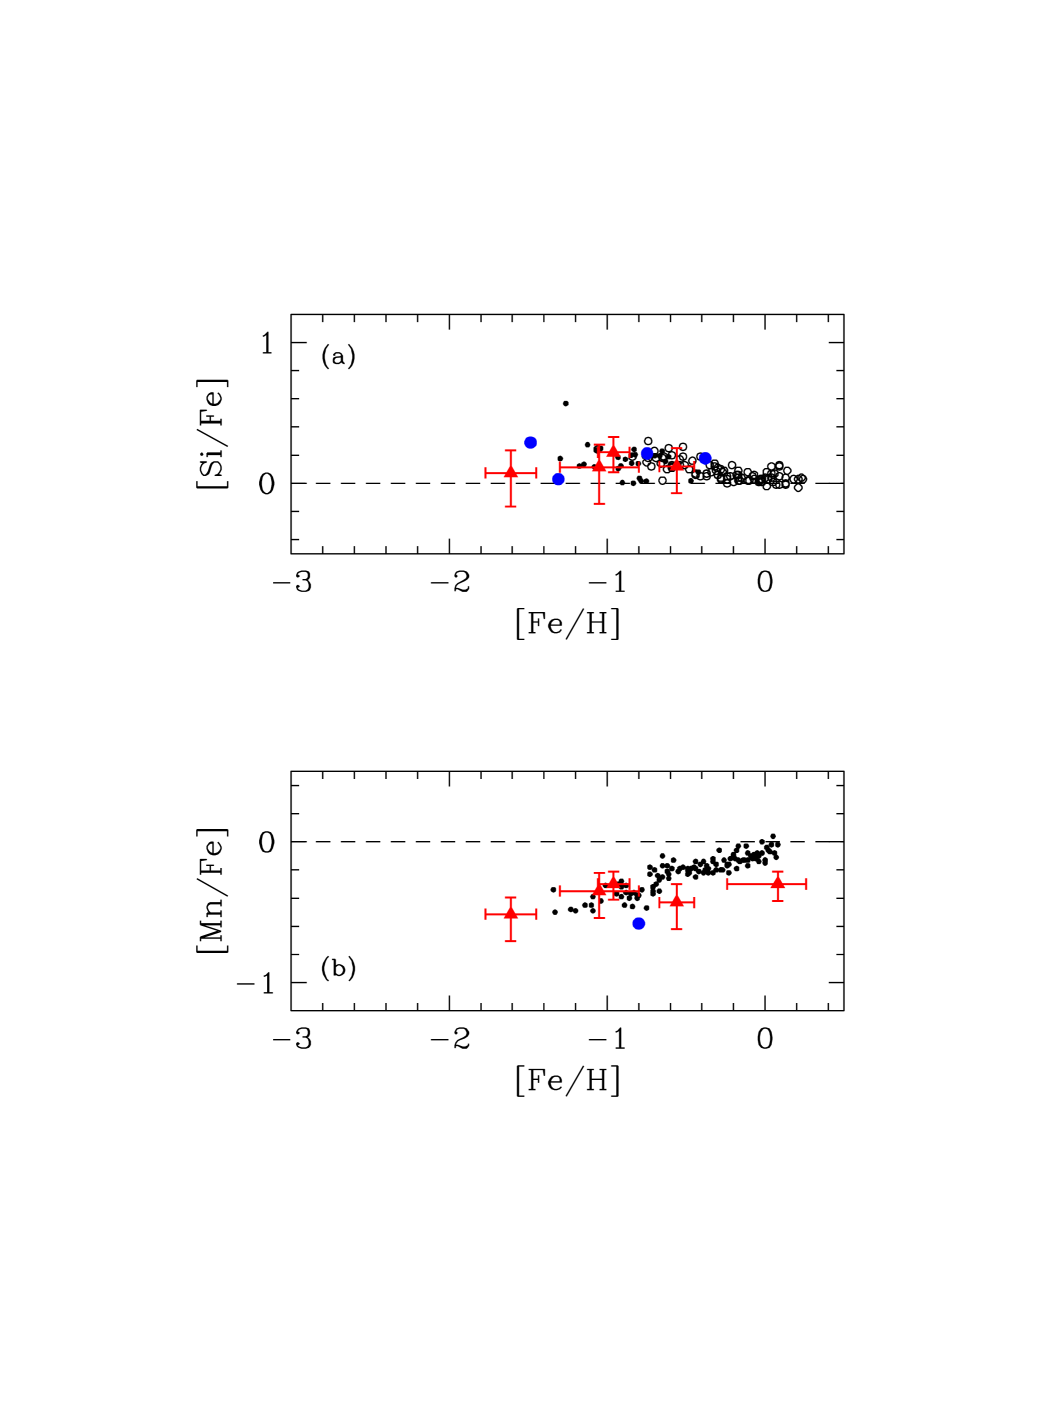
The data for Si are displayed in Figure 7a, where the dots are the stellar measurements by Edvardsson et al. (1993) and Nissen & Schuster (1997). The general trend is for a mild increase in the relative abundance of Si at low metallicity; [Si/Fe] to at [Fe/H] . This is an example of the well known overabundance of the -elements which is generally attributed to the delayed production of additional Fe by Type Ia supernovae. In this picture, the overall metallicity (as measured by [Fe/H]) at which the ratio [/Fe] begins to decline towards the solar value depends on the previous history of star formation. A galaxy which turns most of its gas into stars within Gyr (the generally assumed timescale for the explosion of Type Ia supernovae) would maintain an enhanced [/Fe] ratio while [Fe/H] grows to high values. Such a scenario may apply to the thick disk and the bulge of the Milky Way where recent observations seem to indicate a uniform enhancement of the -elements at all metallicities (Fuhrmann 1998; Rich 1999, private communication). At the other extreme, in a galaxy where star formation proceeds slowly, or in bursts separated by quiescent periods lasting more than 1 Gyr, there would be time for [/Fe] to decline to the solar value (or even lower) while [Fe/H] remains low (Gilmore & Wyse 1991; Pagel & Tautvaisviene 1998).
Returning to Figure 7a, we now consider the evidence provided by DLAs. Triangles show our measurements from Table 5, corrected for dust as explained above and taking Zn as a proxy for Fe.666This approach is preferable to using our Fe abundances directly, because the latter are based on very weak transitions with oscillator strengths which may be less secure than those of the Zn II doublet. The systematic underabundance by dex of Fe relative to Cr in Figure 6 may well reflect the relative uncertainty in the -values of the Cr II and Fe II lines. We also searched the literature for other DLAs where the abundances of Zn, Cr, and Si have been measured and the ratio [Zn/Cr] is within a factor of two of solar (therefore implying correspondingly small dust corrections). We found four such cases, all from the recent compilation by Prochaska & Wolfe (1999); they are shown in Figure 7a as large filled dots, again with the assumption that Cr and Si are depleted by similar amounts. The most straightforward conclusion from Figure 7a is that the [Si/Fe] ratio in DLAs is not dissimilar from the values observed in Galactic stars. At least half of the DLA measurements fall well in line with the bulk of stellar data. There are also hints of differences, with two or three cases where [Si/Fe] appears to be approximately solar at [Fe/H] . While it is premature to make too much of these differences, it is probably fair to say that, unlike the situation for Galactic stars, one would not discern any trend in the [Si/Fe] ratio with metallicity from the DLA results alone. Thus, the data available at present are certainly consistent with the view that damped Lyman absorbers are drawn from a varied population of galaxies which may have processed their interstellar gas at different rates prior to the time when we observe them. On the other hand, blanket statements to the effect that the chemical histories of DLAs are different from that of the Milky Way (e.g. Vladilo 1998) do not seem to be fully justified on the basis of the data for Si in Figure 7a.
6.2 Manganese
A major new study of the abundance of Mn has recently been completed by Nissen et al. (2000) who measured [Mn/Fe] in 119 Galactic F and G stars from the thin disk, the thick disk, and the halo, following the same method as Edvardsson et al. (1993) and making use of Hipparcos parallaxes where available. The analysis takes into account hyperfine structure splitting of the Mn I lines, which is one of the complications involved in bringing together different data sets from previous studies. The measurements by Nissen et al. are reproduced as small dots in Figure 7b. There is an obvious drop in [Mn/Fe] with decreasing [Fe/H]; in the most metal-poor disk stars, at [Fe/H] , [Mn/Fe] . The physical processes responsible for the metallicity dependence of [Mn/Fe] have not yet been confidently identified. Observers have remarked on the fact that the [Mn/Fe] trend seems to mirror the overabundance of the -elements but in the opposite sense (e.g. McWilliam 1997), leading to the conjecture that Type Ia supernovae may be an important source of Mn (Samland 1998; Nakamura et al. 1999). On the other hand, nucleosynthesis calculations can reproduce the shape of the trend in Figure 7b with a metallicity dependence yield of Mn in massive stars which in the calculations by Timmes, Woosley, & Weaver (1995) overwhelms the Type Ia contribution.
The filled triangles in Figure 7b show the values of [Mn/Fe] determined for five of the DLAs considered in this paper, again taking Zn as the proxy for Fe for the reason explained above. From a literature search we found only one other data point which could be included in our analysis, in the = 1.3726 DLA towards Q0935+417 where [Zn/H] , [Cr/H] , and [Mn/H] (Meyer, Lanzetta, & Wolfe 1995; Pettini et al. 1997b). The comparison between stars and DLAs is complicated by the fact that there is still some uncertainty regarding the correct solar system value of the abundance of Mn. Anders & Grevesse (1989) quote log (Mn/H) in the solar photosphere, but log (Mn/H) from meteorites (the latter value is the one used in the present analysis). This discrepancy persists in the more recent reappraisal of ‘Standard Abundances’ by Grevesse, Noels, & Sauval (1996). The uncertainty in (Mn/H)⊙ does not affect the stellar data of Nissen et al. (2000) which are all derived from differential measurements, but it does mean that there is a 0.14 dex ambiguity in referring the DLA values to the stellar scale. Thus the triangles and filled large dot in Figure 7b may need to be raised by 0.14 dex should the meteoritic abundance determination turn out to be in error.
Even with this caveat, it does appear that Mn is underabundant in the galaxies producing damped Lyman systems by factors similar to those measured in Galactic metal-poor stars. As in the case of Si, there are no obvious trends from the QSO absorption line data alone; [Mn/Fe] is an adequate description of the whole DLA sample available at present. It is intriguing that the underabundance of Mn seems to persists to metallicities as high as solar, although admittedly such a statement is at present based on only one measurement. If further cases are found in future, the hypothesis that the underabundance of Mn is due to a metallicity-dependent yield in massive stars would clearly run into difficulties. On the other hand, finding that Mn is low ([Mn/Fe] ) in one DLA (in Q1354+258) which shows no enhancement of Si at low metallicity ([Fe/H] —see Figure 7), argues against the SN Type Ia interpretation, as also pointed out by Nissen et al. (2000). Possibly a third process, yet to be identified, is responsible for the metallicity dependence of the abundance of Mn.
7 CONCLUSIONS
We have measured element abundances in three galaxies which give rise to damped Lyman systems at intermediate redshifts (). The new data confirm the well established result that significantly smaller fractions of refractory elements are incorporated into dust grains in DLAs compared with interstellar clouds of similar column density in the disk of the Milky Way. Although the physical reasons underlying this effect are not fully understood, empirically it appears that the equilibrium between gas and dust in damped absorbers is shifted so that on average comparable proportions of the grain constituents are in gaseous and solid forms. We propose that in cases where dust depletions are less than a factor of about two, it is possible to account for the unobserved fractions of Si, Mn, Cr, Fe, and Ni by assuming that they are all depleted by approximately the same factor. This assumption then allows us to examine the dependence on metallicity of the intrinsic abundances of Si and Mn.
We find that the abundances of both elements are broadly in line with values measured in metal-poor stars of the Milky Way. In about half of the cases considered Si is mildly enhanced relative to Fe-peak elements at the typically lower-than-solar metallicities of the DLAs, but there are also counterexamples where [Si/Fe] is more nearly solar even though [Fe/H] is less than 1/10 solar. The underabundance of Mn at low metallicities is possibly even more pronounced than in Galactic stars, and no DLA has yet been found with a solar [Mn/Fe]. However, for neither element is there a clear abundance trend with metallicity; in our view this is an indication that galaxies picked by damped Lyman absorption have experienced a variety of star formation histories prior to the time when we observe them. In this respect chemical abundances give a picture consistent with the results from imaging studies (including new observations reported here) which have shown that galaxies associated with DLAs exhibit a wide range of morphologies, luminosities, and surface brightnesses.
It is important to emphasize the preliminary nature of these conclusions
which are based on the comparison of very few measurements in DLAs
with a much larger body of stellar data. One of the lessons from stellar
work is that there is considerable scatter, observational and intrinsic,
in the relative abundances of different elements so that most
trends only become apparent when a large set of observations
has been assembled.
As a field of study, abundance determinations in high redshift galaxies
are some twenty years behind their counterparts in
Galactic stars but they may well hold the key to clarifying some of the
still unresolved issues on the origin of elements.
References
- (1) Anders, E., & Grevesse, N. 1989, Geochim. Cosmochim. Acta, 53, 197
- (2)
- (3) Carilli, C.L., Rupen, M.P., & Yanny, B. 1993, ApJ, 412, L59
- (4)
- (5) Edvardsson, B., Andersen, J., Gustafsson, B., Lambert, D.L., Nissen, P.E., & Tomkin, J. 1993, A&A, 275, 101
- (6)
- (7) Fedchak, J.A., & Lawler, J.E. 1999, ApJ, in press
- (8)
- (9) Folkes, S., et al. 1999, MNRAS, in press (astro-ph/9903456)
- (10)
- (11) Fruchter, A.S., & Hook, R.N. 1999, PASP, submitted (astro-ph/9808087)
- (12)
- (13) Fuhrmann, K. 1998, A&A, 338, 161
- (14)
- (15) Gilmore, G., & Wyse, R.F.G. 1991, ApJ, 367, L55
- (16)
- (17) Grevesse, N., Noels, A., & Sauval, A.J. 1996, in Cosmic Abundances, ed. S. Holt, & G. Sonneborn (San Francisco: ASP), 117
- (18)
- (19) Howk, J.C., & Sembach, K.R. 1999, ApJ, submitted
- (20)
- (21) Kobayashi, C., Tsujimoto, T., Nomoto K., Hachisu, I., & Kato, M. 1998, ApJ, 503, 155
- (22)
- (23) Kobulnicky, H.A., & Zaritsky, D. 1999, ApJ, 511, 118
- (24)
- (25) Lanzetta, K.M., et al. 1997, AJ, 114, 1337
- (26)
- (27) Lanzetta, K.M., Wolfe, A.M., & Turnshek, D.A. 1995, ApJ, 440, 435
- (28)
- (29) Le Brun, V. Bergeron, J., Boissé, P., & Deharveng, J.M. 1997, A&A, 321, 733
- (30)
- (31) Lu, L., Sargent, W.L.W., Barlow, T.A., Churchill, C.W., & Vogt, S.S. 1996, ApJS, 107, 475
- (32)
- (33) McWilliam, A. 1997, ARA&A, 35, 503
- (34)
- (35) Meyer, D.M., & York, D.G. 1992, ApJ, 399, L121
- (36)
- (37) Meyer, D.M., Lanzetta, K.M., & Wolfe, A.M. 1995, ApJ, 451, L13
- (38)
- (39) Morton, D.C. 1991, ApJS, 77, 119
- (40)
- (41) Nakamura, T., Umeda, H., Nomoto, K., Thielemann, F.-K., & Burrows, A. 1999, ApJ, 517, 193
- (42)
- (43) Nissen, P.E., Chen, Y.Q., Schuster, W.J., & Zhao, G. 2000, A&A, submitted
- (44)
- (45) Nissen, P.E., & Schuster, W.J. 1997, A&A, 326, 751
- (46)
- (47) Pagel, B.E.J., & Tautvaisviene, G. 1998, MNRAS, 299, 535
- (48)
- (49) Pettini, M. & Bowen, D.V. 1997, A&A, 327, 22 (Paper II)
- (50)
- (51) Pettini, M., Ellison, S.L., Steidel, C.C., & Bowen, D.V. 1999, ApJ, 510, 576 (Paper III)
- (52)
- (53) Pettini, M., King, D.L., Smith, L.J., & Hunstead, R.W. 1997a, ApJ, 478, 536
- (54)
- (55) Pettini, M., Lipman, K., & Hunstead, R.W. 1995, ApJ, 451, 100
- (56)
- (57) Pettini, M., Smith, L.J., King, D.L., & Hunstead, R.W. 1997b, ApJ, 486, 665
- (58)
- (59) Prantzos, N., & Silk, J. 1998, ApJ, 507, 229
- (60)
- (61) Prochaska, J.X., & Wolfe, A.M. 1999, ApJS, in press (astro-ph/9810381)
- (62)
- (63) Rao, S.M., & Turnshek, D.A. 1998, ApJ, 500, L115
- (64)
- (65) Rosa, M.R., Kerber, F., & Keyes, C.D. 1998, FOS Instrument Science Report CAL/FOS-149
- (66)
- (67) Routly, P.M., & Spitzer, L. 1952, ApJ, 115, 227
- (68)
- (69) Ryan, S.G., Norris, J.E., & Beers, T.C. 1996, ApJ, 471, 254
- (70)
- (71) Samland, M. 1998, ApJ, 496, 155
- (72)
- (73) Savage, B.D., & Sembach, K.R. 1996, ARA&A, 34, 279
- (74)
- (75) Steidel, C.C., Bowen, D.V., Blades, J.C., & Dickinson, M. 1995, ApJ, 440, L45 (Paper I)
- (76)
- (77) Steidel, C.C., & Hamilton, D. 1993, AJ, 105, 2017
- (78)
- (79) Timmes, F.X., Woosley, S.E., & Weaver, T.A. 1995, ApJS, 98, 617
- (80)
- (81) Vladilo, G. 1998, ApJ, 493, 583
- (82)
- (83) Vogt, S.S. et al. 1994, S.P.I.E., 2198, 362
- (84)
- (85) Welty, D.E., Lauroesch, J.T., Blades, J.C., Hobbs, L.M., & York, D.G. 1997, ApJ, 489, 672
- (86)
- (87) Wheeler, J.C., Sneden, C., & Truran, J.W. 1989, ARA&A, 27, 279
- (88)
- (89) Wiklind, T., & Combes, F. 1995, A&A, 299, 382
- (90)
- (91) Wolfe, A.M., Turnshek, D.A., Smith, H.E., & Cohen, R.D. 1986, ApJS, 61, 249
- (92)
- (93) Zsargó, J., & Federman, S.R. 1998, ApJ, 498, 256
- (94)
| (′′) | (′′) | (′′) | b,cb,cfootnotemark: (kpc) | (mag) | (mag)cc km s-1 Mpc-1; | Comments |
|---|---|---|---|---|---|---|
| 0.8 | 0.85 | 1.2 | 10.3 | 23.7 | Edge-on, late-type spiral |
![[Uncaptioned image]](/html/astro-ph/9910131/assets/x1.png)
| QSO | Component No. | (km s-1) | log (Fe+) (cm-2) | |
|---|---|---|---|---|
| Q0058+019 | 1 | 0.612240 | 6.0 | 12.83 |
| 2 | 0.612508 | 6.1 | 14.77 | |
| 3 | 0.612616 | 24.9 | 15.01 | |
| 4 | 0.612866 | 8.0 | 13.69 | |
| 5 | 0.612940 | 2.4 | 13.25 | |
| 6 | 0.613041 | 16.8 | 13.28 | |
| 7 | 0.613139 | 7.4 | 13.63 | |
| Q0302223 | 1 | 1.009025 | 4.6 | 11.97 |
| 2 | 1.009177 | 10.2 | 13.92 | |
| 3 | 1.009244 | 4.0 | 13.86 | |
| 4 | 1.009397 | 8.9 | 14.01 | |
| 5 | 1.009452 | 9.7 | 14.29 | |
| 6 | 1.009566 | 2.6 | 12.89 | |
| 7 | 1.009685 | 2.9 | 12.90 | |
| 8 | 1.010266 | 7.6 | 12.13 | |
| Q0454+039 | 1 | 0.859225 | 5.4 | 14.38 |
| 2 | 0.859248 | 16.8 | 14.00 | |
| 3 | 0.859401 | 3.9 | 13.17 | |
| 4 | 0.859486 | 6.1 | 13.78 | |
| 5 | 0.859670 | 14.8 | 15.00 | |
| 6 | 0.859917 | 9.4 | 13.83 | |
| 7 | 0.860045 | 6.2 | 12.22 |
![[Uncaptioned image]](/html/astro-ph/9910131/assets/x2.png)
![[Uncaptioned image]](/html/astro-ph/9910131/assets/x3.png)
![[Uncaptioned image]](/html/astro-ph/9910131/assets/x4.png)