X-ray and Radio Interactions in the Cores of Cooling Flow Clusters
Abstract
We present high resolution ROSAT x-ray and radio observations of three cooling flow clusters containing steep spectrum radio sources at their cores. All three systems exhibit strong signs of interaction between the radio plasma and the hot intracluster medium. Two clusters, A133 and A2626, show enhanced x-ray emission spatially coincident with the radio source whereas the third cluster, A2052, exhibits a large region of x-ray excess surrounding much of the radio source. Using 3-D numerical simulations, we show that a perturbed jet propagating through a cooling flow atmosphere can give rise to amorphous radio morphologies, particularly in the case where the jet was “turned off” and allowed to age passively. In addition, the simulated x-ray surface brightness produced both excesses and deficits as seen observationally.
1 Introduction
Several classes of radio sources are known to exhibit morphological and physical properties which are dramatically influenced by their environments, e.g. amorphous radio sources (Burns 1990; Burns 1996), wide angle tailed radio sources (Pinkney 1995; Gomez et al. 1997), and narrow angled tail radio sources (Bliton et al. 1998). Consequently, the most profoundly affected sources are generally found in the most extreme environments, i.e. within clusters of galaxies. Evidence suggests, however, that the interaction between the radio source and the intracluster medium (ICM) not only affects the radio source, but also impacts the surrounding medium in an observationally and at times, dynamically significant manner.
One such case is in the powerful classical double Cygnus A. Observations of cavities and enhancements in the cluster x-ray emission have been interpreted as the result of sweeping and compression of the material by the expanding lobes and bow shock, respectively (Carilli, Perley & Harris 1994). Clark, Harris and Carilli (1997) lent support to this hypothesis through a series of 3D hydrodynamical simulations designed to mirror the observable conditions of CygA.
A2199 is another example where the radio source (3C338) and x-ray emission seem to have substantial mutual influence on one another. Owen & Eilek (1998) suggest that the radio source may have had a significant effect on the energetics of the cluster core, creating a complex environment which differs from a symmetric cooling flow at small radii. They interpret the radio source as having severely disrupted due to conditions in the cooling core, producing diffuse, bubble structures as a result. Other examples displaying similar evidence of a dynamical interaction between a central radio source and the ambient cooling flow media have been detected in the inner region of NGC1275 (3C 84 in the Perseus cluster; Bohringer et al. 1993) and M87 (Bohringer et al. 1995). New, high resolution radio maps of M87 show that the situation may become even more complex, including outflow conditions in the core (as opposed to a cooling inflow), mixing of the radio and x-ray plasma, and possible periodic cycling of the radio source (Owen, Eilek & Kassim 1999).
The developing complexity of these systems invites further investigation of radio sources residing at the cores of clusters of galaxies. Through observational analysis, paired with numerical simulations, information about both the radio source and the cluster environment can be extracted and models for their interactions/connections refined. Steep spectrum radio sources, often found at the cores of cooling flow clusters (Burns et al. 1997), are believed to be under-pressured and confined by the surrounding medium. Such confinement causes the amorphous shapes in the sources and a steepening of their spectral index due to aging of the electron population responsible for the synchrotron emission while maintaining surface brightness against adiabatic losses. These sources, therefore, serve as particularly good signposts for an x-ray/radio interaction.
In this paper, we present new high resolution ROSAT x-ray and VLA radio observations of three cooling flow clusters containing steep spectrum radio sources at their cores. These systems exhibit strong signs of interaction between the radio plasma and the hot intracluster medium. Two clusters, A133 and A2626, show enhanced x-ray emission spatially coincident with the radio source whereas the third cluster, A2052, has a large region of x-ray excess which surrounds much of the steep spectrum radio emission. We compare the observed features with results from 3D numerical simulations of perturbed jets propagating through a cooling flow atmosphere. With these simulations we are able to reproduce x-ray cavities and enhancements through compression and sweeping of the ICM. However, the morphology of the numerical jet does not exhibit the extreme bending which we see in the observed clusters implying that some other mechanism, beyond the initial perturbation, must be involved in order to break the symmetry of the jet. A preliminary analysis of this work was presented in Burns et al. (1997).
The paper is organized as follows. In §2 we define our sample and in §3 we describe the radio observations and morphologies of the sources. The x-ray observations and reductions are presented in §4 and the x-ray substructure analysis in §5. We discuss the possible emission mechanisms for the x-ray excesses in the observational data and determine magnetic field estimates for the inverse Compton case in §6. Section 7 contains a description of the model atmosphere and jet used in our numerical simulations and §8 contains the discussion and comparisons between the observed and modeled data. Throughout the paper, and unless stated otherwise.
2 The sample
The clusters for this study comprise a subsample of those selected in Ge & Owen (1994). Their sample was defined to include clusters which (1) are nearby and contained in the Abell cluster catalog; (2) are known to possess cooling flows with an accretion rate greater than (Arnaud (1988)); and (3) contain an extended radio source which is near the center of the cooling flow and powerful enough to be observed with the VLA. These clusters were cross-referenced with x-ray data available from ROSAT High Resolution Imager (HRI), leaving three interesting candidates. We have our own HRI data for A133 and A2626 and the data for A2052 were gathered from the public archives. Though selected from the Arnaud (1988) catalog, more recent studies have determined mass accretion rates largely consistent with the these results. These clusters all have relatively strong cooling flows with rates of , and () for A133, A2052 and A2626 respectively (White, Jones & Forman 1997).
3 Radio observations and source morphology
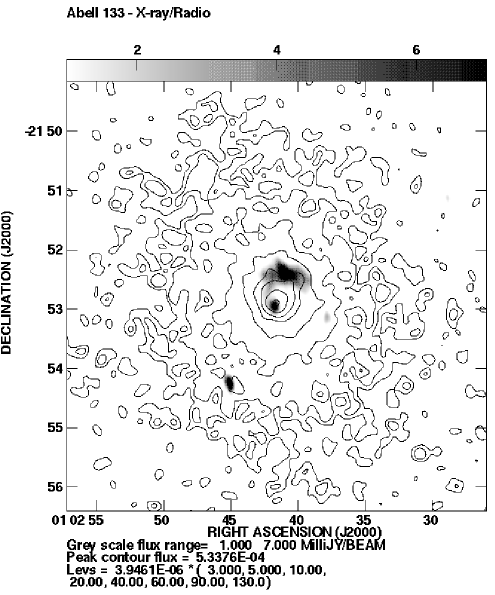
The radio data for the sample were observed using the Very Large Array (VLA) in several different modes including new, 20-cm radio observations of A133 and A2626. The dates of the observations are listed in Table 1 along with the array configuration, bandwidth and total flux density for both sources. Secondary flux calibrators were observed every 20 minutes in order to account for phase errors and changes in the atmospheric and system conditions. The absolute flux of the radio sources was calibrated by observing the primary flux calibrator 3C48 at the beginning and end of the runs. The data were processed using standard procedures within the AIPS environment where the maps were created using the task IMAGR, after cleaning and self-calibrating the data. A133 was observed in two arrays in order to increase the sensitivity to smaller scale structures and the visibility data were combined via the task DBCON. The radio maps shown in Fig. 1-2 were restored using a Gaussian beam of and for A133 and A2626, respectively. The asymmetry in the beam for A133 is caused by the low declination of the source.
The morphology of both these sources is very complex. They are known to be in the class of steep spectrum radio sources and thus their amorphous appearance is expected. Previous observations of A133 revealed it to have an extremely steep spectrum, particularly in the northern, elongated region (, where ; Slee & Reynolds (1984)). The compact component to the south is associated with the cD galaxy at the center of the cluster at a redshift of z=0.057. Earlier observations suggested that the two components (core and diffuse) were detached from one another. This implied the steep spectrum emission was a fossil radio source that was either an ejected plasmoid from the central source or the remnant of an accreted radio galaxy (Slee & Reynolds (1984)). The observations presented here show the two components to be clearly connected and thus a continuous system.
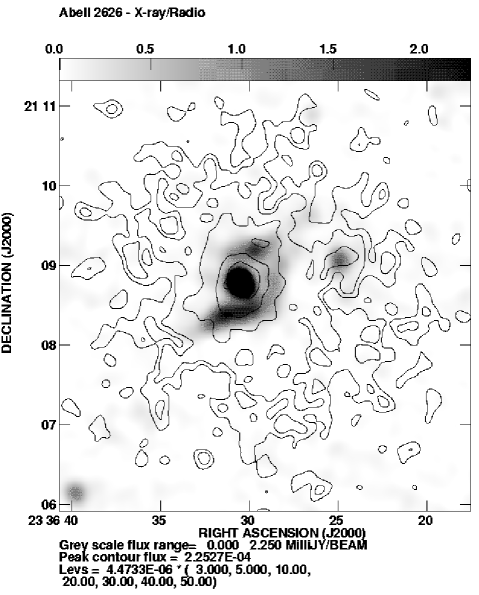
Abell 2626 is a very unusual source exhibiting a compact, unresolved core, and two steep spectrum, diffuse structures in a z-shaped orientation with respect to the central source. The compact component is associated with the centrally dominant elliptical galaxy (Owen, Ledlow & Keel (1995)) and the diffuse emission has no optical counterpart. The symmetry of these components and their steep spectral index (, Komissarov & Gubanov (1994)) imply they are spectrally aged lobes from the central source. A dynamical analysis of Abell 2626 revealed it to be a surprisingly complex cluster despite the symmetry of the large scale x-ray distribution. Mohr, Geller & Wegner (1996) found the galaxy distribution to be composed of three subgroups with indications of an ongoing merger between two of the components.
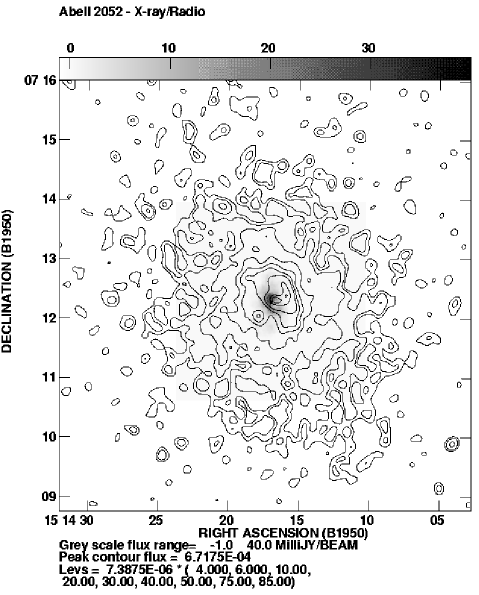
The radio data for Abell 2052 (3C 317), kindly supplied by J.-H. Zhao, are a combination of A and B configurations at 20-cm (see Zhao et al. (1993) for details). This source also has a very peculiar morphology with a compact core and a twisting, diffuse outer component. The outer halo was found to have an average spectral index of at GHz. Optical emission line gas, coincident with the weaker regions of the radio emission, has also been detected for A2052 (Heckman et al. 1989; Zhao et al. 1993).
4 X-ray reductions and analysis
All three clusters were observed with the High Resolution Imager aboard the ROSAT x-ray satellite. Two of these clusters, A133 and A2052, also have public ROSAT PSPC data which were used to supplement the HRI data. Table 2 lists the cluster name, the sequence number, and the Abell cluster position for each source. The exposure times and redshift for each cluster are also listed.
All x-ray reductions were performed using standard IRAF/PROS software. The HRI data were first examined and edited for intervals of high spurious count rates. With these time intervals excluded, the data were binned into pixel images to allow for an increase in the signal to noise without significantly degrading the resolution of the instrument. Background values for each cluster were determined from circular annuli selected outside the cluster emission and were subtracted from the original images. Lastly, the images were divided by the edited live times in order to generate count rate maps. The flat response of the HRI provides for less than a few percent error using this method. It should be noted that although these final images were utilized for part of the analysis, simple count maps were employed for the substructure tests (see §5). The HRI contour maps were overlaid onto optical grey scales for the three clusters and are shown in Figs. 1-3.
The HRI observations are only sensitive to the inner kpc of the cluster emission, essentially the core regions. For the purpose of this study, however, the emission extends far beyond the regions surrounding the radio sources in all three cases. The overall x-ray morphology of the three clusters is relatively relaxed outside the inner kpc. Abell 133 shows a strong central peak in the x-ray surface brightness consistent with the presence of a cooling flow, yet this peak is offset to the south relative to the outer emission. The apparent asymmetry can be attributed to the excess emission coincident with the steep spectrum (diffuse) region of the radio source. Abell 2626 also possesses a smooth, rather symmetric x-ray distribution at radii greater than about 45 kpc, with an elongation coincident with the steep spectrum, diffuse radio component. Of the three cases, the core x-ray emission for Abell 2052 is the most complex. The central few arcsec shows a flat, V-shaped morphology, becoming increasingly elliptical at larger radius.
To supplement the high resolution HRI data with sensitivity to low surface brightness emission, the PSPC data were retrieved for the two publicly available clusters, A133 and A2052. The hard band images (0.1-2.4 keV) were background subtracted using values determined from regions outside the cluster emission yet still interior to the inner ring of the instrument. They were then exposure corrected using the default exposure maps to produce count rate maps. These surface brightness images from the PSPC confirm the larger-scale, relaxed morphology implied by the HRI.
5 X-ray substructure analysis
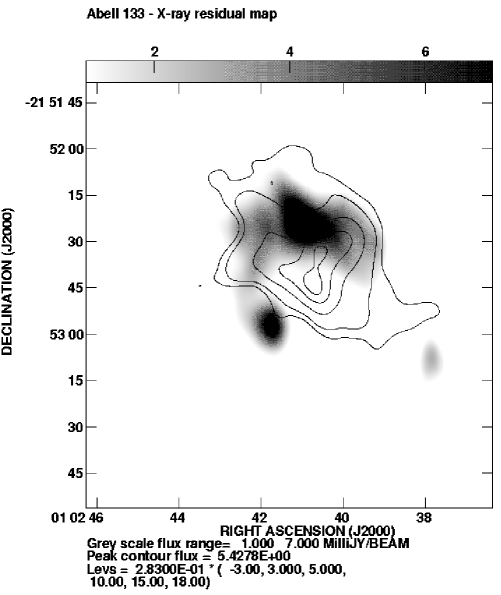
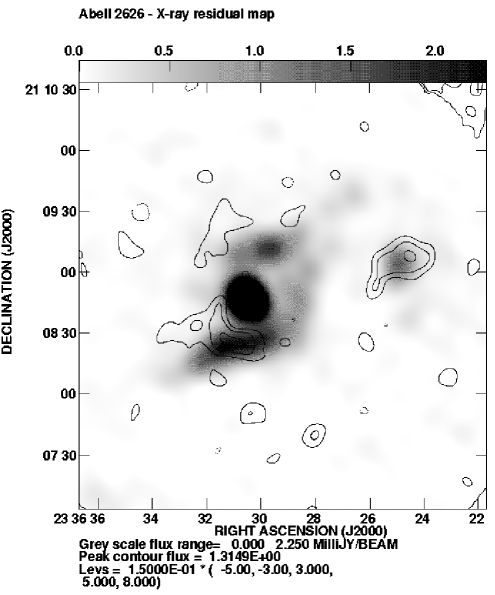
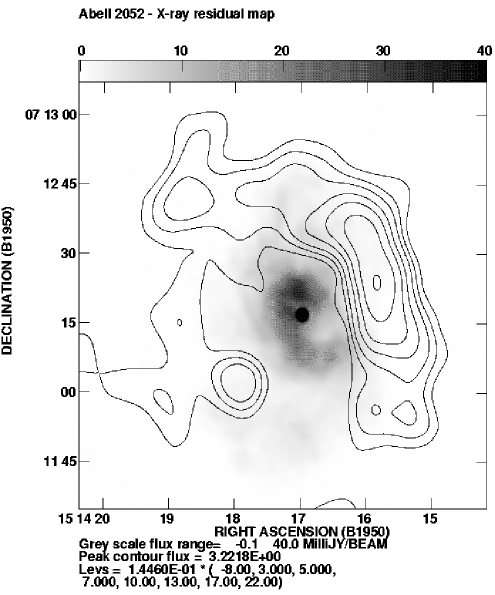
The first test for substructure employed in this analysis was motivated by the desire to accentuate observational signatures of possible interactions between the x-ray and radio emission. The analysis was specifically designed to detect regions of excess and/or cavities in the x-ray surface brightness which were coincident with the radio plasma. This was done by comparing the observed cluster to a smooth, isothermal model of the emission created within the IRAF/STSDAS environment. Using the task ELLIPSE, a fit to the ellipticity, position angle and intensity of the emission was performed. Since the goal was to create an idealized model, free of structural quirks, all obvious features and point sources in the images were masked out and the centroid position was fixed at the point of peak intensity. After the models were created, they were subtracted from the original cluster images, generating residual maps. The residual images were smoothed with a Gaussian and overlaid onto the radio maps as shown in Figs. 1-3.
The residual maps provide strong observational evidence for a connection between the hot, x-ray gas and the radio plasma. A133 and A2626 both show significant enhancements in the x-ray emission near the radio jets and A2052 shows a large ridge of excess x-ray emission surrounding much of the steep spectrum radio emission. As described in §1, such observational features may imply that the jet has interacted with the cluster gas.
Another method of determining whether the x-ray emitting gas and radio plasma are indeed interacting is through examining the shift in the isophotal fit parameters of the x-ray emission (Owen & Eilek (1998)). We chose to focus our analysis on the shift in the emission weighted centroid since this has been shown to be a sensitive measure of substructure (Mohr et al. 1995). Using the IRAF task ELLIPSE, an isophotal analysis of the x-ray surface brightness was again employed, fitting for the centroid position, as well as intensity, ellipticity and positional angle of the emission as a function of radius. The analysis was performed on the raw count images and the step size in semi-major axis, was set to twice the FWHM of the HRI point response. As a check of the ELLIPSE results, the centroid shift was also determined using a moment analysis based on the method of Buote & Canizares (1994). The code we used was adapted to perform the analysis in concentric circular annuli, thus increasing the sensitivity to shifts in high surface brightness regions such as the cores of cooling flows. Both methods produced nearly identical results for the centroid shifts, assuring the robustness of this test. Fig. 4 shows the centroid position as a function of radius for the inner regions of all three clusters. The profiles were smoothed with a boxcar average in order to enhance the shifts in the centroid position for the three sources (A133 and A2052 in particular) at angular scales () corresponding roughly to the distance of the steep spectrum radio emission from the x-ray center.
6 Emission mechanism
The previous analysis indicates that x-ray substructure is present in the three clusters examined. The model proposed here interprets the modification of the x-ray emission to be a result of an interaction between the radio plasma and the intracluster medium. However, for the two cases where x-ray excesses were observed to be coincident with the radio emission (A133 and A2626) the possibility of a non-thermal origin for the emission cannot be entirely ruled out. Non-thermal x-ray emission could be produced by inverse Compton (IC) scattering of the 3K microwave background radiation off the relativistic electrons in the radio plasma (Harris & Grindlay 1979). This process would manifest itself in spatially coincident x-ray and radio structures as seen observationally. Ideally, one would like to examine the spectral signatures of the regions in order to distinguish between a power law or thermal spectrum. Unfortunately, the small angular scales of these structures precludes using the PSPC data for A133. The HRI data has adequate spatial resolution but negligible spectral resolution and therefore is also incapable of differentiating between the two emission models. Upcoming x-ray missions (e.g. AXAF, XMM) will provide the sensitivity and resolution necessary for such a distinction.
As an alternate approach to addressing this issue, the excess emission was assumed to be due to IC scattering and the implications for the underlying magnetic field were examined. Under the IC assumption, one can calculate the magnetic field necessary to create an x-ray excess using the expression from Harris & Grindlay (1979),
| (1) |
where is the magnetic field and is a function of the spectral index of the source and adopted to be for (Harris & Grindlay 1979) . is a correction factor for the energy distribution of the microwave background radiation with a value on the order of unity, (ergs is the observed radio flux density at the observed frequency and (ergs is the observed x-ray flux density at the observed x-ray frequency, . Since and are both measured quantities, one can estimate the magnetic field for the two clusters in a rather straightforward manner. The resultant fields, and for A133 and A2626, respectively, are listed in Table 3 along with the flux densities and spectral indicies used for both cases (see below). For comparison, the equipartition fields in these regions, were calculated over the frequency range of 0.29-4.885 GHz and 0.38-4.885 GHz for A133 and A2626 respectively. A volume filling factor of was assumed along with equal contributions of proton and electron energies (k=1). These values are relatively uncertain due to the required assumptions about the geometry of the system (in this case taken to be cylindrical), however, it serves as a framework for comparison with our IC derived magnetic field results.
As listed in Table 3, , yet there are several caveats which hint at a contribution from a non-thermal source for the x-ray emission. Given a 1 keV photon detected in the x-ray and , a microwave background photon near the peak of the Planck function () would need to be scattered by synchrotron producing electrons at about 10 MHz. Unfortunately, the overall spectral index measurements for both sources were derived from higher frequency observations. Since the magnetic field calculation is a strong function of , the very high spectral indices would greatly affect the resultant calculations by predicting an enormous population of low energy electrons. In reality, the spectra of the radio sources are likely to flatten out at low frequencies. We therefore fit the flux densities of the two sources using only the lowest frequency data available ( MHz for these clusters) and determined and for A133 and A2626 respectively over this spectral region. Low frequency observations are far more difficult to obtain and lack the resolution acheivable in shorter wavelength data. Consequently, the spectral indicies we calculate may be contaminated by flatter spectra components of the source and therefore lead to an underestimate the IC determined magnetic field.
This calculation is also biased by the assumption that all the observed x-ray excess is due to IC scattering. Since these sources both reside at the centers of clusters of galaxies, there is a significant thermal component pervading these regions. We have attempted to remove this component (see §5), however, it is likely that a contribution from the cluster ICM may still be present. This contamination acts in the same sense as the effect above. Since the magnetic field and x-ray flux are inversely related, an artificially high would lead to an erroneously low .
7 Modeling the Jet-Cooling Flow Interaction
An alternative explanation for the observed spatial distribution of the x-ray and radio emission is the hydrodynamical interaction of jet plasma and the ambient medium which can result in x-ray surface brightness deficits and excesses (e.g., Carilli, Perley, & Harris 1994; Clarke, Harris, & Carilli 1997). In order to investigate these effects further, we have carried out two new simulations of perturbed 3D jets propagating into a cooling flow atmosphere (see e.g., Loken et al. 1993 for similar simulations in 2D).
The simulations were performed using ZEUS-3D (Stone & Norman 1992), a three-dimensional MHD code maintained by the Laboratory for Computational Astrophysics at NCSA . The computational volume is a quadrant from a sphere (2.0 kpc 25.0 kpc, and ) with 460 uniform zones in the radial direction and 110 zones in each of the and directions, concentrated along the jet axis. In both simulations, the jet is injected at the center of the inner boundary (R=2kpc, ) with a radius of 0.25 kpc. The jet density is ten times less than that of the cooling flow atmosphere (at the inlet) and it is pressure-matched with the ambient medium. The grid was initialized with the density, temperature and velocity profile corresponding to a spherically-symmetric, steady-state cooling flow obtained by integrating the standard, 1D, steady-state cooling flow equations (e.g., White & Sarazin 1987). These equations were integrated inward from the cooling radius () assuming a temperature K (3.4 keV) and a mass inflow rate, , at . The resultant profiles for the atmosphere are shown in Fig. 5. Note that these simulations make use of simplified initial conditions and limited physics and thus are not intended to model a specific source. Nevertheless, the results exhibit features which aid in the interpretation of our data.
In our first simulation, a jet with internal Mach number Mj=5 propagates onto the grid and disrupts at R 5kpc due to the applied perturbation. The density distribution along the jet mid-plane is shown in Fig. 6 at the final epoch (t=1.1 years). At this point, the jet has completely disrupted and its advance has essentially stopped. A large, turbulent lobe of processed jet material fills much of the central region of the image (). In order to construct an x-ray residual map akin to our observational results, we calculated the Raymond-Smith emission in the (0.1-2.4) keV bandpass for every zone in the simulation at the final epoch after subtracting the emission due to the initial cooling flow atmosphere. This residual x-ray emission was then summed along the line of sight to produce Fig. 7, assuming the jet to be at the same redshift as A133. Notice that the bow-shock surrounding the jet is clearly delineated in this image and that enhanced emission is apparent from much of the cocoon region. Interestingly, there is a hole, or deficit, in the emission along lines of sight passing through the disrupted jet lobe. A more quantitative interpretation of the x-ray deficits and excesses can be obtained from the slices across the x-ray image which are shown in Fig. 8. Each slice shows the x-ray surface brightness profiles at the final epoch (solid line) and from the initial, steady-state cooling flow atmosphere (dotted line). The first slice is taken just above the jet and thus shows no difference between the original and final epochs. Panel (b) shows an x-ray excess from the leading edge of the bow shock. The remaining cuts again show excesses from the bow-shock region but deficits along the jet axis are also apparent.
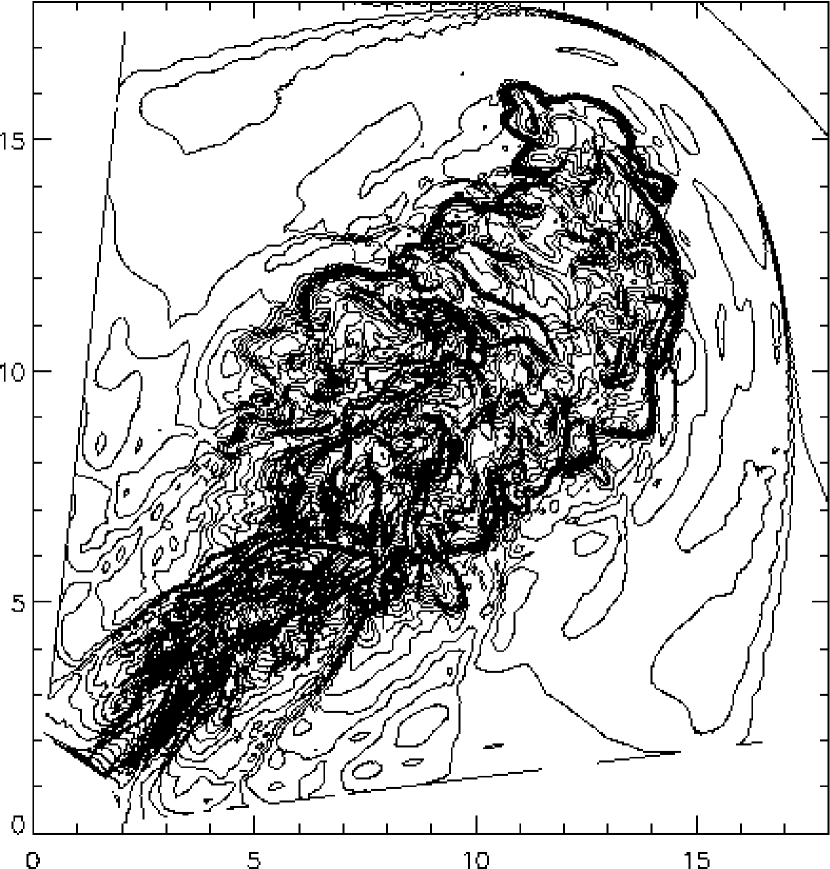
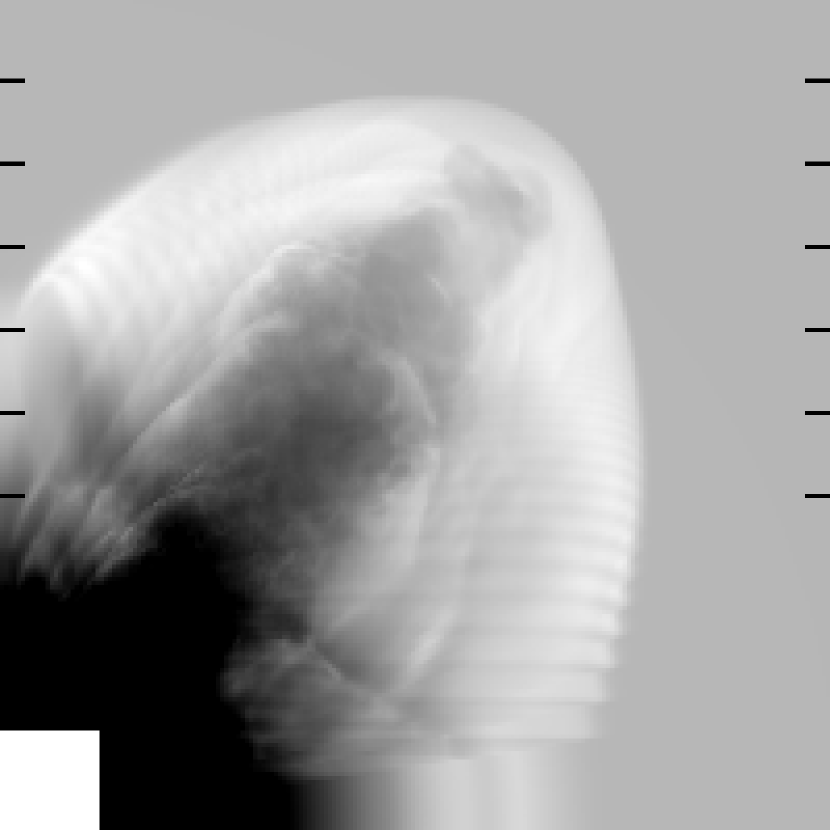
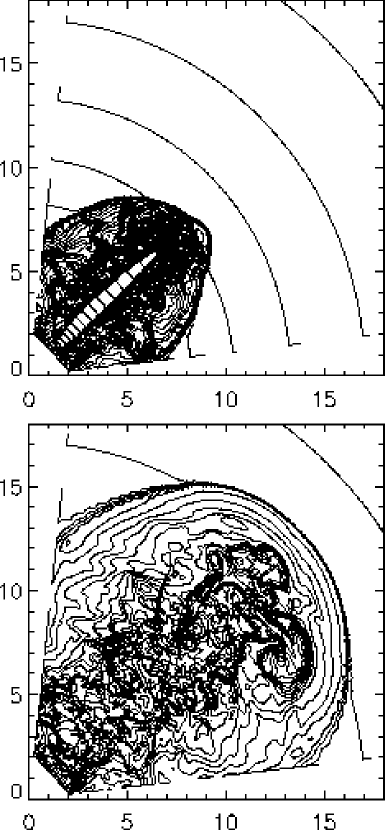
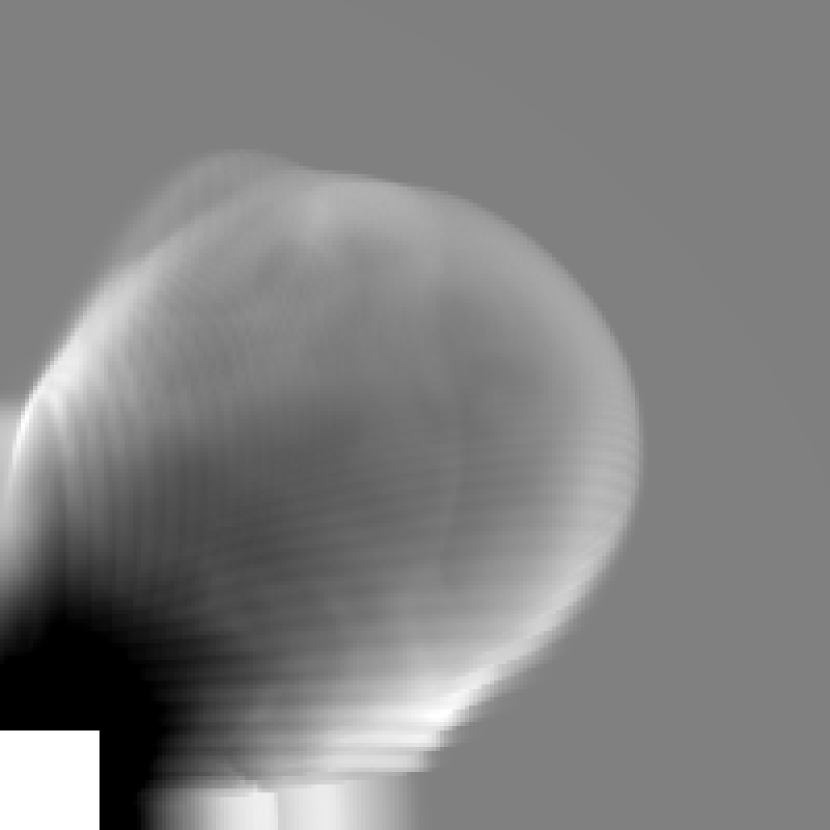
The second simulation utilizes the same set-up and parameters as the first except that the jet Mach number in substantially increased (Mj=20) and the inflow at the inlet is turned off 2.2 Myrs before the final epoch. Fig. 9 shows density contours for the jet just before it is turned off and at the final epoch. Despite the fact that there is no new momentum or kinetic energy injected after the epoch shown in the top panel, the jet and its bow-shock continue to propagate outward under their residual momentum. At the final epoch shown, the outward motion has almost completely ceased and the jet remnant (the material within the contact discontinuity delineated by the closely-spaced contours) is collapsing inward on itself since there is no energy input to counteract the high-pressure of the surrounding cocoon. The residual x-ray image for the final epoch is shown in Fig. 10. Clearly, turning-off the jet has resulted in obvious differences from the case shown in Fig. 7. Though this jet is initially more powerful, there is currently no source of kinetic energy to power the strong, multiple bow-shocks so evident in Fig. 7. In addition, the remnant of the jet itself is denser than it would be if the jet had not been turned off, making it difficult to trace the jet via the x-ray deficit as in Fig. 7. As before, there is still enhanced emission visible from the edges of the bow-shock and some deficits inside the cocoon region (primarily near the inlet).
No magnetic fields or relativistic particles were included in the numerical simulations so we cannot make detailed predictions of the resultant radio morphologies. Nonetheless, it is likely that radio emission is limited to the regions containing jet plasma (i.e. within the contact discontinuity separating cocoon material from shocked ambient) unless there has been substantial diffusion. In the case of the Mj=5 simulation, this would imply that the radio emission is spatially coincident with x-ray deficits and surrounded by regions of x-ray excess.
8 Discussion
Observationally, we see rather compelling evidence of an interaction between the hot, x-ray emitting intracluster medium and the radio plasma from the central, steep spectrum radio sources in three cooling flow clusters. This evidence is apparent in the presence of substructure as measured through the x-ray emission weighted centroid shifts and the spatial coincidence (or anti-coincidence in the case of A2052) of the x-ray excesses and the steep spectrum component of the radio sources. Although no attempt has been made to specifically model any of the three sources, the numerical jet/lobe simulations reproduce a number of the observational features. In particular, x-ray excesses are visible from regions where the gas has been compressed and heated by the passage of the jet bow shock.
The slices of the projected surface brightness distribution across the bow shock of the jet (Fig.8) exhibit x-ray excesses on the order of those detected observationally for both A133 ( ) and A2626 ( ). The excess emission associated with A2052 is slightly higher than the other two ( ), yet still within an order of magnitude. One can imagine a scenario where the bow shock of the propagating jet compresses and heats the ambient medium as it passes through the cluster core, before the jet eventually disrupts. The increased density, , and temperature, , caused by the shock boosts the x-ray emissivity, , from that region () which is manifested in an increase in the surface brightness. A similar situation is believed to exist along the lobe edges in Cygnus-A, where shocked material has increased in density and emissivity (Carilli, Perley & Harris 1994).
The unusual morphology of A133 and A2626 suggest that the jets have significantly disrupted and the shocked, diffuse plasma has spilled over, perhaps abutting the compressed emission from the original bow shock. This scenario is supported by the very steep spectrum of the diffuse structure, which suggests that the extended region of the source is surrounded and confined by the dense ICM preventing the loss of energy through expansion and leading to the steepening of the source’s spectrum. From simple pressure arguments, one can show that the radio sources in A133 and A2626 are indeed under pressured. Using the densities determined through x-ray deprojection and a central temperature of about K ( keV) results in thermal pressures () which are about 2 orders of magnitude higher () than the magnetic pressures () computed from equipartition (see Table 3).
The observational characteristics of A2052 are somewhat more complicated. This radio source, 3C317, exhibits a very bright core and diffuse outer halo, but no jets resolved at the level. Zhao et al. (1993) suggest that the radio source was disrupted at a very early stage due to interaction with the cooling flow environment at the core of the cluster. The x-ray excess seen in the HRI data surrounds roughly half of the diffuse halo. This emission is again presumably a signature of material compressed by the initial bow shock and/or from inflowing material which is compressed upon contact with the hot, diffuse gas from the disrupted jet in the central regions. For this cluster, the equipartition field (G), yields comparable thermal and minimum energy pressures for the diffuse halo (Zhao et al. (1993)).
Along with x-ray excesses, the numerical simulations also produce x-ray deficits along lines of sight passing through the region where the disrupted jet has displaced the original ICM. However, strong x-ray deficits (as in Fig. 7) are not seen in any of our observed sources. It is possible that the viewing geometry could hide these deficits but even when the Mj=5 jet is viewed head-on, the x-ray residual map shows a significant hole along the jet axis surrounded by rings of x-ray excesses. This is perhaps not surprising as in this case there will be lines of sight with even longer path lengths through the disrupted jet material than in the projection of Fig. 7. Another possible explanation for this discrepancy between the Mj=5 simulation and our observed sources is that no distinction has been made between thermal and non-thermal plasma in the code. This essentially results in a synthetic x-ray image with a filling factor of 1 for the relativistic plasma, thereby maximizing the depth of the x-ray deficits. A smaller assumed filling factor would reduce the spatial extent and depth of the deficits, perhaps removing them entirely. However, we note that, similar to Fig. 7, there are sources where deficits appear to be coincident with radio emission. For example, the outer radio lobes of 3C84 in NGC 1275 correspond to minima in the x-ray surface brightness suggesting that the relativistic jet plasma has displaced all the thermal gas (Bohringer et al. 1993). Furthermore, the factor of 2 difference in x-ray surface brightness between the radio lobes and the surrounding regions in NGC 1275 is similar to that seen in Fig. 8. Lastly, the lack of observed x-ray deficits may be an artifact of the necessarily imprecise subtraction of the spherical cooling flow atmosphere. Only in the case of the simulation do we know the exact model for the underlying cluster emission to be used in creating the residual map.
The jet which has been turned off (Figs. 9 and 10) perhaps most closely resembles our observed sources. This simulation still exhibits x-ray excesses along the bow shock (and therefore surrounding the radio emission) but the deficits along the jet are much less pronounced. Of course, some of the differences between our simulated and observed sources may be due to our assumption of an initially symmetric cooling flow atmosphere. In at least the case of A133, it is possible that a dense knot of gas to the north of the cluster center is responsible for both deflecting/disrupting the jet and for creating the x-ray excess. In such a case, the jet may not be able to displace much of the ambient medium so no deficit would be apparent.
We compare the energies associated with the jets and the cooling flow atmosphere in our simulations. The total X-ray luminosity of the initial atmosphere on the computational grid with 2 kpc R10 kpc is erg/s (this doubles for the region within 20 kpc). This is virtually identical to the kinetic luminosity of the Mj=5 jet ( erg/s) but substantially less than the kinetic luminosity of erg/s for the Mj=20 jet (before it is turned-off). In both cases, the cooling time in the atmosphere (initially yrs at the inner boundary) is much longer than the total time for which the simulation was run. This implies that, while it is on, the Mj=20 jet is a net source of energy (for the region within kpc) and that the Mj=5 jet pumps roughly as much energy into the surrounding medium as the cooling flow loses via thermal emission.
These results on the energetics of the sources are consistent with the recent interpretation of the interplay between the cooling flow and central radio source in M87 (Owen, Eilek & Kassim, 1999). Under this scenario, the radio source imparts a significant amount of energy into the core region of the cluster during its very active stage, disrupting the cooling flow and even developing a central “heating flow.” As the radio source ages, it has less of an impact energetically on the surrounding cluster environment and the cooling flow is able to re-establishes itself. The x-ray surface brightness irregularities in the aged, steep spectrum sources presented here may be evidence of that energy transfer between the radio source and cluster environment at earlier epochs of the radio source lifetimes.
Adopting the secondary hypothesis that the x-ray excesses are non-thermal in origin, estimates of the magnetic fields in the radio sources can be determined through an assumption of the inverse Compton scattering processes. This analysis yields values of and for A133 and A2626 respectively. These values are considerably lower than the equipartition results, implying that it is unlikely the excess x-ray emission is predominantly non-thermal in origin. However, the striking projected spatial coincidence between the x-ray excesses and steep spectra radio sources, along with the caveats stated in §6 make it difficult to entirely eliminate an IC contribution. The implication of a possible IC detection is quite interesting in its own right. Although a significant body of work has focused on the models and energetics of radio sources, definitive results are often plagued by assumptions required for uncertain quantities such as the magnetic fields. Inverse Compton scattering provides a much desired, direct measure of the magnetic fields within extragalactic radio sources. To date, observations of this phenomena have only been claimed in a handful of cases (e.g. Feigelson et al. 1995; Kaneda et al. 1995; Bagchi, Pislar & Lima Neto 1998) so additional confirmed cases of IC scattering would certainly be of interest. Currently the data does not allow a clear distinction to be made between the thermal and non-thermal contributions to the excess x-ray emission. However, with the spatial and spectroscopic capabilities of AXAF and XMM, it should be possible to accurately determine the relative significance of each model.
References
- Arnaud (1988) Arnaud, K. 1988, in Cooling Flows in Clusters and Galaxies, edited by A.C. Fabian (Cambridge), p.31
- Bagchi (1998) Bagchi, J., Pislar, V., & Lima Neto, G.B. 1998, MNRAS, 296, L23
- Bliton (1998) Bliton, M., Rizza, E., Burns, J.O., Owen, F.N., Ledlow, M.J. 1998, MNRAS, 301, 609
- Böhringer et al. (1995) Böhringer, H., Nulsen. P.E.J., Braun, R., Fabian, A.C. 1995, MNRAS, 274, L67
- Böhringer et al. (1993) Böhringer, H., Voges, W., Fabian, A.C., Edge, A.C., & Neumann, D.M. 1993, MNRAS, 264, L25
- (6) Buote & Canizares 1994, ApJ, 427, 86
- Burns (1996) Burns, J.O. 1996, in Energy Transport in Radio Galaxies and Quasars, edited by P.E. Hardee, A.H. Bridle. & J.A. Zensus (San Francisco), p. 341)
- Burns et al. (1997) Burns, J.O., Loken, C., Gomez, P., Rizza, E., Bliton, M., Ledlow, M. 1997, in Galactic Cluster Cooling Flows, edited by Soker, p. 21
- Burns (1990) Burns, J.O. 1990, AJ, 99,14
- Carilli, Perley & Harris (1994) Carilli, Perley & Harris 1994, MNRAS, 270, 173
- Clarke et al. (1997) Clarke, D.A., Harris, D.E., Carilli, C.L. 1997, MNRAS, 284, 981
- Feigelson (1995) Feigelson, S.A., Laurent-Muehleison, Kollgaard, R.L., Fomalont, E.B. 1995, ApJ, 449, L149
- Ge & Owen (1994) Ge, J., & Owen, F.N. 1994, AJ, 108, 1523
- Gomez et al. (1997) Gomez, P.L., Pinkney, J., Burns, J.O., Wang, Q., Owen, F.N., Voges, W. 1997, ApJ, 474, 580
- Harris & Grindlay (1979) Harris, D.E., Grindlay, J.E. 1979, MNRAS, 188, 25
- Heckman etal (1989) Heckman, T., Baum, S., van Bruegel, W., & McCarthy, P. 1989, ApJ, 338, 48
- Kaneda (453) Kaneda, H., et al. 1995, ApJ, 453, L13
- Komissarov & Gubanov (1994) Komissarov , S.S., Gubanov, A.G. 1994, A&A, 285, 27
- (19) Ledlow, M.J. & Owen, F.N. 1995, AJ, 109, 853
- Loken et al. (1993) Loken, C., Burns,J.O., Norman, M., Clarke, D. 1993, ApJ, 417, 515
- Mohr etal (1995) Mohr J., Evrard A., Fabricant D., Geller M., 1995, ApJ, 447, 8
- (22) Mohr J., Geller, M.J., & Wegner, G 1996, AJ, 112, 1816
- (23) Owen, F.N., Eilek, G. & Kassim, N.E. 1998, in preparation
- Owen & Eilek (1998) Owen, F.N., Eilek, G. 1998, ApJ, 493, 73
- Owen, Ledlow & Keel (1995) Owen, F.N., Ledlow, M.J., Keel, W.C. 1995, AJ, 109, 140
- Pinkney (1995) Pinkney, J. 1995, PhDT
- Pacholczyk (1970) Pacholczyk, A.G. 1970, Radio Astrophysics (San Francisco: Freeman)
- Slee & Reynolds (1984) Slee, O.B., & Reynolds, J.E. 1984, ASA, 5, 516
- (29) Stone, J.M., Norman, M.L. 1992, ApJS, 80, 791
- White, Jones, & Forman (1997) White, D.A., Jones, C., Forman, W. 1997, MNRAS, 292, 419
- White & Sarazin (1987) White, D.A., Sarazin, C.L. 1987, ApJ, 320, 32
- Zhao et al. (1993) Zhao, J.-H., Sumi, D.M., Burns, J.O., Duric, N. 1993, ApJ, 416, 51
| Cluster | Observation date | Array | Exposure time | Frequency | Bandwidth | SaaTotal flux densities from Ledlow & Owen (1995) | |
|---|---|---|---|---|---|---|---|
| Abell/IAU (1950) | (Jy) | (GHz) | (MHz) | (mJy) | |||
| A0133 (0100-221A) | 1993 May 4 | B | 21:20 | 104 | 1.4 | 50 | 138 |
| A0133 (0100-221A) | 1993 July 15 | C | 31:40 | 104 | 1.4 | 50 | 138 |
| A2626 (2333+208) | 1993 July 15 | C | 34:00 | 52 | 1.4 | 3 | 55 |
| Cluster | RA(1950) | DEC(1950) | Sequence Number | Live time | |
|---|---|---|---|---|---|
| A0133 | 01:00:09.3 | -22:02:55 | rh800428a01 | 9900 | 0.0573 |
| A0133 | rh800428a02 | 12425 | |||
| A0133 | rh800428n00 | 9050 | |||
| A0133 | rp800319 | 15380 | |||
| A2052 | 15:14:15.7 | 07:12:11 | rh800223a01 | 808 | 0.0348 |
| A2052 | rh800223a02 | 3835 | |||
| A2052 | rh800223n00 | 4385 | |||
| A2052 | rp800275n00 | 6008 | |||
| A2626 | 23:34:00.2 | 20:52:24 | rh800430a01 | 21468 | 0.0604 |
| A2626 | rh800430n00 | 6168 |
| Cluster | |||||
|---|---|---|---|---|---|
| ergs | ergs | ||||
| A0133 | 0.90aaSpectral index over range 30-160 MHz. | 0.02 | 2.6 | ||
| A2626 | 1.33bbSpectral index over range 38-178MHz | 0.3 | 1.6 |