The optical counterpart of SAX J1808.4–3658, the transient bursting millisecond X-ray pulsar
Abstract
A set of CCD images have been obtained during the decline of the X-ray transient SAX J1808.4–3658 during April–June 1998. The optical counterpart has been confirmed by several pieces of evidence. The optical flux shows a modulation on several nights which is consistent with the established X-ray binary orbit period of 2 hours. This optical variability is roughly in antiphase with the weak X-ray modulation. The source mean magnitude of V=16.7 on April 18 declined rapidly after April 22. From May 2 onwards the magnitude was more constant at around V=18.45 but by June 27 was below our sensitivity limit. The optical decline precedes the rapid second phase of the X-ray decrease by days. The source has been identified on a 1974 UK Schmidt plate at an estimated magnitude of 20. The nature of the optical companion is discussed.
keywords:
binaries: close – stars: neutron – stars: SAX J1808.4-3658 – X-rays: stars.1 Introduction
The X-ray transient SAX J1808.4–3658 was first detected by the Wide Field Camera (WFC) on the BeppoSAX X-ray satellite in September 1996 (in ’t Zand et al. 1998). It was detectable for a period of 20 days but had not been visible during an earlier long exposure of the same region in August 1996. Recently the Proportional Counter Array (PCA) experiment on the Rossi X-ray Timing Explorer (RXTE) satellite detected a transient (XTE J1808–369) in the same general location during a routine scan between targets. A series of Target Of Opportunity (TOO) observations with RXTE refined the error box and indicated it was probably a repeat occurrence of the earlier SAX transient outburst (Marshall 1998). The PCA data also revealed a high frequency signal at 400 Hz with a modulation of 4.3 per cent rms in the 2–60 keV band (Wijnands & van der Klis 1998a,b). This is the first X-ray source to show coherent millisecond periodicity in its persistent emission. Further analysis of the PCA data showed this signal to be modulated with a sinusoidal doppler shift about a mean frequency of 400.9752106 Hz indicating a binary period of 7249.119 seconds (Chakrabarty & Morgan 1998a,b). The X-ray flux has a weak modulation of 2 per cent with a broad minimum when the neutron star is behind the companion. The mass estimates for the companion suggest a very low value of probably 0.1 M (Chakrabarty & Morgan 1998b). The X-ray flux from SAX J1808.4–3658 peaked close to April 11, just after the commencement of the RXTE series of observations. A relatively rapid X-ray decline after April 25 has been reported by Gilfanov, Revnivtsev & Sunyaev (1998a) and Gilfanov et al. (1998b). At higher energies the High Energy X-ray Timing Experiment (HEXTE) on RXTE found the source to be one of the hardest known X-ray pulsars with a power law index of and a spectrum extending to at least 120 keV (Heindl, Marsden & Blanco 1998, Heindl & Smith 1998).
Roche et al. (1998) reported a probable optical counterpart with a magnitude of V=16.6 that was not on an earlier UK Schmidt Digitised Sky Survey plate dating from 1987. We had also commenced optical photometry of the X-ray error box and were able to support the proposed identification since the candidate appeared to show a 2 hour V band modulation of 0.12 magnitudes peak to peak (Giles, Hill & Greenhill 1998). The V band intensity decreased by 0.1 magnitudes over the 4 day period from April 18–22 further supporting the identification (Giles et al. 1998). The orbital doppler solution derived by Chakrabarty & Morgan (1998a,b) is of sufficient precision to define a relatively small error box which also includes the candidate star. The assertion that the companion was a low mass star was supported by optical spectra obtained by Filippenko & Leonard (1998). Their spectra revealed absorption lines throughout the spectrum which are characteristic of mid to late type stars. They also reported a possible broad emission line. A compilation of these other optical studies can be found in Chakrabarty et al. (1998c).
2 Observations
All the observations described in this paper were made using the Mt. Canopus 1-m telescope at the University of Tasmania observatory. This telescope has been making CCD observations of micro lensing events for several years as part of the PLANET consortium. A new CCD camera has been installed and the data obtained on 1998 April 18 are ”first light” observations. The SITe CCD chip is a thinned back illuminated device with a pixel size of 24 x 24 microns. The chip has 512 x 512 pixels with an image scale of pixel-1. Standard V & I filters (Bessell 1990) were used for the observations reported here. The CCD chip is driven by a Leach SDSU controller running under the CICADA software suite developed by the Mt. Stromlo and Siding Spring Observatories. The individual CCD images have been reduced using MIDAS software running under LINUX on a PC. The data values in Table 1 and Fig. 1 were derived using the crowded field photometry program DoPHOT to establish differential magnitudes between the candidate star and local secondary standards. Our best CCD frames were used to build a ”fixed position” template for DoPHOT to fit an analytic point spread function to the stellar images. This method has been found to be superior when dealing with poor or variable seeing.
We have followed the object from the date on which a small X-ray error box was announced (April 15) by Marshall et al. (1998) until late June. A journal of the observations is given in Table 1. The seeing on April 22 (HJD 2450926) was poor (3- 4) and the observations on April 27 (HJD 2450931) were affected at times by thin cloud. When the source became fainter various program constraints on telescope time only allowed occasional exposures at a few wavelengths. Since the proposed optical candidate was not visible at an earlier epoch (Roche et al. 1998) we expected the star to fade from view and this eventually proved to be the case. The complete data set from April 18 to June 27 forms the subject of this paper.
| HJD | V mag. | HJD | I mag. |
|---|---|---|---|
| 922.20473 | 922.19330 | ||
| 926.22798 | 931.24646 | ||
| 931.16728 | 933.25167 | ||
| 933.24373 | 933.26705 | ||
| 933.26326 | 936.20005 | ||
| 936.20443 | 938.19292 | ||
| 936.20814 | 939.16966 | ||
| 938.17917 | 950.17325 | ||
| 938.18353 | 950.99307 | ||
| 939.17961 | 951.00449 | ||
| 939.27461 | |||
| 950.17826 | |||
| 951.01020 | |||
| 992.21600 |
The above HJD -2450000 times are the mid points of the typically 300 second integration intervals. The first 3 values in the V magnitude column are averages for each of the 3 data sets shown in Fig. 1.

2.1 Temporal variability
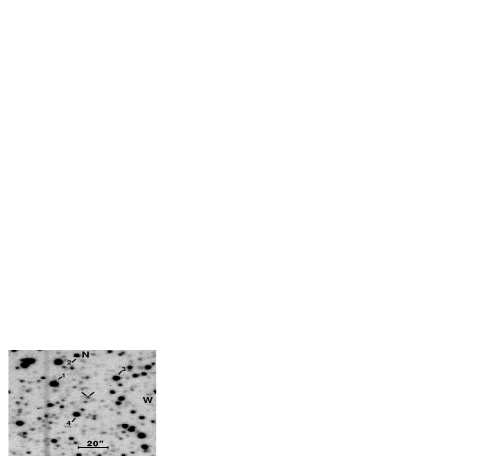
The data were calibrated by observations of a sequence of standard stars in Area Number 107 of Plate 57 (Landolt 1992). These were used to derive the magnitudes of four local secondary standards that were near to SAX J1808.4–3658 and within the CCD frame. These local standards are marked on the finder chart in Fig. 2. Our derived V magnitudes for stars 1-4 are 14.57, 16.13, 15.21 & 15.30 all 0.03. The corresponding four I magnitudes are 13.06, 15.20, 14.32 & 13.70 all 0.025. The magnitudes for SAX J1808.4–3658, shown in Table 1 and plotted in the upper section of each panel in Fig. 1, were obtained using differential magnitudes relative to local standard star number 1. We present first the overall light curve decay and then the detailed light curves available for the first three nights. We also make some comments on the longer term variability.
2.1.1 The optical and X-ray light curves
We have used the V & I band data in Table 1 to produce the V & V–I light curves shown in Fig. 3. The two intensities decreased in step with each other with no convincing evidence for colour change. The average uncorrected for reddening V–I value is 0.57 magnitudes The optical decline appears to have occurred mainly between April 22 and May 2. After this time the source remained roughly constant at around V=18.45 and I=17.86 for several weeks. On June 27 the source was below our sensitivity limit implying a V magnitude of less than 20.5. This last observation is not included in Fig. 3.
The RXTE satellite made a series of 21 public TOO observations of SAX J1808.4–3658, the first occurring on April 11 and the last on May 6. In Fig. 3 we also plot the mean X-ray fluxes reported by Gilfanov et al. (1998b) and the two lines they obtain (see their Fig. 3) by treating the X-ray intensity profile as having two seperate linear decay regions. Our optical measurements commenced near the end of their first decay section since the peak X-ray intensity occurred around April 11 (HJD 2450915.30). There is no X-ray intensity information to relate to the observed optical plateau after the last RXTE pointing on May 6 (HJD 2450939.95). In Fig. 3 the optical flux decline appears to precede the steep second part of the X-ray decline by days.

2.1.2 The 2 hour binary modulation
We have plotted the light curves shown in Fig. 1 for the three nights of April 18, 22 & 27 when data frames were obtained in continuous sequential fashion. The times have all been converted to Heliocentric Julian Date (HJD). Since our observations show the source decaying in intensity and its amplitude diminishing it is problematic how best to deal with the three short data sets. A sine type modulation had been evident in the April 22 data with a peak to peak magnitude of (Giles et al. 1998). This night however had degrading seeing conditions and a re-analysis of our entire data set, using a DoPHOT template which includes nearby blended stars, has substantially degraded the evidence for this sinusoidal modulation. In principle the use of a template minimises the errors in magnitude measurement caused by star blending. The seeing was so poor during the latter half of the April 22 observations that three neighbouring stars were partially blended with SAX J1808.4–3658. Two of these are very faint and just visible in Fig. 2 to the East and Southwest of SAX J1808.4–3658. The third neighbour is the star noted by Roche et al. (1998) 5 to the South-Southeast and on April 22 SAX J1808.4–3658 was partially blended with this star but was more than a magnitude brighter. Fig. 2 is an image from April 27 when the seeing was much better than on April 22 and SAX J1808.4–3658 had faded by about a magnitude. An exhaustive analysis of the data forces the conclusion that the much clearer modulation noted by Giles et al. (1998) was caused by a fortuitous combination of experimental errors. Nevertheless the data show significant variability and are not inconsistent with the 7249.119 second sinusoidal modulation in X-rays seen by Chakrabarty & Morgan (1998b). We assume therefore that this X-ray binary period also applies to the optical data. The X-ray radial velocity ephemeris of Chakrabarty & Morgan (1998b) is represented by the dotted line in Fig. 1. with the amplitude units being arbitrary. We assume a similar modulation in the V band with peak to peak amplitude 0.12 magnitudes in antiphase with the X-ray modulatiion. This is consistent with the standard model for Low Mass X-ray Binaries (LMXBs) (van Paradijs 1983, van Paradijs & McClintock 1995) in which optical minimum occurs when the neutron star is at superior conjunction and the X-ray heated side of the companion is obscured.
The V band data and assumed underlying modulation are plotted in the middle panel of Fig. 1. In the top panel the assumed modulation has been projected back to April 18 (HJD 2450922) with the same phase and amplitude but with a 0.05 magnitude offset to match the higher observed intensity at that time. The data sequence for April 18 is too short to define the modulation but we note that the trend is correct for the phase of the assumed modulation relative to the data on April 22. On April 27 (HJD 2450931) the source was 1 magnitude fainter in V relative to April 22 and the modulation was less with a peak to peak amplitude of 0.08 magnitudes. The assumed modulation in the bottom panel of Fig 2 has been adjusted accordingly. Again the V band modulation is consistent with our assumptions.
We also plot in each panel of Fig. 1 the differences between local standard 1 and the sum of local standards 2, 3 & 4. These points are offset to an arbitary magnitude since they are only intended to indicate the relative photometric precision on each of the three nights.
2.1.3 Long term history
We have examined a UK SERC J Schmidt sky survey film copy of this field (Plate number J 663, Field name J 394, date June 20 1974) and find a definite star image that corresponds to our source position. Estimating a magnitude to compare with those in Table 1 is difficult. We have used a digital camera to image the film copy and compared SAX J1808.4–3658 with the 3 stars in Fig. 2 that are visible within . We estimate a magnitude of 20, as the image is well above the plate limit, which is suggestive of an outburst in progress during May to June 1974. Clearly the source has an interesting long term intensity history having had the two known X-ray transient events of September 1996 and April 1998. Since SAX J1808.4–3658 is present on at least one Schmidt plate from 1974, is not present on the 1987 digitised sky survey image, and has again faded below detectability, a detailed search of all the available Schmidt plates of this region would be a worthwhile exercise. The UK Schmidt catalogue lists 9 plates of this field and there are several additional ESO Schmidt plates.
2.2 Source position
As part of the photometry process the DoPHOT analysis software fits 2 dimensional power law profiles to the target and specified reference star positions. This automatically provides accurate values for the relative positions of each star centre on the CCD frame in pixel coordinates. The x CCD field contains 6 stars from the Hubble Guide Star Catalogue (GSC) (Lasker et al. 1990). We have used the CCD pixel coordinates of these stars and SAX J1808.4–3658 on the best quality V band image to derive a source position of R.A. 18h 08m Dec. (equinox J2000.0). This is 2 from the initial position estimate of Roche et al. (1998). We note that one of our 6 reference stars (GSC 7403-0236) was deleted from our list as it produced an inconsistent result in the fitting procedure. This star is the closest of the 6 to the source position but appears to have an accumulated proper motion of 3 to the South East over the 23 year interval. The CCD frame differential values are good to but the absolute position is dominated by the errors in the GSC which are up to . In Fig. 2 we provide a finder chart for SAX J1808.4–3658 constructed from a good seeing V band CCD image. The fainter star noted by Roche et al. (1998) with V 18 is 5 to the South-Southeast.
3 Discussion
At first sight SAX J1808.4–3658 looks like any other LMXB transient but it has the unique feature of having a coherent millisecond rotation frequency in its X-ray emission. The X-ray spectrum was also reported to be remarkably constant over two orders of intensity decline (Gilfanov et al. 1998a,b) though this has been questioned by Heindl and Smith (1998). The binary orbit optical modulation shown in Fig. 1 is reminiscent of a number of other LMXB’s such as 4U 1636-53 (Smale & Mukai 1988), 4U 1735-44 (Corbet et al. 1986), X1755-338 (Mason, Parmar & White 1985) and XB 1254 -690 (Motch et al. 1987). Particularly in the case of 4U 1636-53 & 4U 1735-44 a sinusoidal modulation is well shown at some times and poorly followed at others. The fragments of light curves in Fig. 1 are suggestive of the same behaviour.
Traditionally there are three regions of a LMXB system which contribute to its optical variability due to X-ray heating. These are the accretion disc itself, a bright spot on the outer edge of the accretion disc due to inflowing material and the hemisphere of the companion facing the neutron star which is not shadowed by the accretion disc. As remarked earlier the phasing of the observed optical modulation and the well defined X-ray orbital period are consistent with the established model for X-ray reprocessing on the facing hemisphere of the companion star. In most LMXBs the reprocessed X-ray optical flux dominates the the optical light from the rest of the system (van Paradijs 1983, van Paradijs & McClintock 1995), particularly in the outburst phase, and the companion itself may only be evident at a very faint level when the system is in quiescence. Various approximately linear relationships between the orbit period, outburst amplitude, absolute magnitude and distance have been derived for LMXB transients by Shahbaz & Kuulkers (1998). Although it is unclear if these relationships can be applied to such a low mass and short period system we obtain a pre-outburst magnitude of V=28.75 for SAX J1808.4–3658. These relationships also give a quiescence absolute magnitude of M(2) = 13.3 for the companion and M(disc) = 4.65. The companion peak apparent magnitude of V 16.7 implies a distance of 2.5 kpc. Given the uncertainties in the Shahbaz & Kuulkers (1998) relationships, this distance is not inconsistent with that deduced from the observation of two Type I X-ray bursts during the 1996 outburst which indicate a distance of 4 kpc (in ’t Zand et al. 1998).
The optical decline appears to precede the X-ray decline by days. This delay could be interpreted as the time taken to clear out the accretion disc round the neutron star after a sharp drop in the mass flow rate, by roche lobe overflow or stellar wind, from the companion. The delay then represents a flow transit time from the outer to the inner edge of the disc. This explanation also suggests that the disc hot spot might decrease in intensity as the general accretion rate diminishes following the main transient event. Our observations show that both the optical intensity and its modulation amplitude at the binary period decrease. The sudden and rapid X-ray decline then follows since the disc is now mostly depleted, with little remaining material available to spiral in towards the neutron star, and a low external accretion rate to replenish it. The sharp X-ray decline is conventionally expected for LMXB transients, and can be explained in terms of the closure of a centrifugal barrier at low accretion rates as the magnetosphere of a neutron star reaches its corotation radius (Campana et al. 1998). In the case of SAX J1808.4–3658 we then see a plateau in the optical flux lasting 2 weeks but there are no simultaneous X-ray observations. A final optical decline over the few weeks after this plateau is not constrained by our observations.
4 Conclusions
Our observations have established beyond doubt that the candidate proposed by Roche et al (1998) as the optical counterpart for the X-ray transient SAX J1808.4–3658 is correct. This has been demonstrated by the following key points as the proposed object:
| (i) is within the various X-ray error boxes |
| (ii) faded by more than 4 magnitudes |
| (iii) showed a substantial part of its optical fading a |
| few days prior to the large X-ray decline |
| (iv) was modulated in intensity in a manner roughly |
| consistent with the 2 hr X-ray binary period. |
Since this source was seen in an earlier transient outburst during September 1996 (in ’t Zand et al. 1998) it has most probably burst before and will do so again. The optical flux of SAX J1808.4–3658 is expected to brighten on all these occasions so further observations, particularly spectroscopy while in its brightest state, are highly desirable,
Acknowledgments
We thank K. Bolton, D. Phythian and B. Wilson of the Physics Department technical support group for their invaluable work on the CCD camera system. P. Cieslik kindly obtained some measurements between PLANET observations. We also thank T. Strohmayer of the RXTE PCA team for timely information on the occurrence of the transient.
References
- [1] Bessell, M.S., 1990, PASP, 102, 1181
- [2] Campana S., Stella L., Mereghetti S., Colpi M., Tavani M., Ricci D., Dal Fiume D., Belloni T., 1998, ApJ, 499, L65
- [3] Chakrabarty D., Morgan E.E., 1998a, IAU Circ. 6877
- [4] Chakrabarty D., Morgan E.E., 1998b, Nature, 394, 346
- [5] Chakrabarty D. et al., 1998c, ApJ, in preparation
- [6] Corbet R.H.D., Thorstensen J.R., Charles P.A., Menzies J.W., Naylor T., Smale A.P., 1986, MNRAS, 222, 15p
- [7] Filippenko A.V., Leonard D.C., 1998, IAU Circ. 6897
- [8] Giles A.B., Hill K.M., Greenhill J.G., 1998, IAU Circ. 6886
- [9] Gilfanov M., Revnivtsev M., Sunyaev R., 1998a, IAU Circ. 6897
- [10] Gilfanov M., Revnivtsev M., Sunyaev R., Churazov E., 1998b, A&A, 338, L83
- [11] Heindl W., Marsden D., Blanco P., 1998, IAU Circ. 6878
- [12] Heindl W.A., Smith D.A., 1998, ApJ, 506, L35
- [13] in ’t Zand J.J.M., Heise J., Muller J.M., Bazzano A., Cocchi M., Natalucci I., Ubertini P., 1998, A&A,, 331, L25
- [14] Landolt A.U., 1992, ApJ, 104, 340
- [15] Lasker B.M., Sturch C.R., McLean B.J., Russell J.L., Jenkner H., Shara M.M., 1990, AJ, 99, 2019
- [16] Marshall F.E, 1998, IAU Circ. 6876
- [17] Mason K.O., Parmar A.N., White N.E., 1985, MNRAS, 216, 1033
- [18] Motch C., Pedersen H., Beuermann K., Pakull M.W., Courvoisier T.J.L., 1987, ApJ, 313, 792
- [19] Roche P., Chakrabarty D., Morales-Rueda L., Hynes R., Slivan S.M., Simpson C., Hewett P., 1998, IAU Circ. 6885
- [20] Shahbaz T., Kuulkers E., 1998, MNRAS, 295, L1
- [21] Smale A.P., Mukai K., 1988, MNRAS, 231, 663
- [22] van Paradijs J., 1983, in Lewin W.H.G., van den Heuval E.P.J., eds, Accretion-driven Stellar X-ray Sources, Cambridge University Press, Cambridge, p. 191
- [23] van Paradijs J., McClintock J.E., 1995, in Lewin W.H.G., van Paradijs J., van den Heuval E.P.J., eds, X-ray Binaries. Cambridge University Press, Cambridge, p. 58
- [24] Wijnands R., van der Klis M., 1998a, IAU Circ. 6876
- [25] Wijnands R., van der Klis M., 1998b, Nature, 394, 344