Simulations Applied to the Bright SHARC XCLF: Results and Implications
Abstract
We have performed simulations of the effectiveness of the Serendipitous High-redshift Archival ROSAT Cluster (SHARC) survey for various model universes. We find, in agreement with work based on a preliminary set of simulations (Nichol et al., 1999), no statistically significant evolution of the luminosity function out to z = 0.8.
Northwestern University, (+LAS C. Adami)
Carnegie Mellon University
University of Chicago
1. Introduction
The interest in the X-ray Cluster Luminosity Function (XCLF) has been heightened in recent years with the realization that a measure of its evolution with redshift could be used to derive the value of the cosmological parameter (cf. Nichol et al., 1999, Oukbir Blanchard, 1997). The conclusions drawn from this type of analysis are, however, extremely model dependent, and observational difficulties aside, it may be a long time before a consensus is reached as to the value of (cf. Reichart et al. 1999, Bahcall et al. 1997). Simply understanding the origin and evolution of clusters of galaxies is interesting itself, however, and a measure of the evolution of the XCLF provide insights into the process of cluster formation. As we will describe below, it is interesting to note that, although there is no statistically significant evidence in our Bright SHARC survey for evolution of the XCLF out to a z = 0.8, there is a great deal of evidence that the X-ray emission (and other properties of clusters) are continually evolving. Therefore, some how clusters evolve, but manage to keep the total luminosity function relatively constant. The process that could do this is hierarchical clustering (cf. Doroshkevich et al. 1998) in which smaller X-ray fainter clusters evolve into larger, X-ray brighter clusters, in just such a way so as to keep the XCLF approximately constant with redshift. The conclusion then is that the most likely portion of the XCLF to detect evolution is at the bright end where the hierarchical coalescence requires the most amount of time to form such large structures. Below, we begin by giving just one example of cluster evolution. Then we describe the results of our simulations and the impact of the SHARC derivation of the luminosity function for . Next, we discuss how these assumptions that are included in the simulations affect the conclusions that can be drawn about evolution. Finally, we demonstrate that not only is better sky coverage needed to improve statistics, but the evolution of the shape of the emission profiles is also going to be necessary before the true completeness of a survey can be accurately determined.
2. Cluster Evolution
There are many pieces of evidence that clusters are continually forming and evolving, but one of the earliest was the surprising discovery that the intra-cluster medium in the Perseus cluster is cooler in the core region (Ulmer & Jernigan, 1978). In fact, one of the explanations that Ulmer and Jernigan gave for this result was that the denser material in the core had cooled faster due to the cooling time being related to the density of the material. This first discovery is often ignored, yet this was the discovery of what now seems to be the nearly ubiquitous phenomenon called “cooling flows” (cf. Peres al., 1998).
3. The Simulations
A key to any survey is to understand how effective the survey was at detecting objects. Without this understanding, the detected number of objects cannot be converted into a “true” number. The so-called “Bright SHARC” survey and been described in detail by Romer et al. (1999). A preliminary measure of the XCLF derived from the results of Romer et al. was reported by Nichol et al.(1999). Full details of our simulations can be found in Adami et al.(1999).
3.1. The Simulation Procedure
The simulation program produced fake clusters which were placed on real ROSAT data sets that were used for analysis. The fake clusters were systematically placed within different annuli (but randomly other wise) in the ROSAT PSPC field of view. The data set we used was a statistically complete sampling of the data set that actually was used for analysis and which included all ROSAT pointing with galactic lat. greater than and data within the region between and of the center of the field of view (FOV) of the ROSAT PSPC. These data sets were then put through the standard SHARC processing pipeline and extended sources were identified in the standard manner. If a fake cluster was found as an extended X-ray source, then the cluster was counted as “detected.” We also kept track of the apparent luminosity of the cluster to determine how much the cluster luminosity differed from the true (input) luminosity.
3.2. The Results
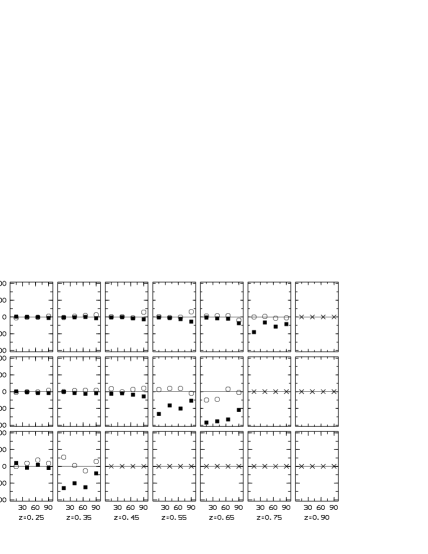
In Figure 1, we show two results. In the left-most panel, we show the detection efficiency as a function of redshift and radial distance from the center of the ROSAT PSPC FOV. We can see the effects of the degradation of the angular resolution in that clusters are less easily found in the outer portions of the FOV. We also see that the detection efficiency falls off with increasing redshift, as expected. At redshifts , we see some apparent detections at low luminosity, but a comparison with the right most figure reveals the cause: confusion. The right-most panel shows that the apparent luminosity of these objects is much higher than the true luminosity which can only mean that the fake cluster in our simulation landed close enough to a real object to have been mistakenly classified as a “detection.” This turns out to be negligible effect, however, as the overall detection efficiency rate is small (usually less that 5%). This shows, however, the importance of optical follow up and rigorous identification before an “extended source” can be truly identified as an X-ray bright cluster. We also see in Figure 1 that, generally, the luminosity was well determined by our process except in cases where the detection rate is so small that in real life (as opposed to our simulations) they were easily removed from our sample by optical followup. These results are all for a standard set of parameters for the cluster profile, temperature, and cosmology (see Nichol et al. 1999).
We next show in Figure 2 one effect of modifying the shape of the cluster emission profile. We see that it is much easier to detect clusters if their X-ray emission profile is the Navarro, Frenk and White (1997; NFW) model and that cooling flows do not have much effect. Also, at the highest redshifts, but not shown in a figure here, clusters which are more elliptical than the average are more easily detected. These two points demonstrate: (1) that knowledge of shapes of the cluster emission at high redshift is extremely important for correcting for survey incompleteness; and, (2) that highly elliptical clusters are more easily detected than the average, so that this may explain in part why only clusters that appear to be highly elliptical have been detected at high redshift. For even Lx erg cm-2 s-1 clusters at are apparently quite faint. Keeping the total number of photons emitted constant, but confining the emission region to a more highly elliptical shape means the cluster has an intrinsically higher surface brightness and is, hence, easier to detect. For brevity, we do not show many of the other cases we tested, but the effect of the assumed cosmology on the assumed detection efficiency is shown in Figure 3, which is discussed below.
4. The Simulations Applied To The Bright SHARC Sample
In Figure 3 we show the results of applying the derived efficiency of detection to the Bright SHARC sample. There are several comparisons to be made within this figure. First there is the comparison between the standard model result and the preliminary result of Nichol et al. Here we see the new, refined result does not differ in a statistically significant manner from the Nichol et al. work. Second, we see that the effect of assuming different cosmologies is negligible within the statistical uncertainty. Third we see that the statistical uncertainty in the number of clusters in the highest luminosity bin is so large because these clusters are so rare and that a much larger survey than the Bright SHARC is needed to determine if there is any discernible evolution in the highest luminosity bin. Fourth, when we compare with local XCLF, we see there is no statistically significant evidence for evolution of the XCLF as a whole and that these results are qualitatively consistent with the scenario for hierarchical cluster formation discussed in the introduction.

Follow up work requires both much larger and deeper surveys.
Acknowledgments.
We thank the IGRAP meeting organizators and support in part by NASA grant NAG5-2432 and by NASA Illinois space grant
References
Adami C., et al., 1999, ApJ submitted
Bahcall N.A., et al., 1997, ApJ 485, L53
Doroshkevich A.G., Fong R., Makarova O., 1998, AA 329, 14
Ebeling H., et al., 1997, ApJ 479, L101
de Grandi S., et al., 1999, ApJ 513, L17
Navarro J.F., Frenk C.S., White S.D.M., 1997, ApJ 490, 493
Nichol R.C., et al., 1999, ApJ 521, L21
Oukbir J., Blanchard A., 1997, AA 317, 1
Peres C. B., et al., 1998, MNRAS 298, 416
Reichart D.E., et al., 1999, ApJ 518, 521
Romer A.K., et al., 1999, ApJS in press, astro-ph: 9907401: R99
Ulmer M. P., Jernigan J. G., 1998, ApJ 222, L85