A homogeneous study of the s-process in the 21 m carbon-rich post-AGB objects. ††thanks: based on observations collected at the European Southern Observatory in Chile (61.E-0426), and at Roque de los Muchachos at La Palma Spain
Abstract
We present in this paper a homogeneous photospheric abundance study, on the basis of the analysis of high resolution optical spectra, of six post-AGB objects displaying a 21m circumstellar dust feature in their IR spectrum. The F-G spectral type of the 21m stars make that a large range of elements including a wide variety of s-process elements, can be studied by their atomic lines. The high C/O-ratios together with the large overabundance of s-process elements prove that the objects are descendants of field carbon stars. We discuss in detail the s-process abundance distribution displayed by these 21m stars and conclude that the 3rd dredge-up efficiency is closely related to the strength of the integrated neutron irradiation. The expected anti-correlation of the neutron irradiation with metallicity, on the other hand, contains a large intrinsic scatter. Finally we compare our results with other intrinsic and extrinsic s-process enriched objects and conclude that the post-AGB stars offer very useful complementary data to constrain the evolutionary models of AGB nucleosynthesis and dredge-up processes.
Key Words.:
Stars: abundances; carbon; evolution; AGB and post-AGB1 Introduction
A sub-class of post-AGB objects display in their IR spectrum an emission feature at 21m, first identified on IRAS LRS spectra by Kwok et al. (1989). It was realised that the feature only occurs in spectra of C-rich post-AGB stars as evidenced by the presence of PAH-emission in the mid-IR spectra and often strong HCN measurements. The carrier(s) of the 21m feature is (are) still unidentified. Its excitation and/or formation is limited to a short evolutionary phase since the feature is not observed in IR spectra of AGB stars nor in those of planetary nebulae (e.g. Kwok et al. 1999; Volk et al. 1999). The carbon rich nature of the circumstellar environment of these objects was corroborated by the detection of C2, C3 and CN bands in the optical spectra (Hrivnak 1995). Detailed analysis of high-resolution spectra of these bands indicates that they are formed in a relatively narrow shell in the circumstellar envelope (Bakker et al. 1996; 1997).
Several studies of the photospheric composition confirmed the post-3rd dredge-up character of individual 21m stars: they do not only display a high photospheric C/O ratio but also a large overabundance of s-process elements (Van Winckel 1999 and references therein). The colour-temperature of the IR-excess, the high luminosity and actual spectral type together with the chemical composition of both the photosphere and circumstellar material are all observational evidence that the 21m stars are post-carbon stars.
Although in recent years the efforts and results on the theoretical modelling of the structural and chemical evolutionary AGB models are impressive (see e.g. Straniero et al. 1995; Frost & Lattanzio 1996; Herwig et al., 1997; Mowlavi et al. 1998; Mowlavi 1999; Langer et al. 1999) the calculations are not only dependent on fundamental parameters like initial mass and metallicity, but also on much less constrained or even free parameters like mass-loss history and geometry, details of the dredge-up phenomena and thermal pulse nucleosynthesis, numerical treatment of convection, interpulse phase at which the post-AGB phase starts, engulfed proton profile into the intershell, etc.
There is now general agreement that the neutrons, needed for the s-process nucleosynthesis in AGB stars, are mainly produced by the 13C(,n)16O reaction with a possible contribution from the minor activation of the reaction 22Ne(,n)25Mg (e.g. Smith & Lambert 1986; Jorissen & Arnould 1989; Busso et al. 1992; Gallino et al. 1998; Mowlavi et al. 1998). The 13C available from the CNO hydrogen burning is insufficient to explain observed s-process abundances (e.g. Mowlavi et al. 1998) so one has to invoke a primary source of 13C. This 13C pocket is naturally build up after engulfment of free protons into the 12C-rich intershell. The engulfed proton profile is, however, still a free parameter in the predictions. Straniero et al. (1995) proposed that the s-process synthesis occurs during the intershell in a radiative environment and they computed that the neutron irradiation varies within the radiative intershell depending on the engulfed proton profile.
The observational data guiding the theoretical chemical evolutionary models come from the analysis of intrinsic AGB stars of the M-MS-S-SC-C star sequence, (e.g. Lambert et al. 1995 and references therein) which is thought to reflect, at least partly, the evolution on the AGB of single stars towards an increasing C/O ratio. In addition, the enrichment in 12C seems to correlate well with an increase in s-process abundances (e.g Smith & Lambert 1990). The study of the abundance distribution of different s-process elements is therefore a very useful tool to characterise the internal nucleosynthesis during and in between thermal pulses and to confine models of chemical evolution on the AGB. The strong molecular opacity and sometimes unstable photospheres of AGB stars make a quantitative analysis, however, difficult and some species even untraceable.
A second group of objects with excess abundances of s-process elements is the Ba-stargroup. In the rest of the paper we use the Ba-stargroup as a generic term for all objects for which the excess is acquired by mass-transfer from the companion which is now a white dwarf. It includes strong and mild Ba giants and Ba dwarfs, CH giant and subgiants, extrinsic S stars and since recently also yellow symbiotics (e.g. review by Jorissen 1999). The characteristics of the s-process excesses in these stars reflect the internal chemical enrichment of the companion, and the abundances may have been diluted by mixing of unprocessed material during the evolution of the gainer. The S-type stars in this group are normally labeled extrinsic S-stars and are characterised by the lack of Tc in their atmospheres (e.g. Jorissen et al. 1993) or their lower luminosity than intrinsic AGB S-stars (Van Eck et al. 1998).
In this paper, we analyse another group of intrinsic s-process enriched objects, namely the 21m stars. With their F to G spectral types, a wide variety of chemical species can be studied quantitatively by using photospheric atomic lines. This makes them ideal complementary sources to constrain the 3rd dredge-up nucleosynthesis and dredge-up models.
The chemical composition of individual 21m objects is already reported in the literature (Klochkova 1995; Začs et al. 1995; Van Winckel et al. 1996a; Reddy et al. 1997; Decin et al. 1998, Klochkova et al. 1999). Since the different authors use different line-lists, spectral resolution and atomic data, it is often difficult to compare the results quantitatively. We therefore present in this paper a homogeneous chemical study of a sample of 21m objects using the same spectral resolution, line-lists and atomic data for all 6 programme stars. We focus specifically on the different s-process elements and the integrated neutron irradiation. In Sect. 2 we give an overview on the data obtained and sketch the reduction method, while the details of the chemical analysis are given in Sect. 3. In Sect. 4 a synopsis of our abundance analysis is presented proving that the 21m stars show clear chemical evidence for their post-AGB character. Sect. 5 is devoted to the discussion of the results of the individual objects and in Sect. 6 we focus on the heavy-element nucleosynthesis and the determination of the neutron exposure. Our findings on the post-AGB stars are then compared in Sect. 7 to the s-process abundances displayed in intrinsic AGB stars and extrinsic heavy-element enriched objects with a wide range in metallicity. We end with formulating the main conclusions in Sect. 8.
2 Observations and reduction
In Table 1 we list the sample of 21m stars discussed here together with the spectral domain observed and signal-to-noise obtained. Most spectra were obtained using the Utrecht Echelle Spectrograph (UES) mounted on the 4.2m William Hershel Telescope (WHT) on La Palma, Spain. We used the echelle with 31.6 lines/mm and the projected slit width was 1.1” on the sky yielding a resolution of around R = / 50 000) depending on the wavelength.
| IRAS | Other | Visual | Equatorial | Galactic | ||
| name | magnitude | coordinates | coordinates | |||
| m(v) | l | b | ||||
| 04296+3429 | 14.2 | 04 32 56.6 | 34 36 11 | 166.24 | 9.05 | |
| 05341+0852 | 12.8 | 05 36 54.2 | 08 54 10 | 196.19 | 12.14 | |
| 07134+1005 | HD 56126 | 8.3 | 07 16 10.2 | 09 59 47 | 206.75 | +9.99 |
| 195001709 | HD 187885 | 9.2 | 19 52 52.7 | 17 01 50 | 23.98 | 21.04 |
| 22223+4327 | 9.7 | 22 24 30.7 | 43 43 03 | 96.75 | 11.56 | |
| 23304+6147 | 13.1 | 23 32 45.0 | 62 03 49 | 113.86 | +0.59 | |
| Date and UT | Telescope+ | Sp. Range. | S/N | |||
| Spectrograph | (nm) | () | () | |||
| 04296+3429 | 22/2/1994 21:20 | WHT+UES | 556.5-1022 | 80 | 53 | 60 |
| 05341+0852 | 08/8/1995 05:15 | WHT+UES | 556.5-1004 | 50 | 24 | 8 |
| blue : 160 | ||||||
| 07134+1005 | 29/9/1998 09:01 | NTT+EMMI | 398-662 | green : 210 | 86 | 71 |
| 24/2/1992 21:57 | WHT+UES | 535-1040 | 100 | 84 | 70 | |
| 195001709 | 06/8/1995 23:55 | WHT+UES | 364-458 | 140 | 12 | 24 |
| 08/8/1995 00:17 | WHT+UES | 453-680 | 240 | 13 | 25 | |
| 07/8/1995 01:34 | WHT+UES | 551-1004 | 320 | 12 | 24 | |
| 22223+4327 | 23/8/1994 01:56 | WHT+UES | 443.5-650.5 | 180 | 42 | 30 |
| 21/8/1994 22:45 | WHT+UES | 556.5-1004 | 190 | 42 | 30 | |
| 23304+6147 | 23/8/1994 03:48 | WHT+UES | 443.5-650.5 | 50 | 26 | 16 |
| 22/8/1994 01:09 | WHT+UES | 556.5-1004 | 110 | 26 | 16 | |
Some of the UES spectra were kindly provided by Dr. Eric Bakker and used by him in his analysis of the optical circumstellar molecular absorption bands (Bakker et al. 1996; 1997). For IRAS07134 the 3.5m New Technology Telescope (NTT) of the European Southern Observatory (ESO) was used in combination with the high-resolution echelle mode of EMMI using grating number 14. The projected slit width was 1” on the sky, yielding a resolution of R 60 000. Since most objects are heavily reddened, the S/N achieved depends strongly on wavelength and of course on the specific characteristics of the cross-dispersed spectrographs. The standard reduction included bias correction, flat-fielding, cosmic hits identification and cleaning and background subtraction. The extraction was done by a simple mean over the spatial profile and the wavelength calibration was performed by using Thorium-Argon lamp measurements. The different orders do not overlap from 580 nm red-wards for the UES in combination with the 10242 pixel TEK CCD and for 742 nm red-wards for EMMI with the 20482 TEK CCD (ESO number 36). We normalised the spectra by dividing the individual orders by a smoothed spline function defined through interactively identified continuum points. We used the specific echelle context of MIDAS for the reduction.
3 Analysis
3.1 Atomic data
Mainly the solar line list of Thévenin (1989,1990) was used for the first line identification. For specific elements, the line lists of the Vienna Atomic Line Database (VALD2, http://www.astro.univie.ac.at/ vald/, Kupka et al. 1999) were used, and estimated line strengths were computed. Next, the lines stronger than our detection limit were identified in the measured spectra.
The oscillator strengths (-values) were taken from several sources: for Fe, we used the critical compilation of Lambert et al. (1996), completed with values of Blackwell et al. (1980) for Fe II. Values for C, N and O were mainly taken from the Opacity Project (Hibbert et al. 1991, 1993; Biémont et al. 1991); values for the s-process elements from the Vienna Atomic Line Database (VALD2); values for the other elements mainly from Thévenin (1989, 1990), but also from Wiese et al. (1966), Reader et al. (1980), Fuhr et al. (1988), Martin et al. (1988), Venn (1995) and Gonzalez et al. (1997). The line list can be obtained from the authors upon request.
3.2 Radial velocities
| IRAS | method | date | ref. | |
| () | (mm/yy) | |||
| 04296+3429 | 55 | CO | 12/88 | 11 |
| 59 | CO | 01/89 | 7 | |
| 53 | opt. | 02/94 | ||
| 56 | opt. | 02/97 | 3 | |
| 05341+0852 | 24 | opt. | 08/95 | |
| 25 | opt. | 12/96 | 10 | |
| 26 | CO | 04/98 | 12 | |
| 07134+1005 | 87 | CO | 01/89 | 7 |
| 105 | opt. | (?) | 9 | |
| 82–92 | opt. | 01/91-04/92 | 5 | |
| 86 | CO | 04/90-01/91 | 1 | |
| 84a | opt. | 02/92 | ||
| 91 | opt. | 01/93 | 2 | |
| 86 | opt. | 12/93&02/94 | 8 | |
| 86b | opt. | 09/98 | ||
| 195001709 | 13 | CO | 03/86 | 6 |
| 13 | CO | 07/87 | 4 | |
| 13 | CO | 07/90 | 7 | |
| 12 | CO | 04/90–01/91 | 1 | |
| 12 | opt. | 08/95 | ||
| 22223+4327 | 37 | CO | 01/88 | 6 |
| 42 | CO | 01/89 | 7 | |
| 42 | opt. | 08/94 | ||
| 23304+6147 | 26 | CO | 12/88 | 11 |
| 26 | CO | 01/88 | 6 | |
| 26 | CS | 01/89 | 7 | |
| 26 | opt. | 08/94 |
(a) UES spectra (1992), (b) EMMI spectra (1998)
ref.
(1) Bujarrabal et al. 1992
(2) Klochkova 1995
(3) Klochkova et al. 1999
(4) Knapp et al. 1989
(5) Lèbre et al. 1996
(6) Likkel et al. 1991
(7) Omont et al. 1993
(8) Oudmaijer & Bakker 1994
(9) Parthasarathy et al. 1992
(10) Reddy et al. 1997
(11) Woodsworth et al. 1990
(12) Hrivnak & Kwok 1999
The heliocentric radial velocities of the objects are given in Table 1 with an internal accuracy of 1 km s-1. Comparison with published velocities reveals no significant variability in most objects (see Table 2). For IRAS04296, an accurate velocity is hampered by our lower signal-to-noise. IRAS19500 and IRAS23304 are clearly not variable. For IRAS05341 and IRAS22223 we have not enough velocities to compare with, but non-variability is most likely. The results of IRAS07134 are more difficult to interpret since the star is a known photometric variable. Lèbre et al. (1996) report on the results of their spectroscopic monitoring campaign, which spanned 440 days. They deduced radial velocity variations between 81.73 and 91.79 km s-1 for this pulsating star but did not find evidence for binary motion. The measurement of Parthasarathy et al. (1992) deviates significantly from this range but it is difficult to evaluate since they do not give the date of observation. From the reception date of the article itself, it could have been very well during the monitoring campaign of Lèbre et al.
We can conclude that for none of the stars there is evidence for binarity from the radial velocities obtained so far.
3.3 Determination of atmospheric parameters and abundances.
| Z | Teff | |||
|---|---|---|---|---|
| (K) | () | |||
| IRAS04296 | 0.5 | 7000 | 1.0 | 4.0 |
| IRAS05341 | 1.0 | 6500 | 1.0 | 3.5 |
| IRAS07134 | 1.0 | 7250 | 0.5 | 5.0 |
| IRAS19500 | 0.5 | 8000 | 1.0 | 6.0 |
| IRAS22223 | 0.5 | 6500 | 1.0 | 5.5 |
| IRAS23304 | 1.0 | 6750 | 0.5 | 3.0 |
In order to calculate abundances, we used the model atmospheres of Kurucz (1993) on his CDROM nr. 13. These LTE atmospheres are uniquely determined by the effective temperature (Teff), gravity () and overall metallicity (Z). The models were computed using opacity distribution functions assuming a constant microturbulent velocity () of 2 .
The model parameters were based solely on the basis of the spectra, more specifically on the analysis of a set of well measured Fe I and Fe II lines with accurate atomic data. We used Fe for this purpose, not only because of the large number of lines, but also because of the accurate oscillator strengths. We determined, after several iterations, Teff by demanding the abundances of a Fe-ion to be independent of the lower excitation potentials; the surface gravity by demanding ionization equilibrium for Fe I and Fe II; the microturbulent velocity , by forcing the abundances to be independent of the reduced equivalent widths . Results of other authors or photometric data were used as a first guess. The stars in the sample are 1000 K too cool to show He I-lines, so we could not obtain He-abundances, except for the hottest star (IRAS19500, Teff=8000K). We already reported the detection of a He I-line (587.565 nm) for this star in Van Winckel et al. (1996a). The obtained parameters are listed in Table 3.
The abundance determinations were made using the Kurucz program WIDTH9. We refer to Decin et al. (1998) and Van Winckel (1997) for an extensive error analysis and remind that the uncertainties, assuming LTE, are mainly induced by uncertain values and an uncertain temperature determination. Since the model atmospheres of Kurucz are listed with steps of = 250 K and = 0.5, that correspond to the uncertainties of the spectroscopic parameter determinations, we did not interpolate between models. The possibility to infer an abundance of an ion critically depends on the presence of useful lines of that ion in the studied spectral range. We only used in this LTE analysis lines which appear unblended in our spectra and have an equivalent width smaller than 150 mÅ.
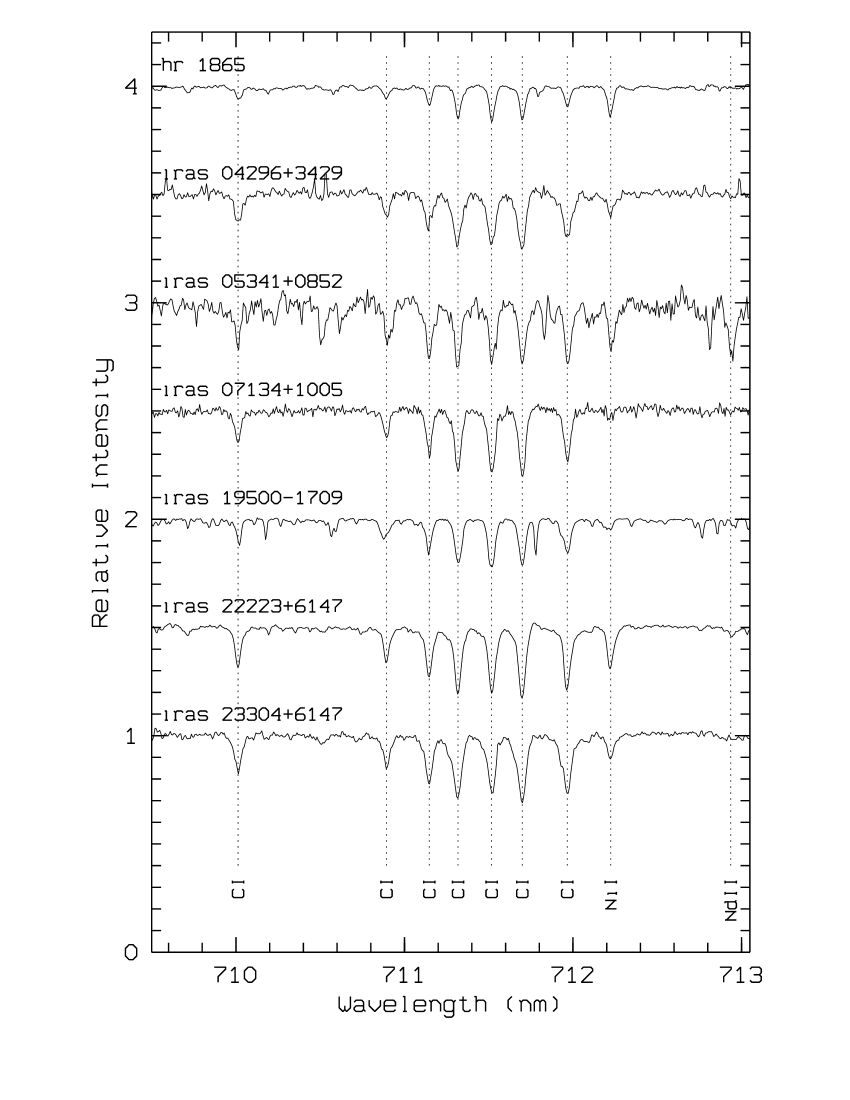

Lines of neutral carbon (C I) are numerous in the spectrum of each star (see Fig. 1). Combined with accurate -values, we were able to determine intrinsically very consistent C-abundances (, except for IRAS04296: ). Useful nitrogen lines (N I) are more difficult to obtain, but there are some weak lines in the red part of the spectrum; only for IRAS07134 we measured more than 5 weak lines. The oxygen abundances of the 21m stars are in most cases more difficult to obtain. Since the O triplet at 777.4 nm is strongly non-LTE sensitive, weaker lines should be used. For the cooler stars in the sample, only the high excitation multiplet at 615.6 nm can be used (Fig. 2), but since these lines are heavily blended, we used multiple Gaussian fitting to estimate their equivalent widths. For the two hotter stars IRAS07134 and IRAS19500, there are more lines in the spectrum, so the O-abundance is better established.
From sodium (Na, Z=11) to sulphur (S, Z=16), abundances are hard to obtain due to the lack of lines. Only two different sodium lines were found in the spectra ( nm and nm), both of them having small equivalent widths ( mÅ). IRAS19500 and IRAS22223 are the only stars that show aluminium lines which we considered to be good enough to use in an abundance calculation. Silicon (Si) has more lines, but it shows for some stars a rather large line-to-line scatter.
For the heavier metals (Ca, Sc, Ti, Cr, Ni), more lines were found. Neutral calcium (Ca) is found in every star. Also scandium (Sc) and titanium (Ti) abundances were derived for almost every star, and this from lines of singly ionised atoms. Chromium (Cr) displays lines from neutral as well as singly ionised atoms, allowing an extra check for the ionization equilibrium (see Sect. 3.3). Nickel (Ni) is also found in every star, showing neutral lines in the cooler objects, ionised lines in the hotter ones. Other iron-peak elements found are vanadium (V), manganese (Mn) and zinc (Zn).
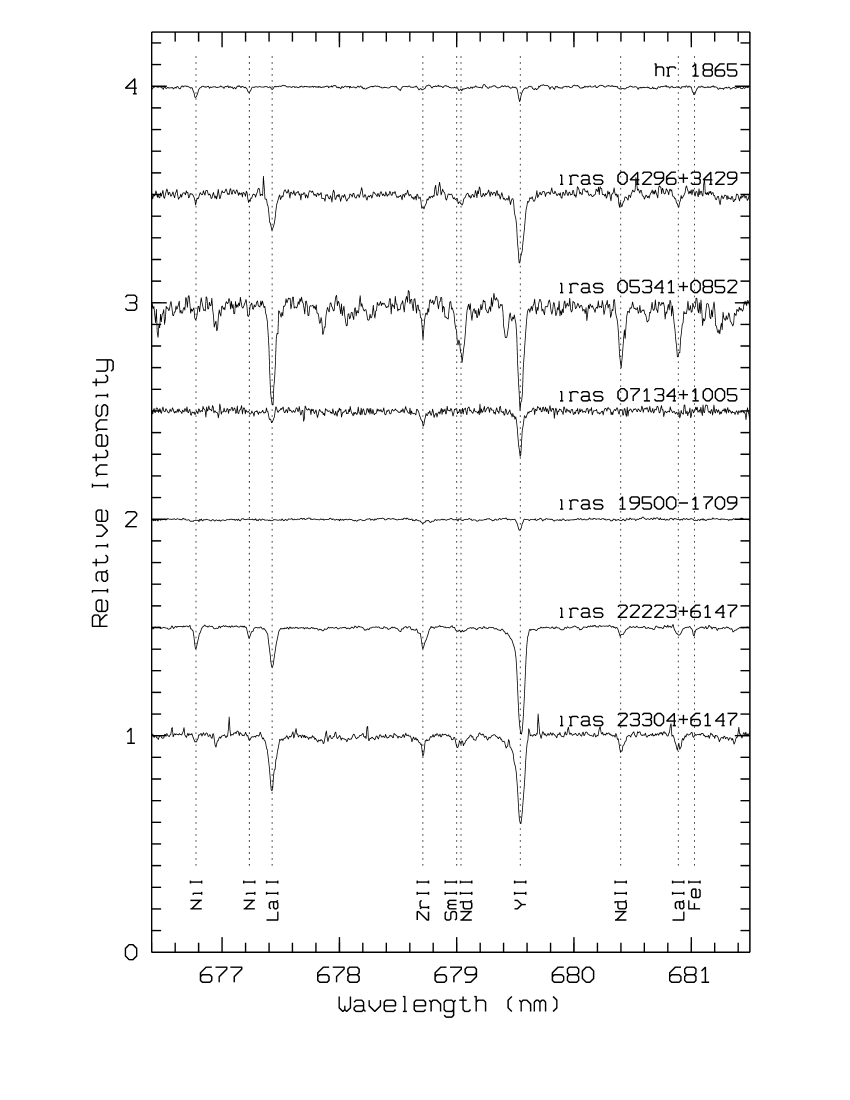
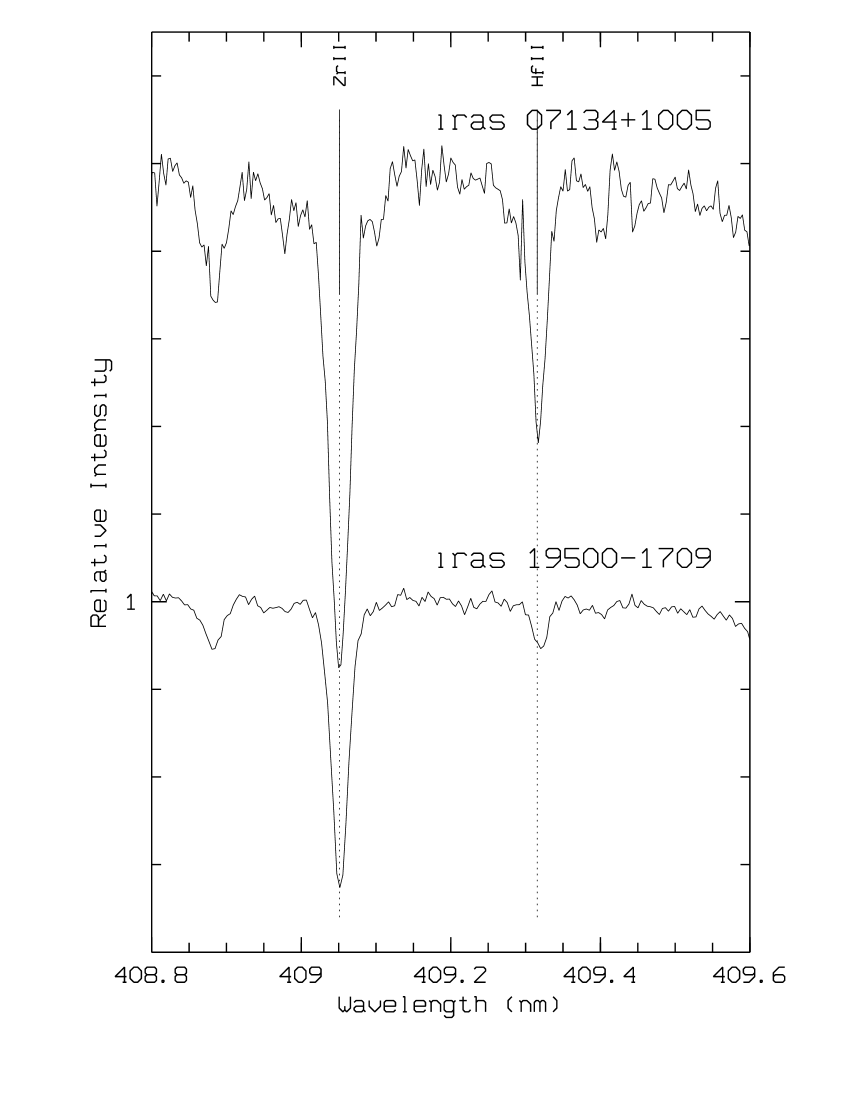
For the 21m stars which have F spectral types, the s-process elements are determined by lines from singly ionised atoms. The strontium (Sr) abundance is very difficult to determine accurately since the resonance lines at 421.5 nm and 407.7 nm are heavily saturated and weaker optical lines are not present. Yttrium (Y) and zirconium (Zr) abundances are more easily obtained. Moreover, these elements show a large number of lines in the hotter stars of our sample. An accurate barium (Ba) abundance is, like for Sr, difficult to determine, since weak optical lines are absent and only a few very strong saturated lines are present (for example, see Fig. 2). Three BaII-lines were found with : 416.600 nm, 585.367 nm and 873.776 nm. Lanthanum (La), cerium (Ce) and neodymium (Nd) are easier to study and we obtained abundances for every star. Praseodymium (Pr) and samarium (Sm) have less lines and we were not able to determine abundances for these elements for every star. Also europium (Eu) lines are quite rare; we detected only three different EuII-lines in our spectra. Finally, we also detected a Hafnium (Hf, Z=72) line (409.316 nm) in the spectrum of IRAS07134 and IRAS19500 (Fig. 5). This line will be discussed in more detail in Sect. 5.
3.4 Hyperfine splitting
We investigated the influence of hyperfine splitting (hfs) on some observed lines which are considered to be sensitive for this effect. Hfs causes extra desaturation but is only important for lines of elements with an odd atomic number and strong nucleon-electron interaction.
Hfs will affect weak lines in their profile, but not in their equivalent width, leaving the derived abundance unchanged. For stronger lines on the flat part of the curve of growth, however, also the equivalent width will be affected. The hfs-influence critically depends on the temperature, since at higher temperatures the Doppler widths will wash out the effect of hfs on the line-profile.
The Kurucz spectrum synthesis program ”Synthe” (Kurucz 1993) was used to study the influence of hfs. We calculated the difference in equivalent width of a synthetic line treated with and without hfs-decomposition for the relevant model atmospheres. We investigated the following lines which are considered to be among the most influenced by hfs-splitting: one aluminium ( 394.401 nm), one scandium ( 660.460 nm) and two europium lines ( 412.973 nm and 664.506). The hsf-decompositions were obtained from McWilliam et al. (1995) and Biehl (1976).
The influence of hfs on Wλ of the synthetic lines was found to be noticeable, but spectrum synthesis made clear that the other sources of uncertainty (like continuum placement, errors on the atmospheric parameters etc.) are much more important in our programme stars. The small influence, even on the normally strongly affected Eu 412.973 nm line may surprise, but this line is only observed in the hotter stars where it has an equivalent width of only 32 mÅ at most. For the cooler 21m objects this line was not observed but our calculations indicate that this strong line would be heavily affected indeed.
Since line-profile fitting induces other uncertainties and since the effect on the weak lines used in our analysis is very small, we did not include hfs profile fitting results in our final table.
4 Synopsis of the abundance results
In this section we discuss Table 4 and Fig. 4, which give an overview of the results of our abundance analysis. In the last column of Table 4, we list a typical abundance pattern for an unevolved metal deficient star (e.g. Lambert 1989; Wheeler et al. 1989; Edvardsson et al. 1993; McWilliam 1997) reflecting the chemical composition of our programme stars at the time of their formation. Comparing these unprocessed abundances with the observed abundances permits us to detect possible changes in the chemical composition during the stars evolution. Applied to low-mass post-AGB stars, we expect the chemical signature of the 3rd dredge-up without activation of hot-bottom burning i.e. the enrichment of the stellar photosphere with material exposed to He-burning during the TP-AGB phase. This signature includes: carbon and (to a lesser extent) oxygen enrichment, a C/O number ratio higher than solar (C⊙/O⊙=0.51) and, above all, s-process enrichment. All 21m sources studied here turn out to show almost all these enrichments, which make them a group of definite post 3rd dredge-up post-AGB stars.
| IRAS | 04296 | 05341 | 07134 | 19500 | 22223 | 23304 | subdwarf | |
|---|---|---|---|---|---|---|---|---|
| metallicity | [Fe/H] | 0.6 | 0.8 | 1.0 | 0.6 | 0.3 | 0.8 | 0.7 |
| CNO | [C/Fe] | 0.8 | 1.0 | 1.1 | 1.0 | 0.3 | 0.9 | 0.0 |
| abundance | [N/Fe] | 0.4 | 0.7 | 0.9 | 1.0 | 0.2 | 0.5 | 0.0 |
| [O/Fe] | / | 0.6 | 0.8 | 0.7 | 0.1 | 0.2 | 0.4 | |
| -elements | [/Fe] | 0.5 | 0.4 | 0.1 | 0.3 | 0.2 | 0.4 | 0.3 |
| s-process | [s/Fe] | 1.5 | 2.2 | 1.5 | 1.1 | 0.9 | 1.6 | 0.0 |
| elements | [ls/Fe] | 1.7 | 1.9 | 1.6 | 1.4 | 1.3 | 1.6 | 0.0 |
| [hs/Fe] | 1.5 | 2.3 | 1.5 | 1.0 | 0.8 | 1.6 | 0.0 |
4.1 Metallicity
To calculate the metallicity, we used the iron abundance inferred from the FeII-lines since this is by far the dominant ionization level. The metallicity relative to the solar value ranges from 0.3 (IRAS22223) to 1.0 (IRAS07134). This is a strong indication that our sample indeed consists of an old and hence low-mass population. This interpretation is further strengthened by the high galactic latitudes of the stars, in the range =9∘–21∘. An exception with respect to the latter criterion is IRAS23304, for which . Its low-mass nature is, however, clear from the low metallicity ([Fe/H]=0.8).
4.2 CNO abundance
All stars display huge carbon-enrichments. This enrichment is beyond any doubt even when the internal scatter of the C-lines and the uncertainty induced by the model parameters are taken into account. As already pointed out in Sect. 3.3, the O-abundance is in most cases less certain. Only for the two hotter objects IRAS07134 and IRAS19500 we feel confident that we detected a moderate but real O-enrichment. The reliability of the oxygen abundances will be discussed in the following section, in which we treat the objects separately.
Unfortunately, the errors on mainly the O-abundance preclude accurate C/O number ratio determination based on photospheric atomic lines. The range we determine goes from 1.0 to 2.9.
4.3 -elements
The [/Fe] value is the mean of the [el/Fe] values of the observed -elements. If we take into account a typical error of 0.2 dex in the abundances, we may conclude that the -overabundances reflect the chemical history of the Galaxy and are therefore not enhanced.
The -elements show, however, large differences in their [el/Fe] values within each star, up to an extreme value of 1 dex. Unfortunately, the lack of useful lines for the light -elements prevent too strong conclusions whether this is intrinisic or due to non-LTE effects and/or unaccurate . The [/Fe] value is therefore only an indicative number.
4.4 s-process enrichment
The s-process elements observed in evolved stars can be divided into two groups: the light s-process elements around the magic neutron number 50 (Sr, Y, Zr) and the heavy s-process elements around the magic neutron number 82 (Ba, La, Ce, Pr, Nd, Sm, (Eu)). In order to investigate the s-process abundances in more detail, four indexes are generally defined: [s/Fe], [ls/Fe], [hs/Fe] and [hs/ls]. Which elements are taken into account to determine these indices is different from author to author and is mainly determined by the possibility to compute accurate abundances of the different elements. To compare the results on 21m stars with other s-process enriched objects, the same index should be used. We follow the proposition of Busso et al. (1995) and define the ls-index as the mean of Sr, Y and Zr and the hs-index as the mean of Ba, La, Nd and Sm. Consequently, [s/Fe] is the mean of the 7 former elements and [hs/ls]=[hs/Fe][ls/Fe].
For unobserved species of the light s-process no correction factor was taken into account since the odd-even effect is not very strong. For unobserved species of the hs index, for which the odd-even effect is much stronger, the undetermined abundance was estimated using the predictions of Malaney (1987) with a = 0.4 mbarn-1 scaled to the observed abundance of another heavy s-process element. This method was used to estimate the Sm-abundance for IRAS04296 and IRAS19500. Note that the [hs/ls] index is by its definition in principle independent of the total s-process enrichment ([s/Fe]).
Regarding Table 4, the overabundance of the s-process elements is beyond any doubt and is definitely the most convincing argument for the post 3rd dredge-up status of the studied stars. For unevolved objects in the same metallicity range, one expects the s-process elements to scale with Fe: [s/Fe]=0 (see Wheeler et al. 1989). Here we find [s/Fe]0.9 (IRAS22223), up to [s/Fe]=2.2 (IRAS05341).
| IRAS04296 | IRAS05341 | IRAS07134 | IRAS19500 | IRAS22223 | IRAS23304 | ||||||||||||||||||||
| [Fe/H]=0.62 | [Fe/H]=0.85 | [Fe/H]=1.00 | [Fe/H]=0.60 | [Fe/H]=0.31 | [Fe/H]=0.79 | ||||||||||||||||||||
| ion | Solar | N | [el/Fe] | N | [el/Fe] | N | [el/Fe] | N | [el/Fe] | N | [el/Fe] | N | [el/Fe] | ||||||||||||
| He I | 10.99 | 1 | 39 | +1.08 | |||||||||||||||||||||
| C I | 8.57 | 7 | 87 | +0.76 | 0.20 | 11 | 96 | +1.01 | 0.14 | 40 | 58 | +1.08 | 0 .12 | 21 | 48 | +1.01 | 0.12 | 8 | 70 | +0.32 | 0.14 | 15 | 71 | +0.92 | 0.12 |
| N I | 7.99 | 2 | 65 | +0.39 | 0.01 | 3 | 52 | +0.69 | 0.08 | 8 | 84 | +0.85 | 0 .15 | 3 | 85 | +0.98 | 0.11 | 4 | 54 | +0.16 | 0.08 | 3 | 45 | +0.48 | 0.13 |
| O I | 8.86 | 2 | 31 | +0.56 | 0.00 | 8 | 44 | +0.81 | 0 .11 | 8 | 62 | +0.70 | 0.08 | 3 | 24 | 0.05 | 0.04 | 4 | 15 | +0.17 | 0.03 | ||||
| Na I | 6.33 | 1 | 26 | +0.04 | 1 | 11 | +0.46 | 1 | 10 | +0.22 | 1 | 20 | +0.08 | ||||||||||||
| Mg I | 7.58 | 1 | 71 | +0.06 | 3 | 95 | +0.24 | 0.18 | |||||||||||||||||
| Mg II | 4 | 48 | +0.51 | 0.07 | |||||||||||||||||||||
| Al I | 6.47 | 1 | 95 | 0.28 | 4 | 16 | 0.01 | 0.10 | |||||||||||||||||
| Si I | 7.55 | 3 | 55 | +0.79 | 0.26 | 5 | 50 | +0.59 | 0.16 | 14 | 46 | +0.29 | 0.14 | 5 | 39 | +0.79 | 0.25 | ||||||||
| S I | 7.21 | 1 | 57 | +0.43 | 1 | 42 | +0.28 | 1 | 15 | +0.40 | 1 | 6 | +0.26 | 4 | 53 | +0.04 | 0.19 | 4 | 36 | +0.56 | 0.11 | ||||
| Ca I | 6.36 | 3 | 35 | +0.18 | 0.16 | 6 | 55 | +0.08 | 0.18 | 5 | 21 | 0.11 | 0 .08 | 1 | 11 | +0.49 | 6 | 57 | 0.09 | 0.10 | 7 | 63 | +0.29 | 0.18 | |
| Ca II | 1 | 16 | 0.25 | ||||||||||||||||||||||
| Sc II | 3.10 | 6 | 50 | +0.22 | 0 .10 | 6 | 49 | +0.38 | 0.15 | 2 | 110 | +0.29 | 0.08 | ||||||||||||
| Ti I | 4.99 | 2 | 26 | +0.47 | 0.07 | ||||||||||||||||||||
| Ti II | 1 | 52 | +0.58 | 31 | 84 | +0.11 | 0 .15 | 11 | 70 | +0.19 | 0.15 | 3 | 111 | 0.18 | 0.15 | ||||||||||
| V II | 4.00 | 1 | 107 | 0.05 | 1 | 97 | +0.12 | ||||||||||||||||||
| Cr I | 5.67 | 3 | 79 | 0.15 | 0 .13 | 3 | 50 | +0.19 | 0.08 | 7 | 45 | 0.08 | 0.15 | 1 | 5 | +0.16 | |||||||||
| Cr II | 18 | 58 | +0.19 | 0 .13 | 20 | 51 | +0.13 | 0.10 | 6 | 118 | 0.03 | 0.23 | 2 | 40 | 0.04 | 0.20 | |||||||||
| Mn I | 5.39 | 1 | 38 | 0.26 | |||||||||||||||||||||
| Mn II | 2 | 22 | +0.16 | 0 .05 | 1 | 50 | +0.13 | 1 | 6 | 0.44 | |||||||||||||||
| Fe I | 7.51 | 8 | 32 | 0.04 | 0.11 | 23 | 57 | +0.05 | 0.14 | 36 | 32 | 0.08 | 0 .15 | 15 | 29 | 0.05 | 0.06 | 41 | 57 | 0.11 | 0.14 | 39 | 53 | +0.01 | 0.22 |
| Fe II | 10 | 74 | 0.10 | 7 | 84 | 0.14 | 17 | 67 | 0.1 0 | 18 | 74 | 0.06 | 12 | 49 | 0.15 | 7 | 63 | 0.14 | |||||||
| Ni I | 6.25 | 3 | 47 | +0.54 | 0.11 | 7 | 45 | +0.53 | 0.19 | 2 | 7 | 0.12 | 0 .11 | 19 | 35 | 0.01 | 0.16 | 9 | 18 | +0.14 | 0.09 | ||||
| Ni II | 1 | 31 | 0.11 | 4 | 27 | +0.11 | 0.15 | ||||||||||||||||||
| Zn I | 4.60 | 1 | 15 | +0.37 | |||||||||||||||||||||
| Y II | 2.24 | 3 | 84 | +1.98 | 0.06 | 2 | 129 | +2.09 | 0.02 | 16 | 79 | +1.50 | 0 .25 | 18 | 74 | +1.34 | 0.18 | 4 | 128 | +1.51 | 0.09 | 2 | 51 | +1.83 | 0.06 |
| Zr II | 2.60 | 4 | 33 | +1.34 | 0.23 | 3 | 72 | +1.75 | 0.15 | 19 | 59 | +1.60 | 0 .22 | 22 | 80 | +1.41 | 0.11 | 5 | 83 | +1.04 | 0.15 | 4 | 33 | +1.27 | 0.20 |
| Ba II | 2.13 | 1 | 25 | +1.73 | 1 | 82 | +2.43 | 1 | 53 | +1.94 | 1 | 55 | +1.48 | 1 | 13 | +0.85 | 1 | 40 | +2.03 | ||||||
| La II | 1.22 | 5 | 59 | +1.74 | 0.13 | 17 | 94 | +2.47 | 0.17 | 31 | 28 | +1.65 | 0 .15 | 6 | 26 | +1.21 | 0.09 | 16 | 68 | +1.04 | 0.17 | 9 | 64 | +1.88 | 0.20 |
| Ce II | 1.55 | 2 | 24 | +1.20 | 0.04 | 6 | 71 | +2.40 | 0.14 | 50 | 43 | +1.45 | 0 .21 | 7 | 10 | +0.91 | 0.13 | 8 | 52 | +0.82 | 0.23 | 9 | 57 | +1.54 | 0.19 |
| Pr II | 0.71 | 16 | 69 | +2.40 | 0.19 | 4 | 10 | +1.45 | 0 .11 | 5 | 48 | +0.92 | 0.24 | 4 | 29 | +1.81 | 0.22 | ||||||||
| Nd II | 1.50 | 2 | 23 | +1.08 | 0.17 | 19 | 96 | +2.47 | 0.19 | 29 | 19 | +1.31 | 0 .12 | 1 | 3 | +0.52 | 12 | 51 | +0.73 | 0.20 | 21 | 45 | +1.67 | 0.20 | |
| Sm II | 1.00 | 4 | 71 | +1.85 | 0.03 | 9 | 12 | +1.04 | 0 .05 | 10 | 53 | +0.50 | 0.20 | 5 | 21 | +0.92 | 0.09 | ||||||||
| Eu II | 0.51 | 1 | 41 | +0.97 | 1 | 38 | +1.22 | 1 | 30 | +0.48 | 1 | 3 | +0.26 | 2 | 47 | +0.57 | 0.06 | 1 | 65 | +1.21 | |||||
| Hf II | 0.88 | 1 | 83 | +1.84 | 1 | 12 | +1.25 | ||||||||||||||||||
5 Individual objects

The individual objects will be discussed in this section. In Table 5 we list the complete abundance analysis of each programme star. We want to stress that we will not repeat the conclusions already made in the previous section, but that we will focus on the peculiarities in the analysis of each star.
5.1 IRAS 04296+3429
The chemical analysis of this object has already been discussed by our group (Decin et al. 1998). Nevertheless, there are some minor differences between the present analysis and the previous one, as a consequence of an update of our line list. The main conclusions of Decin et al. (1998) remain valid.
5.2 IRAS 05341+0852
This object was first mentioned by Geballe & Van der Veen (1990) suggesting that it is an evolved F-type supergiant displaying carbon-rich circumstellar dust. Its 21m feature was discovered by Kwok et al. (1995). An extensive abundance analysis was previously carried out by Reddy et al. (1997). They found the star to be metal-poor, carbon-rich and s-process enriched. We included this star in our sample to make the comparison with other objects more significant by using the same line list.
For the model parameters, we found Teff=6500K,
=1.0 and =3.5 .
The model parameters agree with
those found by Reddy (6500, 0.5, 5.0), but there are some
differences in the abundances. In general, for species displaying a
large difference,
our analysis was based upon significantly more lines, which should
imply that our results are intrinsically more reliable.
Besides the huge carbon enrichment also oxygen is moderately enhanced ([O/Fe]=+0.6) but this value is based only on two blended lines.
Reddy et al. also found a significant overabundance of lithium and we confirm the presence of the Li line at 670.7nm in our spectra as well.
The number of lines of the s-process elements is impressive. A close look at the spectrum reveals that it is even completely dominated by lines of s-process elements. [s/Fe] (Table 4) is 2.2, making IRAS05341 the most s-process enhanced post-AGB star known so far. Note the even-odd alternation of the absolute abundances (Fig. 6) and the good internal consistency (). There is significant difference in the [el/Fe] ratios of our analysis and the one of Reddy et al. (1997) reaching up to +0.8 dex. Since we take much more and much weaker lines into account reaching a good internal accuracy, and use the same lines as in the other programme stars, we will use our abundances in the discussion.
5.3 IRAS 07134+1005 = HD 56126
With its 8.3 visual magnitude, this is the brightest star in our sample. Considerable efforts have been performed already to reveal the properties of the circumstellar shell of this well-known post-AGB star. 12CO, 13CO, HCN and HCO+ (Bujarrabal et al. 1992, Omont et al. 1993) have been detected in millimeter and radio line emission. The 21m feature was discovered by Kwok et al. (1989) in its IRAS Low Resolution Spectrum. Optical spectra revealed the presence of circumstellar C2, 12CN and 13CN bands (Bakker et al. 1996; Bakker & Lambert 1998a) and 12C13C and 12C16O bands (Bakker & Lambert 1998b) , which led to an estimate for the 12C/13C ratio : 12C/13C= 72 26. Mid-infrared (8-21m) imaging shows no spherical but possibly an axial symmetry of the dust emission (Meixner et al. 1997; Dayal et al. 1998).
Concerning the photosphere, there is general agreement that IRAS07134 is a pulsating star, but different pulsation periods have been published (e.g. Lèbre et al. 1996). Limited abundance analyses have already been performed by Parthasarathy et al. (1992) and by Klochkova (1995), showing chemical evidence for the post-AGB status of this object. However, the high quality NTT-spectra for this star permitted us to elaborate a much more detailed abundance analysis. We used 342 lines of 27 different ions.
A comparison with the results of Klochkova shows good consistency of the model parameters, the metallicity and the abundances of ions common in both analyses. However, the latter author found a much larger abundance if deduced from lines of neutral atoms than from lines of singly ionized atoms of the same element. This was attributed to unknown non-LTE effects. We do not confirm this result since careful analysis of our much higher S/N spectra does not reveal the presence of most neutral lines, while we identified some lines differently. This illustrates that it is often very difficult to assign uncertain LTE abundance results of an individual object solely to non-LTE effects. Also the effect of other uncertainties should be carefully studied and a more systematic approach using data on several objects should be initiated to evaluate possible non-LTE deviations of specific lines.
The ionization equilibrium of Ni is also fulfilled but for Cr we find a . A lower model gravity can solve this inconsistency for Cr but it may also indicate non-LTE occupation numbers for the different ions of Cr. We chose not to change our model parameters in order not to compromise significant comparison with the other stars in our sample.
A problem occurred when calculating the Fe abundance from lines of neutral iron with a very low excitation potential: the lines with a very small lower excitation potential gave systematically lower abundances. This is a strong indication that non-LTE over-excitation occurs. We therefore discarded all FeI-lines with an excitation potential eV in our abundance determinations, also for all other programme stars.
The large line-to-line scatter in the abundance of Y and Zr is solely caused by only three lines of Y (578.169 nm, 550.990 nm and 528.982 nm), and two lines of Zr (448.545 nm and 449.546 nm). These lines do not show any systematic trend with another atomic parameter (wavelength, excitation potential, equivalent width), so the anomalies are probably caused by inaccurate -values. The only line in common with the other stars is the Y II-line at 528.982 nm in IRAS22223. Also for this star, the abundance inferred from this line is significantly lower than the abundances inferred from the other lines.
We also detected several lines of singly ionised Hafnium (Z=72) in the blue part of the spectrum of IRAS07134, but only two of them turned out to be unblended (409.316 nm, mÅ and 466.414 nm, mÅ). Unfortunately, the Hf-abundance derived from these two lines differs by 0.4 dex ( and 2.09 respectively). These abundances are both very high if compared with the calculations of Malaney (1987). We expect for a neutron exposure of mb-1 (neutron exposure: see Sect. 6). No other possible identification could, however, be found. An interpretation of this result is difficult, not only because of the probably inaccurate -values, but also because of the unknown chemical history of this r-process element.
5.4 IRAS 195001709 = HD 187885
This post-AGB candidate shows only a weak 21m feature (Justtanont et al. 1996) which is probably an effect of the higher temperature of this object. We already published an abundance analysis of this object (Van Winckel et al. 1996a) based on ESO La Silla spectra. The latter spectra show He I lines at 447.08 nm and 587.6 nm pointing to a hot source. Indeed, demanding excitation equilibrium of the Fe I-lines yielded a temperature Teff=8000K.
In this study we present a new analysis (Table 5) based on UES-spectra with a higher S/N and a broader spectral coverage. The analysis of the iron lines yielded the same atmospheric parameters, only the -abundance diagram points to a larger microturbulent velocity . The lines of the the s-process elements Y and Zr favour a slightly lower value of . We again keep the atmospheric parameters obtained using the iron lines. A change in the microturbulent velocity of 1 will only influence the abundance deduced from the largest lines (mÅ) with a typical value of 0.1 dex.
Comparing this analysis with our previous one, there are some quantitative differences, but our conclusions for this star remain unchanged. The s-process overabundance is now much better established, with more lines for the ls-elements and new abundances for the hs-elements La, Ce, Nd and Eu.
We report also for this star the detection of a line of singly ionised Hafnium at 409.316 nm. An equivalent width mÅ gives an abundance of which is again quite high if compared with the calculations of Malaney (1987). We expect for a mb-1. Another argument against such a high Hf-abundance is the non-detection of the Hf II line at 369.973 nm. Using the obtained abundance and the -values of the VALD2 database, this line should have an equivalent width of mÅ. Inaccurate -values can be the cause of this inconsistency. Other possibly detectable Hf II lines are all heavily blended.
5.5 IRAS 22223+4327
The chemical composition of this star was recently discussed by Decin et al. (1998). We list the individual abundances here again since minor differences are obtained due to an upgrate of the line-list and a homogenization of the atomic data.
5.6 IRAS 23304+6147
Kwok et al. (1989) classified this object as a proto-planetary nebula and discovered its 21m feature. The circumstellar dust turned out to be C-rich as confirmed by several authors: detection of C2, C3 (Hrivnak 1995), CO, HCN (Omont et al. 1993), CN (Bakker et al. 1997) and non-detection of OH (Likkel 1989). Hrivnak et al. (1999) found the object to be resolved in V with an extent of about 2 arcsec. Reddy & Parthasarathy (1996) derived model parameters for this object by fitting a Kurucz model atmosphere through the observed spectral energy distribution. This technique yielded Teff=5000K and =1.0. Comparing our spectra with the other stars in our sample, we concluded that this temperature was probably too low : the high excitation O-triplet around 615.6nm is clearly detected (see Fig. 2). Indeed, also our spectroscopic determination of the temperature using the iron-lines resulted in a Teff=6750K. The abundance analysis makes IRAS23304 join the group of post-AGB stars that clearly display chemical evidence of their post 3rd dredge-up character.
To our knowledge, this is the first detailed photospheric abundance study of this star. The internal scatter of the four O-lines is small indicating that the very high C/O ratio of 2.9 is probably real. For the metallicity, we find the value [Fe/H]=0.8. The other iron peak elements do follow this deficiency. Again, the s-process abundances are quite impressive for this star. Note that the internal scatter of the different abundance determinations are somewhat higher for this star than for the other programme stars as a consequence of the lower S/N of our spectra (mv=13.1).
6 Neutron exposure of 21m stars
6.1 Goodness-of-fit
A theoretical parameter describing the neutron irradiation is the neutron exposure rate , which is defined as where is the neutron density, and is the relative velocity of the neutrons relative to the seed nuclei. The thermal pulses on the AGB are normally modelled by an exponential irradiation parameterized by a mean neutron exposure (e.g. Ulrich 1973). In most calculations, the neutron density and the fraction of the inter-shell material that remains exposed to neutrons are adopted as constants. The efficiency of s-processing is then indicated by one parameter .
The neutron exposure is intimately related to the [hs/ls] index: a large yields a large [hs/ls]. In order to estimate quantitatively, we used the theoretical models of Malaney (1987) and the ’goodness of fit’ procedure as defined by Cowley & Downs (1980). A description of this method can also be found in Vanture (1992) and Smith et al. (1996). In this method, the quantity is defined as
where is the number of s-process elements involved in the comparison, the observed abundance of element , the predicted model abundance as tabulated by Malaney, the average offset between the observed and the predicted s-process abundances () and is the uncertainty on the obtained individual abundance . and are calculated as described in Decin et al. (1998) so on top of the internal accuracy a fixed value of 0.3 was quadratically added to account for the uncertainties on the model atmosphere parameters and eventual systematic offsets in the log(gf) values. The values for for each model and each star are listed in Table 6. A graphical presentation of the best fit for two stars (IRAS07134 and IRAS05341) can be found in Fig. 6. Note that the S2 are small which indicates a good consistency between the abundances of different s-process elements (see Smith, 1984).
| (mb-1) | [hs/ls] | |||||
| 0.1 | 0.2 | 0.3 | 0.4 | 0.5 | ||
| 0.6 | 0.7 | 0.8 | 0.9 | 1.0 | ||
| IRAS22223 | 1.55 | 0.45 | 0.55 | 0.76 | 0.95 | |
| 1.11 | 1.23 | 1.35 | 1.44 | 1.51 | 0.5 | |
| IRAS19500 | 1.29 | 0.34 | 0.70 | 1.09 | 1.42 | |
| 1.65 | 1.85 | 2.03 | 2.17 | 2.27 | 0.4 | |
| IRAS04296 | 2.35 | 0.80 | 0.74 | 0.89 | 1.05 | |
| 1.18 | 1.28 | 1.39 | 1.48 | 1.54 | 0.2 | |
| IRAS07134 | 1.95 | 0.61 | 0.58 | 0.73 | 0.88 | |
| 0.99 | 1.10 | 1.19 | 1.26 | 1.32 | 0.1 | |
| IRAS23304 | 3.36 | 1.17 | 0.76 | 0.72 | 0.75 | |
| 0.78 | 0.82 | 0.87 | 0.91 | 0.94 | +0.1 | |
| IRAS05341 | 4.09 | 1.28 | 0.60 | 0.39 | 0.31 | |
| 0.29 | 0.28 | 0.28 | 0.29 | 0.30 | +0.4 | |

The connection between and [hs/ls] is clear. Note also that for the stars with a low [hs/ls] the minimum of and so the neutron exposure is well defined. For stars with a higher [hs/ls], a larger range of values for are possible: a high neutron exposure will only raise the overall level of enhancement without significantly changing the distribution of the individual abundances (see also Fig. 9). Therefore, the s-process distribution of IRAS05341 fits well for every .
6.2 Total s-process enrichment of 21m stars.
In Fig. 7 the [hs/ls] index from the 21m stars is shown in comparison with the overall s-process enrichment as parameterised by the [s/Fe]-index. More objects should clearly be studied, but the total neutron exposure is surprisingly strongly correlated with the total enrichment of s-process elements in the 21m stars, with more enriched objects showing also a stronger total neutron irradiation! A simple linear least-squares fit gives a high correlation coefficient of +0.96 with the fit
Since the asymptotic distribution of s-process elements is probably reached in carbon stars (Busso et al. 1995), the [hs/ls] index will not change with increasing dredge-up of enriched material in the stellar envelope, making the [hs/ls] index independent of the dilution factor of the enriched material by the initial stellar envelope material. The [hs/ls] correlation with [s/Fe] therefore reflects a different and more efficient internal nucleosynthesis, with increasing dredge-up efficiency ! In AGB evolutionary models, the inclusion of protons into the intershell will create a primary 13C pocket and induce the neutron production. Fig. 7 indicates therefore that, with increasing dredge-up efficiency, also the dredge-in of protons will increase, giving rise to a higher neutron irradiation.

6.3 Metallicity.
Although our sample at this point only consists of 6 objects, a considerable spread in metallicity ranging from 0.3 to 1.0 is observed. Since the 13C(,n)16O neutron source in AGB stars is most likely of primary origin the [hs/ls] index should increase with decreasing metallicity due to the larger amount of neutrons per iron seed nucleus (e.g. Clayton 1988). This assumes, however, that the diffusion of protons into the C-rich layer itself is independent of metallicity or on parameters linked to the metallicity (like temperature profile, luminosity etc.). A higher neutron exposure is therefore expected for low metallicity objects assuming that the thermal pulse phenomenon itself is independent of metallicity.
In Fig. 8 we display the [hs/ls]-index in function of the metallicity. The 21m stars clearly cover a wide range in neutron irradiation in the range of the observed iron abundances with indeed a inverse dependence of the [hs/ls] ratio on metallicity. The correlation is, however, broad with a large intrinsic spread (the simple correlation coefficient is 0.67). The most metal deficient object IRAS07134 has seem to have undergone a much smaller neutron irradiation than the less metal deficient IRAS05341. Clearly, also other stellar parameters determine the internal AGB nucleosynthesis during the AGB evolution.
Note that the two stars significantly below the least-square line are the ones for which we detected the very heavy element Hf (Z=72). If indeed these high abundances turn out to be true, this would indicate that the s-process is able to produce elements heavier than the Ba peak and thus probably up to the lead-peak! If true, the low [hs/ls]-index of the two stars might be due to the production of very heavy elements. It is clear that high S/N blue spectra of all the objects are needed for a more detailed discussion.

Moreover, several (probably single) post-AGB objects are known which do not show s-process enrichment nor enhanced C/O ratios. These objects include HD 161796 ([Fe/H]=0.3; Luck et al., 1990), HD 133656 ([Fe/H]= 1.0; Van Winckel et al. 1996b) and SAO 239853 ([Fe/H]= 0.8, Van Winckel 1997) which show very similar metallicities and IR-excesses. Unfortunately, like the 21m objects they are too far for reliable HIPPARCOS parallaxes so the luminosity differences between the enriched and non-enriched objects is an as yet unknown but probable key parameter in this discussion.
7 Comparison with intrinsic and extrinsic enriched stars.
7.1 Intrinsic enriched objects: AGB stars
In this section we compare our results on 21m sources with the observational data on the intrinsic AGB stars of the M-MS-S-MC-C sequence. For MS and S stars we used results from the series of papers by Smith & Lambert (1985,1986,1990) and Smith et al. (1987) : since the spectra of oxygen rich AGB stars are dominated by strong TiO-bands, only a few spectral windows can be used to infer abundances from atomic lines. The regions in between 740 and 758 nm, and 998 to 1010 nm, were used together with additional IR spectra around 1.6, 2.2 and 4.0 m to deduce abundances of CNO isotopes. The situation is even worse for C stars where the C2 and CN bands dominate the optical and IR spectrum. To our knowledge only Utsumi (1985 and references therein) made a quantitative analysis of the s-process enhancement in C stars using two small spectral windows with minimal molecular absorption (475–490 nm, and 440–450 nm). SC stars, on the other hand, are AGB stars with a C/O ratio close to 1.0 making the oxide bands and bands from carbon molecules very weak or absent so that many atomic lines become detectable in the spectrum. We use the results for seven SC stars from a recent paper by Abia & Wallerstein (1998).
In Fig. 9 we compare the observed overabundances of the light s-process elements ([ls/Fe]) with the ones observed in intrinsic AGB stars. Since there is strong observational evidence that the 21m stars are post-carbon stars, it is no surprise that the overabundances of the s-process elements in 21m stars are indeed large in comparison with MS, intrinsic S and SC stars and are comparable with and on average even slightly higher than observed in C stars. We therefore can confirm earlier results that the increasing C/O ratio in the MS-S-SC-C sequence is also reflected in an increasing enhancement of s-process elements (e.g. Smith & Lambert 1990; Abia & Wallerstein 1998).

7.2 Extrinsic enriched objects
To investigate the metallicity dependence of the integrated neutron exposure for intrinsic AGB stars is not easy since the metallicity of field carbon stars is very difficult to determine and the spread in metallicities observed in Galactic M-MS-S-SC stars is not large (e.g. Smith & Lambert 1990). Plez et al. (1993) have shown, however, that seven intrinsic AGB stars in the metal poor ([Fe/H] = 0.5) Small Magellanic Cloud do indeed show a very high neutron exposure and they suggest that it is not intrinsic to the SMC but due to the low initial metallicity.
The metallicity spread observed in the extrinsic enriched objects is much larger and there is growing observational evidence that the [hs/ls] index is indeed anti-correlated with metallicity (e.g. Smith 1999): Busso et al. (1995) confirmed earlier suggestions by Luck & Bond (1991) in a compilation of literature values of the [hs/ls] index in Ba stars and MS-S stars and quantified tentatively the metallicity dependence of the neutron irradiation as an increase in [hs/ls] of about 0.2 dex for a metallicity drop from 0 to 0.5. Strong support came also from the work by Vanture (1992) who has shown that the neutron irradiation is high in the metal-poor CH giants, thus enlarging the metallicity spread to lower metallicities. North et al. (1994) also found that the [hs/ls] index was correlated with the metallicity in a sample of CH-subgiants. Finally also the low metallicity yellow symbiotics, who recently were included in the Ba-star family, show s-process distributions characterised by a relatively high neutron irradiation (Smith et al. 1996, 1997; Pereira et al. 1998). The results obtained by Luck & Bond (1991) included, however, 4 metal deficient objects with small overabundances showing a very weak neutron irradiation. They dubbed these stars “the metal-deficient Ba stars”.
Some caution should be expressed by generalising these results to single star AGB evolution : especially for the short orbital period binaries there is strong evidence that the binarity affects the mass-loss and thus the AGB evolution itself of these binaries. The amount of thermal pulses and the characteristics of the s-process synthesis might therefore also be affected by the orbital elements (e.g. Jorissen & Mayor 1988).
In Fig. 10 we compare the [hs/ls] index in function of the metallicity with the values found in the literature for other s-process enriched objects. This compilation is difficult since the definition of the hs and ls indices is author-dependent. We scaled the abundances to the definition given in section 4.4. For undetermined abundances of the CH giants, we used the tables of Malaney (1987) with a of 1.0 mbarn-1 which is more appropriate for those objects, while for the others we used 0.4 mbarn-1 tables. We discarded objects for which less than 4 abundances of the in total 7 elements (Sr, Y, Zr, Ba, La, Nd and Sm) were available.

Fig. 10 shows that there is a large spread in the integrated neutron irradiation, but that there is indeed a global increase with decreasing metallicities from [Fe/H] 0.5 downwards as already noted by several authors (e.g. Smith, 1999). Three out of four “metal-deficient Ba stars” show a very low [hs/ls]-index (Luck Bond, 1991). These stars certainly are worth a re-analysis based on higher resolution, higher signal-to-noise spectra since the internal errors of the analysis based on photographic intermediate resolution (0.2 Å) spectra are rather large and the observed overabundances small (Luck & Bond, 1991). Some CH-stars show extremely high [hs/ls]-indices for their metallicity but also some Ba stars like the very Nd-rich HD 35155 (not in the figure) show a-typical values. The 21m post-AGB objects follow the same trend as the CH-subgiants of the same metallicity and show on average a somewhat lower [hs/ls]-index compared to the Ba giants.
We can conclude that the metallicity dependence of the neutron exposure has a large intrinsic spread which confirms that certainly also other fundamental parameters determine the internal nucleosynthesis and dredge-up phenomena during the AGB evolution.
8 Conclusions
We presented a homogeneous study of abundances displayed by a sample of carbon-rich 21m post-AGB stars. With their low metallicity ([Fe/H] ranging from 0.3 to 1.0), high C/O ratio (ranging from 1.0 to 2.9) and especially their high photospheric abundance of s-process elements, we confirm that they are post-3rd-dredge-up objects. Since also the circumstellar environment is C-rich and no orbital motion is observed we can classify the 21m stars as single post-carbon stars of low initial mass.
The G–F spectral type makes that a wide variety of s-process elements can be detected by their atomic lines. This, together with their significant spread in metallicity, make that the 21m stars are ideal objects to constrain the AGB nucleosynthesis and dredge-up models. The most interesting constraint in this context comes from the possibility to accurately determine a wide variety of elemental abundances of these intrisically enriched objects. Contrary to AGB stars themselves, no photospheric molecular absorption is observed, so isotopic ratios of key elements are in the 21m stars unfortunately difficult to determine. The molecular bands originating in the circumstellar environment can, however, be used for some isotopes like 12C and 13C (e.g. Bakker & Lambert 1998a).
We can summarise the main conclusions with respect to the s-process nucleosynthesis displayed by 21m stars as follows :
-
•
The 21m stars display a wealth of atomic lines from s-process elements. The photospheric spectrum of stars like IRAS05341 is even completely dominated by atomic lines of heavy elements. The observed overabundances of s-process elements in the analysed 21m stars are large and range from [ls/Fe] = 1.3 to 1.9 which make the 21m stars among the most s-process enriched objects known.
-
•
The 21m stars display a wide variety of integrated neutron irradiation as parameterised by the observational [hs/ls]-index, corresponding to a neutron exposure from = 0.2 to 0.8 mbarn-1.
-
•
The [hs/ls] index displayed by the 21m stars is strongly correlated (classical correlation coefficient of +0.96) with the total enrichment of the s-process elements as parameterised by the [s/Fe]-index, in the sense that more enriched objects also display a higher integrated neutron irradiation. Since in carbon stars the asymptotic values of the s-process distribution is probably reached, this means that the dredge-up efficiency is strongly linked with the neutron production in the intershell !
-
•
The anti correlation of the [hs/ls] index with the metallicity of the 21m objects is less well determined (classical correlation coefficient 0.67) and contains a large scatter. This scatter is certainly intrinsic and confirms that also other fundamental parameters determine the internal nucleosynthesis and dredge-up phenomena during the AGB evolution. Note that the 21m stars are the only intrinsically enriched objects for which a wide range in metallicity is observed.
-
•
Compared with other s-process enriched objects of extrinsic nature, the neutron exposure displayed by the 21m stars fall roughly in the same range as the CH subgiants and is on average lower than it is in Ba-giants of the same metallicity. Note that the metallicity dependence of the neutron exposure displayed by intrinsic and extrinsic objects contains also a large intrinsic scatter. Especially the iron deficient Ba stars as defined by Luck & Bond (1991) should be analysed in great detail since they display a very low neutron irradiation for their low metallicity.
We can conclude that a homogeneous detailed study of the 21m stars forms a very useful complement to other types of s-process enriched objects (intrinsic AGB stars and extrinsic enriched objects) used in the observational study of the theoretically less well understood s-process nucleosynthesis, mass-loss and dredge-up phenomena occurring on the AGB.
Acknowledgements.
The authors would like to thank the staff of the NTT and WHT telescopes for the welcome support during the observations. It is a pleasure to acknowledge the Vienna Atomic Line Database (VALD2) for the usefull data-set and Prof. Kurucz for the distribution of his software. Also Eric Bakker is warmly acknowledged for providing some of the spectra as well as Christoffel Waelkens and Nami Mowlavi for stimulating discussions. HVW and MR acknowledge support from the Fund of Scientific Research, Flanders.References
- (1) Abia C., Wallerstein G., 1998, MNRAS293, 89
- (2) Bakker E.J., Lambert D.L., 1998a, ApJ502, 417
- (3) Bakker E.J., Lambert D.L., 1998b, ApJ508, 387
- (4) Bakker E.J., Waters L.B.F.M., Lamers H.J.G.L.M., et al., 1996, A&A 310, 893
- (5) Bakker E.J., Van Dishoeck E.F., Waters L.B.F.M., Schoenmaker T., 1997, A&A 323, 469
- (6) Biehl D., 1976, PhD thesis, Univ. Kiel
- (7) Biémont E., Hibbert A., Godefroid M., Vaeck N., Fawett B.C., 1991, ApJ375, 818
- (8) Biémont E., Hibbert A., Godefroid M., Vaeck N., 1993, ApJ412, 431
- (9) Blackwell D.E., Shallis M.J., Simmons G.J., 1980, A&A 81, 340
- (10) Bujarrabal V., Alcolea J., Planesas P., 1992, A&A 257, 701
- (11) Busso M., Gallino R., Lambert D.L., Raiteri C.M., Smith V.V., 1992, ApJ399, 218
- (12) Busso M., Lambert D.L., Beglio L., et al., 1995, ApJ446, 775
- (13) Clayton D.D., 1988, MNRAS234, 1
- (14) Cowley C.R., Downs P.L., 1980, ApJ236, 648
- (15) Dayal A., Hoffmann W.F., Bieging J.H., et al., 1998, ApJ492, 603
- (16) Decin L., Van Winckel H., Waelkens C., Bakker E.J., 1998, A&A 332, 928
- (17) Edvardsson B., Andersen J., Gustafsson B., et al., 1993, A&A 275, 101
- (18) Frost C.A., Lattanzio J.C., 1996, ApJ473, 383
- (19) Fuhr J.R., Martin G.A., Wiese W.L., 1988, Journal of Physical and Chemical Reference Data, Volume 17, Supplement No. 4
- (20) Gallino R., Arlandini C., Busso M., et al., 1998, ApJ497, 38
- (21) Geballe T.R., Van Der Veen W.E.C.J., 1990, A&A 235, L9
- (22) Gonzalez G., Lambert L., Giridhar S., 1997, ApJ481, 452
- (23) Grevesse N., 1989, in AIP Conferences Series 183 : “Cosmoc Abundances of Matter”, ed C.J. Waddington, American Institute of Physics, New York, p.9
- (24) Herwig F., Blöcker T., Schönberner D., El Eid M., 1997, A&A 324, L81
- (25) Hibbert A., Biémont E., Godefroid M., Vaeck N., 1991, A&ASS 88, 505
- (26) Hibbert A., Biémont E., Godefroid M., Vaeck N., 1993, A&ASS 99, 179
- (27) Hrivnak B.J., 1995, ApJ438, 341
- (28) Hrivnak B.J., Kwok S., 1999, ApJ513, 869
- (29) Hrivnak B.J., Langill P.P., Su H.Y.L., Kwok S., 1999, ApJ 513, 421
- (30) Jorissen A., 1999, in : IAU Symp. 191 “AGB stars”, Le Bertre T., Lèbre A., Waelkens C. (eds.), 437
- (31) Jorissen A., Arnould M., 1989, A&A 221, 161
- (32) Jorissen A., Mayor M., 1988, A&A 198, 187
- (33) Jorissen A., Frayer D.T., Johnson H.R., Mayor M., Smith V.V., 1993, A&A 271, 463
- (34) Justtanont K., Barlow M.J., Skinner C.J., et al., 1996, A&A 309, 612
- (35) Klochkova V.G., 1995, MNRAS272, 710
- (36) Klochkova V.G., Szczerba R., Panchuk V.E., Volk K., 1999, A&A 345, 905
- (37) Knapp G.R., Sutin B.M., Phillips T.G., et al., 1989, ApJ336, 822
- (38) Kupka F., Piskunov N.E., Ryabchikova T.A., Stempels H.C., Weiss W.W., 1999, A&A submitted
- (39) Kurucz R.L., 1993, CD-ROM set, Cambridge, MA : Smithsonian Astrophysical Observatory
- (40) Kwok S., Volk, K.M., Hrivnak, B.J., 1989, ApJ345, 51
- (41) Kwok S., Hrivnak B.J., Geballe T.R., 1995, ApJ454, 394
- (42) Kwok S., Volk K., Hrivnak B.J., 1999, in : IAU Symp. 191 “AGB stars”, Le Bertre T., Lèbre A., Waelkens C. (eds.), 297
- (43) Lambert D.L., 1989, in AIP Conferences Series 183 : “Cosmoc Abundances of Matter”, ed C.J. Waddington, American Institute of Physics, New York, p.168
- (44) Lambert D.L., Smith V.V., Busso M., Gallino R., Straniero O., 1995, ApJ450, 302
- (45) Lambert D.L., Heath J.E., Lemke M., Drake J., 1996, ApJ103, 183
- (46) Langer N., Heger A., Wellstein S., Herwig F., 1999, A&A 346, L37
- (47) Lèbre A., Mauron N., Gillet D., Barthes D., 1996, A&A 310, 923
- (48) Likkel L., 1989, ApJ344, 350
- (49) Likkel L., Forveille T., Omont A., Morris M., 1991, A&A 246, 153
- (50) Luck R.E., Bond H.E., 1991, ApJS 77, 515
- (51) Luck R.E., Bond H.E., Lambert D.L., 1990, ApJ357, 188
- (52) Malaney R.A., 1987, Ap&SS 137, 251
- (53) Martin G.A., Fuhr J.R., Wiese W.L., 1988, Journal of Physical and Chemical Reference Data, Volume 17, Supplement No. 3
- (54) McWilliam A., 1997, ARA&A35, 503
- (55) McWilliam A., Preston G.W., Sneden C., Searle L., 1995, AJ109, 2757
- (56) Meixner M., Skinner C.J., Graham J.R., et al., 1997, ApJ482, 897
- (57) Mowlavi N., 1999, A&A 344, 617
- (58) Mowlavi N., Jorissen A., Arnould M., 1998, A&A 311, 803
- (59) North P., Berthet S., Lanz T., 1994, A&A 281, 775
- (60) Omont A., Loup C., Forveille T., et al., 1993, A&A 267, 515
- (61) Oudmaijer R.D., Bakker E.J., 1994, MNRAS271, 615
- (62) Parthasarathy M., Garcia Lario P., Pottasch S.R., 1992, A&A 264, 159
- (63) Pereira C.B., Smith V.V., Cunha K., 1998, AJ116, 1977
- (64) Plez B., Smith V.V., Lambert D.L., 1993, ApJ418, 812
- (65) Reader J., Corliss C.H., Wiese W.L., Martin G.A., 1980, NSRDS-NBS 68, 1
- (66) Reddy B.E., Parthasarathy M., 1996, AJ112, 2053
- (67) Reddy B.E., Parthasarathy M., Gonzalez G., Bakker E.J., 1997, A&A 328, 331
- (68) Smith V.V., 1984, A&A 132, 326
- (69) Smith V.V., 1999, in: IAU symp. 191 “ AGB stars ”, Le Bertre T., Lèbre A., Waelkens C. (eds.), ASP conference series, 69
- (70) Smith V.V., Lambert D.L., 1985, ApJ294, 326
- (71) Smith V.V., Lambert D.L., 1986, ApJ311, 843
- (72) Smith V.V., Lambert D.L., 1990, ApJS 72, 387
- (73) Smith V.V., Lambert D.L., McWilliam A., 1987, ApJ320, 862
- (74) Smith V.V., Cunha K., Jorissen A., Boffin H.M.J., 1996, A&A 315, 179
- (75) Smith V.V., Cunha K., Jorissen A., Boffin H.M.J., 1997, A&A 324, 97
- (76) Straniero O., Gallino R., Busso M., et al., 1995, ApJ440, L85
- (77) Thévenin F., 1989, A&AS 77, 137
- (78) Thévenin F., 1990, A&AS 82, 179
- (79) Ulrich R.K., 1973, in: D.N. Schramm & W.S. Arnett (eds) Explosive Nucleosynthesis. Austin. University of Texas Press, p. 139
- (80) Utsumi K., 1985, in : M. Jashek & P.L. Keenan (eds) Cool Stars with Excesses of Heavy Elements. Reidel, Dordrecht, p. 243
- (81) Van Eck S., Jorissen A., Udry S., Mayor M., Pernier B., 1998, A&A 329, 971
- (82) Vanture A.D., 1992, AJ104, 1997
- (83) Van Winckel H., 1997, A&A 319, 561
- (84) Van Winckel H., 1999, in : IAU Symp. 191 “AGB stars”, Le Bertre T., Lèbre A., Waelkens C. (eds.), 465
- (85) Van Winckel H., Waelkens C., Waters L.B.F.M., 1996a, A&A 306, L37
- (86) Van Winckel H., Oudmaijer R.D., Trams N.R., 1996b, A&A 312, 553
- (87) Venn K.A., 1995, ApJS 99, 659
- (88) Volk K., Kwok S., Hrivnak B.J., 1999, ApJ516, L99
- (89) Wheeler J.C., Sneden C., Truran J.W.Jr., 1989, ARA&A27, 279
- (90) Wiese W.L., Smith M.W., Glennon B.M., 1966, NSRDS-NBS, Vol I, 4
- (91) Woodsworth A.W., Kwok S., Chan S.J., 1990, A&A 228, 503
- (92) Začs L., Klochkova V.G., Panchuk V.E., 1995, MNRAS275, 764