Bent-Double Radio Sources: Tracers of High-Redshift Clusters111Based in part on observations obtained at the W. M. Keck Observatory
Abstract
Bent-double radio sources can act as tracers for clusters of galaxies. We present imaging and spectroscopic observations of the environments surrounding ten of these sources (most of them Wide Angle Tails (WATs)) selected from the VLA survey. Our results reveal a previously unknown cluster associated with eight of the radio sources with redshifts in the range ; furthermore,we cannot rule out that the other two bent doubles may be associated with clusters at higher redshift. Richness measurements indicate that these clusters are typical of the majority of those found in the Abell (1958) catalog, with a range of Abell richness classes from 0 to 2. The line-of-sight velocity dispersions are very different from cluster to cluster, ranging from approximately 300 to 1100 km s-1. At the upper end of these intervals, we may be sampling some of the highest-redshift massive clusters known. Alternatively, the large velocity dispersions measured in some of the clusters may indicate that they are merging systems with significant substructure, consistent with recent ideas concerning WAT formation (Burns et al. 1994).
1 Introduction
Clusters of galaxies are the largest gravitationally bound structures in the universe and provide well-equipped laboratories for the study of galaxy formation and evolution, as well as a testing ground for the estimation of cosmological parameters. Thousands of clusters have been identified at redshifts but for , the number of spectroscopically confirmed clusters dwindles to less than approximately one hundred. With 30,000 galaxies deg-2 at 24th magnitude in the V-band and fewer than 50 clusters deg-2 at this limit out to a redshift of 1.0 (Postman 1993), identification of high-redshift clusters from optical images of the sky is a difficult task. Nonetheless, most known clusters, including those with , have been discovered in optical surveys (Abell 1958; Zwicky et al. 1968; Gunn, Hoessel & Oke 1986; Couch et al. 1991; Postman et al. 1996). The clusters detected in the earlier surveys were selected visually, while Postman et al. (1996) used an automated technique for the Palomar Distant Cluster Survey (PDCS) in which clusters were detected as simultaneous over-densities in positional and brightness distributions. Both types of optical surveys suffer from misclassifications due to the superposition of foreground and background galaxies, although the PDCS technique significantly reduces this effect. At longer wavelengths, searching in the near-IR reveals high clusters as overdensities of very red galaxies: Stanford et al. (1997) used this method to locate one of the most distant clusters known with several spectroscopically confirmed members at .
Other groups have found distant clusters by searching in the X-ray band, detecting directly the diffuse hot gas which dominates the visible matter in most clusters. The main drawback to this approach is the limited sensitivity of large-area X-ray surveys, especially given the possibility that distant clusters are intrinsically dimmer than nearer ones (Henry et al. 1992; Gioia et al. 1990a), although evolution in the X-ray luminosity function out to is far from established (Rosati et al. 1998). Only six of the 104 clusters in the Einstein Extended Medium Sensitivity Survey (EMSS) have (Luppino & Gioia 1995; Stocke et al. 1991; Gioia et al. 1990b). The ROSAT all-sky survey has not uncovered many clusters and several groups have resorted to conducting serendipitous surveys of deeper ROSAT pointings. For example, Rosati et al. (1998) find evidence for 95 clusters out to ( with ) in a 48 deg2 area using a wavelet-based detection algorithm. Other ROSAT-based surveys – including WARPS (Wide-Angle ROSAT Pointed x-ray Survey, Scharf et al. 1997), SHARC (Serendipitous High-Redshift Archival ROSAT Cluster survey, Burke et al. 1997, Romer et al. 1999), and the survey by Vikhlinin et al. (1998) – are finding several clusters beyond in addition to many lower redshift systems.
With increasing redshift, optical and X-ray surveys become less effective and a targeted approach to finding clusters is warranted. Another technique for finding clusters is to examine the environments of radio galaxies. Dickinson (1996) has identified clusters around powerful 3C sources at redshifts greater than 1.2. In a similar manner, Deltorn et al. (1997) discovered a cluster of galaxies around 3CR 184 at . Clusters of varying richness have also been seen around the radio galaxies studied by Hill & Lilly (1991 – hereafter H&L91) and by Zirbel (1997 – hereafter Z97), among others. However, certain types of radio galaxies are more often associated with clusters than others, and are therefore more efficient tracers of these high-density environments.
Over two decades ago, Fanaroff & Riley (1974) discovered a correlation between the power of an extended radio source and its morphology and they divided all such sources into two classes. FR I radio galaxies typically have powers less than at 1440 MHz (assuming a power law spectrum with ) and are brightest at their cores, with their lobes fading toward the edges. FR II’s have with dim or absent cores and edge-brightened lobes. More recent work has shown that the dividing line in power between FR I’s and II’s isn’t so sharp, with examples of each crossing the line (Ledlow & Owen 1996). In addition, Ledlow & Owen (1996) found that the break in radio power is a function of optical brightness with higher power FR I’s hosted by optically brighter galaxies.
Recent work (H&L91, Z97) has shown that FR I and II radio galaxies are associated with different types of host galaxies located in different environments on the megaparsec scale. FR I sources are associated with elliptical galaxies with a wide range of optical magnitudes (Ledlow & Owen 1995). Powerful FR I sources (those near the FR I/II break such as the WATs and NATs discussed below) are often associated with cD or double nuclei elliptical galaxies found in rich groups or clusters at both low and high redshift (up to z 0.5, the limit of current studies). FR II sources are usually associated with N galaxies or disturbed ellipticals and are found in poor groups at low-z; at higher redshifts (), groups surrounding FR II’s appear to be richer by a factor of .
A source’s radio morphology may become distorted as a consequence of the relative motion between the host galaxy and the surrounding intracluster medium (ICM) or via interaction with a neighboring galaxy. Common distortions in FR I sources are wide angle tail (WAT) and narrow angle tail (NAT) morphologies which have large and small opening angles, respectively, and are caused by interaction with the ICM. The classical explanation for the bending of the lobes is the ram pressure exerted by the ICM as a galaxy with a significant peculiar velocity moves through a cluster (Owen & Rudnick 1976). An alternate explanation (Burns et al. 1996; Roettiger, Burns, & Loken 1996; Burns et al. 1993) is that it is the ICM that is moving and not the galaxy, since WATs are often associated with cD galaxies which may have small peculiar velocities relative to the immediately surrounding cluster. In this scenario, the ICM is set in motion by the merging of clusters or smaller sub-clumps evidenced by the alignment of X-ray emission contours with the bending of the lobes (Gómez et al. 1997), and the cD then has a larger peculiar velocity relative to the merging system as a whole. FR II sources may also become distorted; sometimes the distortions appear symmetric and may result from ICM interaction, whereas at other times the sources have asymmetric ’dog-leg’ appearances that are likely caused by interaction with a neighboring galaxy (Rector, Stocke, & Ellingson 1995).
Since FR I galaxies are located in groups or clusters at all epochs explored to date, they are markers of the high-density Universe. Bent (WAT or NAT) FR I radio galaxies may be signposts for rich clusters (rather than groups), since a dense ICM is needed to distort the lobes. Symmetrically bent, FR II galaxies may also be tracers of clusters at high redshifts where the richness of FR II environments is known to increase in general. Indeed, FR II’s may be important in finding very high- clusters because they have higher luminosities and are therefore visible at larger distances than FR I’s in any flux-limited survey. Hintzen et al. (1991) proposed looking for clusters associated with distorted double-lobed quasars at redshifts up to 1.5. His sample was limited to high-power, FR II sources, around which he found suggestive overdensities within a radius of 15′′.
In this paper, we describe a new search for moderate- and high-redshift clusters using a sample of bent-double radio galaxies selected from the VLA (Faint Images of the Radio Sky at Twenty-cm) survey (Becker, White, & Helfand 1995) as tracers of cluster environments. We demonstrate that a high efficiency (80%) can be achieved during the spectroscopic phase of distant cluster identification using our combined radio and optical selection criteria, and show that clusters with redshifts up to are easily detected. In §2, we describe the process we have followed to extract a bent double sample from the radio images and then present (§3.1) the optical imaging observations from which we selected candidate clusters for follow-up spectroscopy. In §3.2, we describe the Keck slit-mask spectroscopic observations of ten fields which led to the detection of at least eight clusters with redshifts ranging from 0.33 to 0.85. Section 4 describes the radio source properties and presents a detailed discussion of the velocity dispersions and the richness of the clusters in which they are found. We conclude with a summary of our results (§5).
We use km s-1 Mpc-1 and throughout this paper.
2 Sample
Our sample of radio galaxies was selected from the survey currently being undertaken at the VLA using the B configuration. The survey is projected to cover the 10,000 deg2 of the North Galactic Cap plus a supplementary region between and Dec in the range 21.5R.A.3.5 h. The peak flux density threshold is 1.0 mJy at 20 cm, the angular resolution is 5′′, and the astrometric accuracy for all detected sources is . In the 3000 deg2 region surveyed as of the April 1997 catalog release, has detected approximately 270,000 radio sources of which 32,000 are double or multiple sources with separations . From these, we have selected 384 sources which exhibit the bent double morphology. The peak and integrated flux densities at 20 cm of these sources are typically a few mJy and 10 - 100 mJy, respectively.
The sample was selected by visually inspecting grayscale plots of sources with more than one component within a circle of radius 60′′. The radio sources were examined independently by ELB, DJH, and RHB. The lobes needed to be clearly bent and ’dog-leg’ FR II sources were avoided. If two out of three of the examiners selected a source, it was included in the sample. Objects that were chosen by only one of us were re-examined, and a few of these were also added to the sample. The sample contains a large percentage of FR I radio galaxies, as they are more frequently found to be distorted than are FR II’s which most often appear as collinear classical doubles.
Our sample of 384 objects consists of 50% FR I sources, 25% FR II sources, and 25% FR I/II (sources with intermediate morphologies). Thirty-one (8%) of these sources are within 5 arcmin of the center of an Abell cluster. We selected and classified these before knowing of their cluster associations and found that, of these 31, we classified 80 as FR I, 10 as FR II, and 10 as FR I/II. The FR I sources are easily recognizable by to and probably provide us with the best opportunities of finding new moderate to high-redshift clusters. The FR II galaxies may also be found in such environments and, given their higher mean radio powers, are detectable to even higher redshifts. Some of the sources we classified as FR I/II and II may be FR Is that have had extended emission resolved out by and/or had their morphologies altered by 1/ surface brightness dimming. However, the high surface brightness and small angular extents of the lobe hot spots which characterize FR IIs make it unlikely that an FR II would be mistaken as an FR I. Therefore, even after considering classification errors, the majority of our sources are of type FR I.
Of the 384 objects, 130 were imaged in the R-band at the KPNO 2.1m and 4m telescopes between March 1995 and April 1997. The specific fields for which images were obtained were chosen following a number of different criteria. Sources within 5′ of known clusters (31 Abell, 1 PDCS) were generally not imaged as data already exist for them. The majority of fields observed contained only faint galaxies or were blank on the DSS (Digitized Sky Survey), a selection criterion designed to be biased toward high- clusters. We observed all sources that serendipitously lie in ROSAT pointings (except for those in Abell clusters). We were, of course, always constrained by the dates observations were scheduled. Also, in the earlier stages of the project, fewer sources were available in our sample, leading to less selectivity in the fields observed (e.g., those with brighter objects on the DSS were sometimes included).
The selection criteria for the imaging follow-up to date are not possible to quantify. In a future paper, observations of a clearly defined, complete subsample of bent doubles will be presented in order to study the relationships between source classification (FR I or II), bending angle, radio power, and richness of the source environment. Here, we seek simply to establish the utility of bent-double radio galaxies as tracers of clusters at intermediate to high redshift. We present ten fields in this paper that were chosen from the 100 imaged at KPNO as of December 1996. All ten revealed only faint galaxies or were blank on the DSS. They were selected for multi-object spectroscopy because the KPNO images revealed obvious over-densities of faint galaxies in the vicinity of the radio source.
3 Observations and Reductions
3.1 Images
Most of the optical follow-up images were obtained at the KPNO 2.1m with the 10241024 T1KA CCD, giving a field of view of 55 arcmin. The remaining images were obtained at the KPNO 4m outfitted with a 20482048 T2KB which yields a field of view of approximately 1616 arcmin. A log of the imaging observations for the current sample is presented in Table 1. The fields were observed in the R-band in order to go as deeply as possible – high- galaxies are relatively bright in the R-band and the instrumental throughput is maximized at the wavelengths covered by this filter. We used the KPNO Harris-R filter which was designed to match the Kron-Cousins system.
The images were corrected for bias and flatfield effects in a standard manner using IRAF 222IRAF is distributed by the National Optical Astronomy Observatories, which are operated by the Association of Universities for Research in Astronomy, Inc., under cooperative agreement with the National Science Foundation. (Image Reduction and Analysis Facility). Typically, three observations were made of each field. The frames were aligned and averaged with cosmic rays rejected.
Instrumental, “total” magnitudes (see §4.3 for more details) were measured using FOCAS (the Faint Object Classification and Analysis System, Valdes 1983). These magnitudes were put on the standard Cousins-R scale using observations of Landolt (1992) standards in all but three cases; for 1119+3750, 1234+4012, and 1418+3211, KPNO spectrophotometric standards were utilized. For these three cases, magnitudes at the appropriate effective wavelength (Bessel 1979) were used to convert the instrumental magnitudes to the Cousins-R values. Since some of the observations were taken during nights that were not perfectly clear throughout, only one or two standards were used in the calibration, typically observed within two hours of the object during which time the sky had changed little. Despite imperfect weather, we believe the photometry is fairly good. The ten fields described here were observed during four observing runs: 11/96 (2 nights, 5 of the fields), 3/96 (2 nights, 3 fields), 1/96 (1 field), and 3/95 (1 field). The zero points derived for the two nights in 11/96 were consistent to 0.05 mag.; those for the two nights in 3/96 agree to 0.03 mag. The field observed in 3/95 (1338+4100) was later photometrically calibrated during a queue-scheduled observing run (R. Shuping, private comm.) and the resultant magnitude agreed to 0.01 mag. with that derived using a standard star from the 3/95 observation. The field observed in 1/96 (1209+2848) was also calibrated during the queue run. As a check of photometric stability, we also measured magnitudes on each of the three separate frames taken for each bent-double (BD) field. The rms errors derived from the magnitude of the host galaxy on the three separate frames for each of the fields range from 0.01 – 0.07, with a mean of 0.04; these are listed in Table 1. An additional 0.05 – 0.10 mag. error can be assumed because of surface brightness dimming (see §4.3).
Previously measured KPNO atmospheric extinction corrections were employed and the magnitude adjustments were always very small ( mag.) because standards were observed at airmasses very similar to those of the target frames. Previously measured color coefficients for the KPNO 2.1m with the T1KA CCD were used, as we observed through only one filter; an elliptical galaxy spectrum was assumed for the radio galaxies, with observed (V - R) colors as a function of redshift taken from Coleman, Wu, and Weedman (1980). The color terms were small, increasing the galaxy brightnesses by an average of 0.04 mag. Corrections for Galactic extinction were taken from the HI maps of Burstein & Heiles (1982). These were neglible for most of our sources since all but one of them are at high Galactic latitudes (), the sole exception being 0730+2328 at .
3.2 Spectroscopy
Two nights of Keck II 10m time in December 1996 were used to collect spectra of cluster member candidates with LRIS (Low Resolution Imaging Spectrometer, Oke et al. 1995). We selected sixteen fields out of the 100 imaged to that point as candidates for multi-slit mask spectroscopy and designed a mask for each. Although one of these two nights was lost to weather, we were able to observe five of the fields during this run. During an additional night in February 1997, we obtained spectroscopy for five more fields. The Keck fields were selected irrespective of whether the bent radio galaxy contained therein was an FR I, II, or I/II; the primary criterion was an obvious over-density of faint galaxies around the radio source on the KPNO images.
In preparation for the multi-slit masks, FOCAS was run on astrometrically calibrated KPNO frames in order to classify objects as galaxies or stars. Galaxies to be observed through the masks were selected to be generally close in brightness to the radio counterpart or fainter. The UCSCLRIS package (Drew Phillips, private comm.) was employed to design the masks in IRAF. The slit lengths were chosen to be long enough to enable sky subtraction on both sides of the object in the slit, and position angles were chosen to maximize the number of galaxies on the mask. The masks contained an average of 22 slits over a span of up to 6 arcmin.
Observations were obtained at the Keck II 10m with LRIS , using a 300 lines/mm grating and the GG495 filter. The wavelength coverage was approximately 4950-9200 for the objects at the center of the masks, while off-axis objects had reduced coverage. The slit widths were 1′′ and the dispersion was 2.45 /pixel leading to a spectral resolution of approximately 10 . In addition to the slit-mask spectroscopic observations, each field was briefly imaged without a filter; these images are used for display purposes only in this paper. A log of the observations is presented in Table 2.
The spectroscopic fields were reduced following standard IRAF procedures. Each field was corrected for a bias frame and overscan region as well as an internal halogen flat taken through the corresponding mask. If there was only one exposure available for a particular field, ’cosmicrays’ was run to clean the field of cosmic rays. If two exposures were available, they were averaged after scaling and weighting by the exposure and offsetting by the mode, and cosmic rays were rejected. The spectra were wavelength-calibrated using comparison spectra of Hg+Kr, Ne, and Ar taken through the appropriate slit on the corresponding mask. The flux-calibration was achieved using the reduced and wavelength-calibrated longslit observations of standard stars – Feige 110 for the December data and BD332642 for the February data. Extinction values measured at the CFHT on Mauna Kea were employed.
Initially, redshifts were approximated for each galaxy by identifying a few obvious lines, typically the Ca II H+K absorption features and/or the [O II] 3727, Hβ 4861, [O III] 4959,5007 emission lines. The values we present were determined by performing a Fourier cross-correlation between the objects’ spectra and template spectra using FXCOR in IRAF. The elliptical galaxy spectra were correlated with a template of M32 shifted to the rest frame. Emission line spectra were correlated with a starburst galaxy template from Kinney et al. (1996). The errors in the redshifts are computed in FXCOR and are based on the fitted peak height and the antisymmetric noise, or “r-value” (Tonry & Davis 1979). The errors are typically 100 km s-1 for the elliptical galaxies and 50 km s-1 for those objects with emission lines. Overlays of the radio source contours onto the direct Keck images (except for 0730+2328 which uses an image from KPNO) are presented in Figure 1(a-j). Spectra for the optical identifications of the radio sources are presented in Figure 2; no spectrum is presented for 0221-0202 because no obvious optical counterpart for the bent double was identified (see §4.3). Two spectra are displayed for 0320-0049, one for the optical counterpart of the radio bright central component of the bent double, which is shown to be a quasar at , and one for the optical object coincident with fainter radio emission farther from the radio core which has a spectrum consistent with that of an elliptical galaxy at . One spectrum is presented for each of the eight remaining fields; most of the sources have normal elliptical galaxy counterparts.
4 Analysis/Results
4.1 Radio Galaxies
Properties of the radio galaxies, including position, 20 cm flux density, redshift, power, linear size, opening angle, and FR ratio, are listed in Table 3. The fluxes were taken from the NRAO/VLA Sky Survey (NVSS) catalog (Condon et al. 1996), since the high resolution of the survey may resolve out some of the flux for extended sources. The integrated 20 cm flux densities range from 7 to 80 mJy; the largest discrepancy between the NVSS and flux densities was . We were unable to secure a redshift for the radio source in 0221-0202, and 0320-0049 had radio emission from optical components at very different redshifts. The redshifts for the remaining bent-double radio galaxies range from 0.336 – 0.840. All of the sources have large opening angles excepting 0819+2522 which is an NAT (or possibly a WAT viewed in projection). The FR ratio was determined by examining the radio maps and applying the criteria of Fanaroff & Riley (1974). Edge-brightened sources are FR II, and edge darkened sources are FR I. We called borderline cases ’FR I/II’. Of the ten sources, we classify six as FR I, three as FR I/II, and only one as FR II. The borderline cases 1234+4012 and 1338+2931 have the largest discrepancies between the NVSS and flux densities (differences of 18% and 24%, respectively), suggesting that extended emission is being resolved out in the images and that they are likely FR I sources (since FR I’s have diffuse emission from their lobes). Fanaroff & Riley (1974) found a break in the powers between FR I and II sources at at 178 MHz, corresponding to at 1440 MHz, assuming P and . The sources in our sample generally have powers near the FR break, as is typical of WAT galaxies (O’Donoghue et al. 1993).
4.2 Cluster Redshifts and Velocity Dispersions
Histograms of the redshift distribution of galaxies in each of the ten fields are presented in Figure 3. The bins are 0.02 wide in , corresponding to 4000 km s-1 at . Seven of the fields show clear peaks in redshift space that include the radio galaxy (indicated with **). For 0221-0202, no radio galaxy counterpart has been identified, although there is a clear peak in the distribution at . The source 0320-0049 has a quasar at the center of the bent double (marked with **), and a radio galaxy (marked with *) which is coincident with a peak in the distribution that does not include the quasar. The redshift peaks for both 0221-0202 and 0320-0049 may result from groups or clusters that we recognized on the KPNO images but which are unassociated with the bent-double radio sources. In 0730+2328, there are four galaxies at , including the radio galaxy; combining this with the richness for this field, derived in §4.3, we believe that this represents a significant detection of a cluster. The redshifts for individual cluster member galaxies are listed in Table 4 and those of non-members are presented in Table 5.
The line-of-sight velocity dispersions are calculated for the cluster-member galaxies in our fields using , where ; they are listed in Table 4. The 68% confidence uncertainties are calculated following Danese, De Zotti, and di Tullio (1980), and include errors due to the small number of member galaxies per field and the measurement errors. We find a range in the dispersion values from approximately 300 to 1100 km s-1. The large velocity dispersions in some of the fields may be explained in three ways: 1) we have included unrelated field galaxies as cluster members; 2) the clusters are not virialized, having undergone recent cluster-cluster (or subcluster) merging; or 3) the clusters have large masses. To address the first possibility, we ’clean’ our cluster membership list using the method of Yahil and Vidal (1977). The galaxy with the largest velocity offset from the cluster mean is excluded, is recalculated, and the new offset for the questionable galaxy is determined. If the new offset is greater than 3, the galaxy is removed from the member list. This process is repeated with the next galaxy until no further members are rejected. Applying this to the galaxies listed in Table 4 would have a significant effect on one field, and marginally modify our results on two others. In 1119+3750, if galaxy #17 (3.42 offset) and then #8 (3.66 offset) are removed, we obtain a new velocity dispersion of 322 km s-1 (instead of 709 km s-1), and a new mean redshift of 0.4868. The radio galaxy’s velocity offset from the mean is lowered to -425 km s-1 from -706 km s-1. One galaxy each in 1234+4012 and 1338+2931 is a borderline case. If #4 is removed from 1234+4012, its offset from the new mean (0.4875) is 3.00 times the new (350 km s-1, instead of 532 km s-1). The radio galaxy’s velocity offset from the mean lowers to 20 km s-1 from 182 km s-1. Removing galaxy #9 from 1338+2931 gives a new mean redshift of and km s-1 (instead of 640 km s-1); #9’s offset is 3.07. In this case, the radio galaxy’s velocity offset actually rises to 934 km s-1 from 787 km s-1. Since this procedure may remove galaxies involved in a cluster or subcluster merger, or otherwise related galaxies, as well as unrelated field galaxies, it is not necessarily desirable.
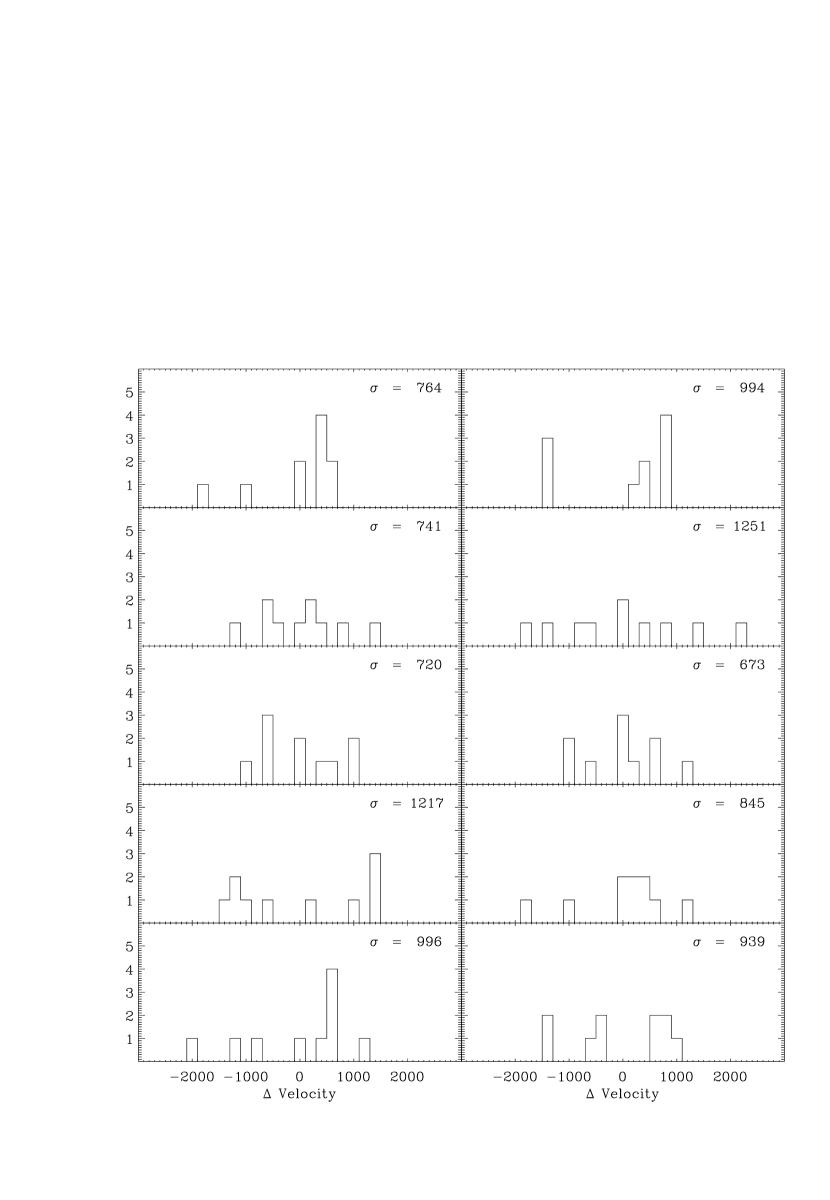
High-resolution velocity histograms, with 200 km s-1 bins, are presented in Figure 4 (a), where velocities are shown relative to the cluster mean. These histograms are not simple, smooth Gaussian distributions centered on the cluster mean velocity; however, the distributions shown typical of known clusters and are to be expected when velocities are measured for so few cluster members. For comparison, in Figure 4 (b), we present velocity histograms for the Coma cluster. To make these plots analogous to those for the BD clusters, ten of the thirty brightest galaxies in Coma were randomly selected, velocity dispersions were calculated, and the histograms were constructed. Again, we do not see Gaussian distributions centered on the cluster mean velocity, and what appear to be clumps of outlying galaxies are sometimes present. The velocity dispersions calculated from these simulations range from 673 – 1251 km s-1. The true velocity dispersion of the galaxies in the main Coma cluster (not including a group of galaxies which appears to be merging with the main cluster), is 1082 km s-1, and the overall distribution is Gaussian (Colless & Dunn 1996). The large uncertainties listed for our BD cluster velocity dispersions in Table 4 attest to the substantial uncertainty of our measurements.
It is not possible to distinguish between the other two explanations for large velocity dispersions without X-ray observations of each field or many more measured redshifts that could reveal substructure in the clusters. In fact, the clusters with large may well be both massive and dynamically active. In a ROSAT study of the X-ray emitting gas in clusters containing WATs, Gómez et al. (1997) found that the direction of the bending of the radio lobes often corresponds to the orientation of the X-ray isophotes, suggesting that merging cluster gas is providing the ram pressure necessary for bending the lobes of radio galaxies lying at the centers of cluster potential wells. If, indeed, WATs are formed as a result of cluster-cluster merging, we would expect the environments of WATs to be not completely virialized and their associated clusters to have large velocity dispersions. If a radio galaxy identified with a cD galaxy has a significant peculiar motion relative to the cluster, we also expect that the cluster is incompletely virialized. In a study of the kinematics of dense clusters of galaxies, Zabludoff et al. (1993) found that “systems with speeding cD’s are probably a guide to substructure in dynamically evolving systems.” The radio galaxy may be at the kinematic center of a subclump involved in the merger of poor clusters or groups and thus would have a significant peculiar velocity relative to the cluster as a whole. Merritt (1985) suggested that cD’s are formed in such mergers (cf. Zabludoff et al. 1993). We see a range in the offset of the velocity of the radio galaxy with respect to the mean cluster velocity of 70 to 1220 km s-1 (, Table 4). Several of the radio galaxies are travelling with velocities of a few hundred km s-1 with respect to the cluster mean. This is faster than expected from simulations of cD galaxies in virialized clusters (Malumuth 1989) but slower than the km s-1 required to bend the lobes in existing models (O’Donoghue et al. 1993), so these clusters may well represent merging systems.
If the velocity dispersions approximately representative of the cluster masses, we calculate masses in the range (1209+2848) to (0819+2522) within a radius of approximately one megaparsec. At the high end of this range, these would be some of the highest- massive clusters known. In the following section, we go beyond those galaxies for which we have directly measured redshifts to examine the richness of the fields surrounding each radio source.
4.3 Richness
We measure the richness in the KPNO images of the fields surrounding each source in two different ways, following the example of H&L91 in the first case, and that of Allington-Smith et al. (1993) and Z97 in the second. The H&L91 sample included approximately 50 radio galaxies with , and with a range of radio powers, although only 13 were classified as FR I. The Z97 sample includes a larger range in redshifts with , and all of the sources have high powers ( are FR I’s, and these are almost exclusively at low-z in her sample). The H&L91 method uses N0.5, the number of galaxies above the background galaxy counts within a radius of 0.5 Mpc of the radio galaxy and within the magnitude range mR,rg to mR,rg + 3, where mR,rg is the apparent isophotal R-magnitude of the radio galaxy measured to a surface brightness limit of 27.5 mag./arcsec2 (their optical observations are similar to ours – 15 - 30 min. total exposures in the R-band at a 2.2m telescope, limiting magnitude 23). This type of richness measure is similar to an Abell richness parameter which includes galaxies with magnitudes in the range m3 to m3 + 2, where m3 is the magnitude of the third brightest cluster member. The modification to mR,rg + 3 was made because the third brightest cluster member is difficult to recognize with increasing redshift, due to the superposition of field galaxies along the line-of-sight. The H&L richness measurement assumes that the radio galaxy is the first ranked member of the cluster, which is not always the case. If it is not, we measure the H&L parameter twice: once using the radio galaxy’s magnitude as the starting point, and again using that of the brightest cluster galaxy. The advantage of using the H&L technique to measure the richness is that it does not assume a form for the luminosity function of the cluster as a function of redshift, as does the richness measure B, the correlation statistic used by Yates, Miller, and Peacock (1989) and Yee and Green (1984, 1987) among others, although it does assume that the evolution for all cluster members is similar.
The method introduced by Allington-Smith et al. (1993) and also used by Z97 uses N, the number of galaxies within a radius of 0.5 Mpc from the radio galaxy and down to M at the redshift of the radio source. The advantage of this technique is that it will sample the same range of absolute magnitudes in each cluster, as opposed to H&L’s technique which will sample different ranges since the absolute magnitudes of radio galaxies differ (by as much as magnitude in MV for our sample). However, the quantity N is dependent on K-corrections and color assumptions for the cluster galaxies.
We used FOCAS to find the positions of all objects detected at levels at least 3 above the sky, classify them as galaxies or stars, split merged objects into their components, and calculate FOCAS “total” magnitudes. The area used for determining the “total” magnitude is found by increasing the area used in calculating the isophotal magnitude by a factor of two. The “total” magnitudes reach a surface brightness limit of mag/arcsec2 for our data. Because of 1/ surface brightness dimming, an isophotal limit of 27.5 mag/arcsec2 at translates to a limit of 26.3 mag/arcsec2 at and 24.8 mag/arcsec2 at (the redshift extremes of our clusters). Tests that measured the magnitudes at different isophotal limits tell us that the true total magnitudes of the galaxies in our clusters are 0.05 - 0.1 mag. brighter than our measured “total” magnitues, but this will not affect our richness measurements. To improve sky subtraction, we increased the distance of the sky buffer (the distance from the edge of an object’s isophote to the edge of the annulus where sky is measured) from the FOCAS default value to be large enough that magnitudes no longer changed as the buffer distance was increased (this turned out to be 20 pixels).
To determine N0.5 (à la H&L), we counted all galaxies within a radius of 0.5 Mpc of the radio galaxy, defined by the redshift of the radio galaxy and using and , within the magnitude range mR,rg to mR,rg + 3. Due to the difficulty in measuring magnitudes in exactly the same way as other authors, we decided to measure background (field) galaxies directly from our cluster images, even though there will be some contamination from cluster galaxies. We counted galaxies in an annulus extending as far out in each cluster frame as possible and having the same area as the aperture in which we counted cluster + field galaxies. Due to the size of our frames and the redshifts of the clusters, the inner radii of the annuli were Mpc and so the annuli should still include some cluster galaxies. This will make our richness measurements conservative (underestimates of the true richness). As a comparison, we also calculated the number of galaxies expected within the appropriate magnitude range and angular area using the number counts from two deep surveys: Tyson (1988), whose counts agree well with those derived from H&L’s background fields, and Metcalfe et al. (1991), whose counts agree with other surveys such as Steidel & Hamilton (1993) and Couch et al. (1993). Tyson (1988) found log(N) = 0.39R – 4.8, where N is the number of galaxies per magnitude per square degree and R is the apparent isophotal R-magnitude to a surface brightness limit of 28 mag/arcsec2 (which Tyson found to be essentially equivalent to the total magnitude). Metcalfe et al. (1991) found log(N) = 0.373R – 4.51, where N is the number of galaxies per 0.5 magnitude per square degree and R is an aperture magnitude with a correction applied to make it a total magnitude. We would expect the number density of galaxies derived from field surveys to be lower than those from our annuli as the annuli counts will include cluster galaxies in the outskirts of the clusters. For the ten bent-double fields, we found the number of background galaxies expected from Tyson (1988) to be a mean of 22 than our annulus counts, and those from Metcalfe et al. (1991) to be 32 than the annulus counts.
For each cluster candidate, the annulus background counts were subtracted from the raw N0.5 counts. We define our limiting magnitude in the same way as H&L: 0.5 brighter than the peak in the number vs. magnitude histogram constructed for each frame. A correction factor was applied if mR,rg + 3 was fainter than our limiting magnitude (m for our 15 minute exposures and m for our 30 minute exposures). In these cases galaxies were counted down to the limiting magnitude only and background counts were determined in that same range. The correction factor was determined assuming a Schechter (1976) luminosity function with M and , and was defined as . This value was multiplied by the raw N0.5, the counts above the background. In addition to calculating N0.5 centered on the position of the radio galaxy and using the magnitude of the radio galaxy as the starting mR, we followed the same procedure with the brightest cluster galaxy’s position and magnitude (when the radio galaxy and BCG were not one and the same). Only galaxies that were spectroscopically confirmed cluster members were considered when choosing the BCG.
In order to determine a richness value using the same intrinsic luminosity range for cluster members, we also measured N. To transform apparent R-magnitudes to absolute V-magnitudes, an elliptical galaxy spectrum was assumed with a rest frame color (V – R) = 0.9, and K-corrections were taken from Coleman, Wu, and Weedman (1980). No evolution correction was applied. Galaxy counts were then made within an 0.5 Mpc radius centered on the radio galaxy, including all those with MV brighter than . When this was fainter than the limiting magnitude of the observation, a Schechter correction was applied in a fashion similar to that described above. The correction factors for N were usually greater than those for N0.5, since M at the redshift of the radio galaxy was usually fainter than mR,rg + 3 or mR,bcg + 3.
Table 6 lists the results. Columns (3) and (4) list the apparent R-magnitudes of the radio galaxies and brightest cluster galaxies, respectively. When the radio galaxy is the BCG, no value is listed for mR,bcg. Column (5) lists the rms errors derived from each field’s three separate frames. Total errors may be approximately 0.05 – 0.10 mag. higher because of surface brightness dimming. These errors have a negligible effect on our richness measurements. Columns (6) and (7) list the absolute V-magnitudes of the radio galaxies and BCGs, respectively. Columns (8), (10), and (12) list the corrected values of N, N0.5,rg, and N0.5,bcg, respectively, with Poisson errors from the cluster and background counts, and each column followed by , the correction factor that was applied to give the corrected counts. In the last column, an estimate of the Abell richness class is given for each of the clusters. This is approximated using Z97’s conversion of , and Abell’s (1958) conversion between and richness class. Before using this relation, we corrected to , as was used by Z97 – this affects the sampling radius in which galaxies are counted, and decreases the richness values by (as shown by H&L91). Using H&L91’s correlation between N0.5 and Abell class leads to slightly higher richnesses.
We find that all of the clusters associated with bent doubles in this sample fall in the Abell richness class range of 0 to 2, typical of the majority of clusters in Abell’s catalog of rich clusters. The mean in Abell, Corwin, & Olowin’s 1989 catalog is 60, which is Abell richness class 1, or . The fields around two of our bent doubles, 0221-0202 and 0320-0049, contain poor clusters or groups. The system in 0320-0049 does not appear to be associated with the bent double which itself may have a richer associated cluster at higher redshift. The optical i.d. for 0221-0202 is uncertain, and it is not at all clear that the radio source is associated with the surrounding group or cluster. There is a peak in the redshift distribution for this field, and the BCG was selected from that peak for use in determining the richness. The object at the core of the bent double in 0320-0049 has a quasar spectrum, with a redshift of 0.95, and is behind the group of galaxies. However, a galaxy included in the group located close to the core of the bent double, does show some radio emission (although this object would most probably not have been selected if not for the radio emission from the quasar). It is the magnitude and redshift of this galaxy that was used in determining the richness for this field. Finally, the field around 1234+4012 contains two groups or clusters , one associated with the radio galaxy at , and the other at . Therefore, N0.5,rg probably gives a better approximation of the richness than N since N0.5,rg excludes many of the brighter, foreground galaxies. It is this richness (N0.5,rg) that is used in approximating the Abell class for this cluster.
Excluding 0221-0202, 0320-0049, and 1234+4012 for the reasons cited above, and 0730+2328 because it has such a large correction factor, the mean is N for or 24 corrected to to be consistent with Z97, which is Abell’s class 0 using Z97’s conversion. This is to be compared with Z97’s mean value of 10.2 for all of the radio-selected groups in her sample (or 14.3 for FR I’s and 8.7 for FR II’s). Excluding 0221-0202, 0320-0049, and 0730+2328, the mean is N (Abell’s class 1, using H&L91’s conversion), compared with H&L91’s mean value of 9.7 for all radio sources in their sample.
These results show that our sources are found in richer environments than radio sources in general. This difference is most apparent when compared with the environments of FR II sources, but is still marked even when compared with Z97’s FR I subsample (which have a mix of unbent and bent morphologies). However, remembering that the sample of ten sources in this paper was drawn from a much larger sample of bent radio galaxies after examining optical follow-up images and seeing obvious over-densities of galaxies, we cannot yet conclude that, in general, bent radio galaxies lie in richer environments than other radio sources because of our bias towards rich environments in the optical selection. Nonetheless, we have demonstrated that our combined selection criteria produce an efficient method for finding clusters at . In a future paper (Blanton et al. 1999), we will present a larger, lower-, unbiased, and complete (area and magnitude limited) subsample of our bent double sample which will determine whether or not bent doubles, as a whole, are found in richer environments than other radio sources.
5 Conclusions
We have shown that bent-double radio sources selected from the survey are effective tracers of cluster environments at moderate to high redshifts. Of the ten fields studied, eight have clear evidence of being associated with clusters in the redshift range , and we cannot rule out that the remaining two may be associated with clusters at higher redshifts. The clusters display a range of line-of-sight velocity dispersions, from approximately 300 to 1100 km s-1, and a richness range of Abell class approximately 0 to 2. On the upper end of these ranges, we may be sampling some of the highest- massive clusters known, and/or we may be seeing systems with significant substructure that have recently undergone mergers. CDM models with predict strong evolution in the number density of massive clusters with redshift. The discovery of just a few high-redshift massive clusters within the area covered by the survey would help put firm upper limits on , possibly ruling out , CDM models (Bahcall, Fan, & Cen 1997). For now, it is difficult to say whether the clusters we have presented are massive, have substructure, or both. X-ray observations will distinguish amongst these possibilities.
The authors thank Drew Phillips for providing the software package (UCSCLRIS) that was used in designing the slit masks, Ralph Shuping for obtaining calibration data during a queue-scheduled observing run at the KPNO 0.9m, Frank Valdes for answering FOCAS questions, and the referee for helpful comments. Part of the work reported here was done at the Institute of Geophysics and Planetary Physics, under the auspices of the U.S. Department of Energy by Lawrence Livermore National Laboratory under contract No. W-7405-Eng-48. We acknowledge use of the NASA/IPAC Extragalactic Database (NED) which is operated by the Jet Propulsion Laboratory, Caltech, under contract with the National Aeronautics and Space Administration. The project is supported by grants from the National Geographic Society, the National Science Foundation (AST-94-19906), NASA (NAG5-6035), NATO, IGPP, Columbia University, and Sun Microsystems. This is Columbia Astrophysics Laboratory Contribution No. 654.
References
- (1)
- (2) Abell, G. O. 1958, ApJS, 3, 211
- (3) Abell, G. O., Corwin, H. G., Jr., & Olowin, R. P. 1989, ApJS, 70, 1
- (4)
- (5) Allington-Smith, J. R., Ellis, R. S., Zirbel, E. L., & Oemler, A. 1993, ApJ, 404, 521
- (6) Bahcall, N. A., Fan, X., & Cen, R. 1997, ApJ, 485, L91
- (7)
- (8) Blanton, E. L., Helfand, D. J., Gregg, M. D., Becker, R. H., & Leighly, K. 1999 (in preparation)
- (9)
- (10) Becker, R. H., White, R. L., & Helfand, D. J. 1995, ApJ, 450, 559
- (11)
- (12) Bessel, M. S. 1979, PASP, 91, 589
- (13)
- (14) Burke, D. J., Collins, C. A., Sharples, R. M., Romer, A. K., Holden, B. P., & Nichol, R. C. 1997, ApJ, 488, L83
- (15)
- (16) Burns, J. O., Rhee, G., Roettiger, K., & Owen, F. 1993, in Observational Cosmology, eds. G. Chincarini, A. Iovino, T. Maccacaro, & D. Maccagni (ASP Conf. Ser., 51), 407
- (17)
- (18) Burns, J. O., Rhee, G., Owen, F. N., & Pinkney, J. 1994, ApJ, 423, 94
- (19)
- (20) Burns, J. O., Gómez, P., Pinkney, J. Roettiger, K., & Loken, C. 1996, in Clusters, Lensing, and the Future of the Universe, eds. V. Trimble & A. Reisenegger (ASP Conf. Ser., 88), 184
- (21)
- (22) Burstein, D., & Heiles, C. 1982, AJ, 87, 1165
- (23)
- (24) Coleman, G. D., Wu, C.-C., & Weedman, D. W. 1980, ApJS, 43, 393
- (25)
- (26) Colless, M., & Dunn, A. M. 1996, ApJ, 458, 435
- (27)
- (28) Condon, J. J., Cotton, W. D., Greisen, E. W., Yin, Q. F., Perley, R. A., Taylor, G. B., & Broderick, J. J. 1997, preprint
- (29)
- (30) Couch, W. J., Ellis, R. S., Malin, D. F., MacLaren, I. 1991, MNRAS, 249, 606
- (31) Couch, W. J., Jurcevic, J., & Boyle, B. J. 1993, MNRAS, 260, 241
- (32)
- (33) Danese, L., De Zotti, G., & di Tullio, G. 1980, A&A, 82, 322
- (34)
- (35) Deltorn, J.-M., Le Fèvre, O., Crampton, D., & Dickinson, M. 1997, 483 L21
- (36)
- (37) Dickinson, M., to appear in “The Early Universe with the VLT”, proceedings of the second “Science with the VLT” meeting, Garching, Germany, April 1996
- (38)
- (39) Fanaroff, B. L., & Riley, J. M. 1974, MNRAS, 167, 31L
- (40)
- (41) Gioia, I. M., Henry, J. P., Maccacaro, T., Morris, S. L., Stocke, J. T. 1990a,ApJ, 356, 35
- (42)
- (43) Gioia, I. M., Maccacaro, T., Schild, R. E., Wolter, A., Stocke, J. T. 1990b, ApJS, 72, 567
- (44)
- (45) Gómez, P. L., Pinkney, J., Burns, J. O., Wang, Q., Owen, F. N., Voges, W. 1997, ApJ, 474, 580
- (46)
- (47) Gunn, J. E., Hoessel, J. G., & Oke, J. B. 1986, ApJ, 306, 30
- (48) Hill, G. J., & Lilly, S. J. 1991, ApJ, 367, 1
- (49)
- (50) Henry, J. P., Gioia, I. M., Maccacaro, T., Morris, S. L., Stocke, J. T. 1992, ApJ, 386, 408
- (51) Kinney, A. L., Calzetti, D., Bohlin, R. C., McQuade, K., Storchi-Bergmann, T., Schmitt, H. R. 1996, ApJ, 467, 38
- (52)
- (53) Landolt, A. U. 1992, AJ, 104, 340
- (54)
- (55) Ledlow, M. J. & Owen, F. N. 1995, AJ, 110, 1959
- (56)
- (57) Ledlow, M. J. & Owen, F. N. 1996, AJ, 112, 9
- (58)
- (59) Luppino, G. A. & Gioia, I. M. 1995, ApJ, 445, L77
- (60)
- (61) Malumuth, E. M. 1992, ApJ, 386, 420
- (62)
- (63) Merritt, D. 1985, ApJ, 289, 18
- (64)
- (65) Metcalfe, N., Shanks, T., Fong, R., & Jones, L. R. 1991, MNRAS, 249, 498
- (66)
- (67) O’Donoghue, A. A., Eilek, J. A., & Owen, F. N. 1993, ApJ, 408, 428
- (68)
- (69) Oke, J.B. et al. 1995, PASP, 107, 375
- (70)
- (71) Owen, F. N., & Rudnick, L. 1976, ApJ, 205, L1
- (72)
- (73) Postman, M. 1993, in Observational Cosmology, eds. G. Chincarini, A. Iovino, T. Maccacaro, & D. Maccagni (ASP Conf. Ser., 51), 260
- (74) Postman, M., Lubin, L. M., Gunn, J. E., Oke, J. B., Hoessel, J. G., Schneider, D. P.,& Christensen, J. A. 1996, AJ, 111, 615
- (75)
- (76) Rector, T. A., Stocke, J. T., Ellingson, E. 1995, AJ, 110, 1492
- (77)
- (78) Rosati, P., Della Ceca, R., Norman, C., & Giacconi, R. 1998, ApJ, 492, L21
- (79)
- (80) Roettiger, K., Burns, J. O., & Loken, C. 1996, ApJ, 473, 651
- (81)
- (82) Romer, A. K. et al., ApJ, submitted
- (83)
- (84) Scharf, C. A., Jones, L. R., Ebeling, H., Perlman, E., Malkan, M., & Wegner, G. 1997, ApJ, 477, 79
- (85)
- (86) Schechter, P. 1976, ApJ, 203, 297
- (87)
- (88) Stanford, S. A., Elston, R., Eisenhardt, P. R. Spinrad, H., Stern, D., Dey, A. 1997, AJ, 114, 2232
- (89)
- (90) Steidel, C. C. & Hamilton, D. 1993, AJ, 105, 2017
- (91)
- (92) Stocke, J. T., Morris, S. L., Gioia, I. M., Maccacaro, T. Schild, R. 1991, ApJS, 76, 813
- (93)
- (94) Tonry, J. & Davis, M. 1979, AJ, 84, 10
- (95)
- (96) Tyson, J. A. 1988, AJ, 96, 1
- (97)
- (98) Valdes, F. 1983, Faint Object Classification and Analysis System, Central Computer Services, National Optical Astronomy Observatories, P.O. Box 26732, Tucson, AZ 85725
- (99)
- (100) Vikhlinin, A., McNamara, B. R., Forman, W., Jones, C., Quintana, H., & Hornstrup, A. 1998, astro-ph/9803099
- (101)
- (102) Yahil, A., & Vidal, N. V. 1977, ApJ, 214, 347
- (103)
- (104) Yates, M. G., Miller, L., & Peacock, J. A. 1989, MNRAS, 240, 129
- (105)
- (106) Yee, H. K. C., & Green, R. F. 1984, ApJ, 280, 79
- (107)
- (108) Zabludoff, A. I., Geller, M. J., Huchra, J. P., & Vogeley, M. S. 1993, AJ, 106, 1273
- (109)
- (110) Zirbel, E. L. 1997, ApJ, 476, 489
- (111)
- (112) Zwicky, F., Herzog, E., Wild, P., Karpowicz, M., & Kowal, C. T. 1968, Catalogue of Galaxies and Clusters of Galaxies, (California Institute of Technology, Pasadena)
- (113)
Fig. 1.(a.–j.) Overlays of the radio source contours onto the direct Keck images (except for 0730+2328, Fig. 1c., which uses an image from KPNO). Numbers marking the galaxies correspond to those listed in Table 4 (large, bold-face numbers marking cluster members) and Table 5 (small numbers for non-members). Tables 4 and 5 are discussed in §4.2. The lowest radio contour for each overlay is listed in its caption; the contours are then 1, 2, 4, 8, 16, 32, and 64 times the lowest level.
Fig. 1.a. 02210202, , 7 confirmed members, richness Abell 0, total flux density = 7.3 mJy, lowest contour = 0.425 mJy.
Fig. 1.b. 03200049, , 5 confirmed members, richness Abell 0, total flux density = 67.0 mJy, lowest contour = 0.5 mJy.
Fig. 1.c. 0730+2328, , 4 confirmed members, richness = Abell 2, total flux density = 9.1 mJy, lowest contour = 0.35 mJy.
Fig. 1.d. 0819+2522, , 9 confirmed members, richness = Abell 0, total flux density = 65.1 mJy, lowest contour = 0.7 mJy.
Fig. 1.e. 0910+3841, , 10 confirmed members, richness = Abell 1, total flux density = 78.8 mJy, lowest contour = 0.57 mJy.
Fig. 1.f. 1119+4216, , 10 confirmed members, richness = Abell 1, total flux density = 31.3 mJy, lowest contour = 0.45 mJy.
Fig. 1.g. 1209+2848, , 8 confirmed members, richness = Abell 0, total flux density = 15.1 mJy, lowest contour = 0.4 mJy.
Fig. 1.h. 1234+4012, , 6 confirmed members, richness = Abell 1, total flux density = 45.3 mJy, lowest contour = 0.5 mJy.
Fig. 1.i. 1338+4100, , 11 confirmed members, richness = Abell 1, total flux density = 29.1 mJy, lowest contour = 0.45 mJy.
Fig. 1.j. 1418+3211, , 15 confirmed members, richness = Abell 0, total flux density = 28.5 mJy, lowest contour = 0.35 mJy.


![[Uncaptioned image]](/html/astro-ph/9910099/assets/x6.png)
![[Uncaptioned image]](/html/astro-ph/9910099/assets/x7.png)
![[Uncaptioned image]](/html/astro-ph/9910099/assets/x8.png)
![[Uncaptioned image]](/html/astro-ph/9910099/assets/x9.png)
![[Uncaptioned image]](/html/astro-ph/9910099/assets/x10.png)
![[Uncaptioned image]](/html/astro-ph/9910099/assets/x11.png)