An Imaging and Spectroscopic Survey of Galaxies within Prominent Nearby Voids II. Morphologies, Star Formation, and Faint Companions
Abstract
We analyse the optical properties of galaxies within and around three prominent voids of the Center for Astrophysics Redshift Survey (Geller & Huchra (1989)). We determine CCD morphologies and H equivalent widths from our imaging and spectroscopic survey (Grogin & Geller 1999). We also describe a redshift survey of 250 neighboring galaxies in the imaging survey fields. We assess the morphology-density relation, EW(H)-density relation, and the effects of nearby companions for galaxies in low-density environments selected with a smoothed large-scale ( Mpc) galaxy number density .
Both the morphological mix and the H linewidth distribution of galaxies at modest underdensites, , are indistinguishable from our control sample at modest overdensities, . Both density regions contain a similar fraction of galaxies with early-type (E and S0) morphologies and with absorption-line spectra (%). At the lowest densities, , there is a shift in the distribution of EW(H) away from absorption-line systems (only %) and toward emission-line systems with active star formation — EW(H)Å–100Å. There is a shift in the morphological distribution away from early-types and toward irregular and peculiar morphologies.
The redshift survey of projected companions, 80% complete to , demonstrates that the incidence of a close companion in redshift space is insensitive to global density over the range we investigate (). However, the typical velocity separation of close pairs drops significantly () from km s-1 at down to km s-1 at . In the lowest-density environments, galaxies with companions clearly () have stronger star formation than comparable galaxies at larger global density (). On the other hand, the distribution of EW(H) for galaxies without nearby companions (closer than kpc and 1000 km s-1) varies little over the entire density range.
These results, combined with the luminosity- and color-density relations of this sample (Grogin & Geller 1999), suggest that the formation and evolution of field galaxies are insensitive to large-scale underdensity down to a threshold of roughly half the mean density. The differences in galaxy properties at the lowest global densities we can explore () may be explained by: 1) a relative scarcity of the small-scale primordial density enhancements needed to form massive early-type/absorption-line galaxies; and 2) present-day galaxy encounters which are relatively more effective because of the lower velocity dispersion on small scales ( kpc) we observe in these regions. In the voids, where the luminous galaxies presumably formed more recently, there should be more gas and dust present for active star formation triggered by nearby companions.
keywords:
large-scale structure of universe — galaxies: distances and redshifts — galaxies: fundamental parameters — galaxies: photometry — galaxies: statistics1 Introduction
In the last decade, wide-angle redshift surveys have revealed large-scale structure in the local universe comprised of coherent sheets of galaxies with embedded galaxy clusters, bounding vast ( Mpc3) and well-defined “voids” where galaxies are largely absent. The influence of these structures’ large-scale density environment upon galaxy properties has been a continuing source of debate and is of interest for constraining proposed models of galaxy formation and evolution. The morphology-density relation (e.g., Dressler (1980); Postman & Geller (1984)), which quantifies the increasing fraction of ellipticals and lenticulars with local density, is one of the most obvious indications of environmental dependence for densities greater than the mean. In the lowest density regions, the voids, the observational evidence of trends in morphological mix, luminosity distribution, star formation rate, etc., is still rudimentary because of the intrinsic scarcity of void galaxies and the difficulties in defining an unbiased sample for study. Here we use a broadband imaging and spectroscopic survey of a large optically-selected sample to compare the properties of galaxies in voids with their counterparts in denser regions.
We refer the reader to the first paper of this study (Grogin & Geller 1999, hereafter Paper I ) for a more detailed review of the previous theoretical and observational research into void galaxies, which we summarize here. Proposed theories of galaxy formation and evolution have variously predicted that the voids contain “failed galaxies” identified as diffuse dwarfs and Malin 1-type giants (Dekel & Silk (1986); Hoffman, Silk, & Wyse (1992)), or galaxies with the same morphological mix as higher-density regions outside clusters (Balland, Silk, & Schaeffer (1998)), or no luminous galaxies at all for the want of tidal interactions to trigger star formation (Lacey et al. (1993)). Some of these theories have already met serious challenge from observations which have shown that dwarf galaxies trace the distribution of the more luminous galaxies and do not fill the voids (Kuhn, Hopp, & Elsässer (1997); Popescu, Hopp, & Elsässer (1997); Binggeli (1989)), and that the low surface-brightness giants are relatively rare and not found in the voids (Szomoru et al. (1996); Bothun et al. (1993); Weinberg et al. (1991); Henning & Kerr (1989)).
Most previous studies of void galaxies have focused on emission line-selected and -selected objects in the Boötes void at (Kirshner et al. (1981, 1987)); all have been limited to a few dozen objects or fewer. The galaxies observed in the Boötes void: 1) are brighter on average than emission-line galaxies (ELGs) at similar redshift and contain a large fraction (%) with unusual or disturbed morphology (Cruzen, Weistrop, & Hoopes (1997)); 2) have star formation rates ranging from 3–55 yr-1, up to almost three times the rate found in normal field disk systems (Weistrop et al. (1995)), in apparent contrast to the Lacey et al. (1993) model prediction; and 3) are mostly late-type gas-rich systems with optical and Hi properties and local environments similar to field galaxies of the same morphological type (Szomoru, van Gorkom, & Gregg (1996); Szomoru et al. (1996)).
Szomoru et al. (1996) conclude that the Boötes void galaxies formed as normal field galaxies in local density enhancements within the void, and that the surrounding global underdensity is irrelevant to the formation and evolution of these galaxies. Because the Boötes void galaxies are not optically-selected, though, their properties may not be representative of the overall void galaxy population. On the other hand, similar conclusions were drawn by Thorstensen et al. (1995) in a study of 27 Zwicky Catalog (Zwicky et al. 1961– (1968), hereafter CGCG) galaxies within a closer void mapped out by the Center for Astrophysics Redshift Survey (Geller & Huchra (1989); hereafter CfA2). The fraction of absorption-line galaxies in their optically-selected sample was typical of regions outside cluster cores, and the local morphology-density relation appeared to hold even within the global underdensity.
Our goal is to clarify the properties of void galaxies by collecting high-quality optical data for a large sample with well-defined selection criteria. We thus obtained multi-color CCD images and high signal-to-noise spectra for optically-selected galaxies within prominent nearby voids. We work from the CfA2 Redshift Survey, which has the wide sky coverage and dense sampling necessary to delineate voids at redshifts km s-1. These conditions are not met for the Boötes void, making the definition of Boötes void galaxies in previous studies harder to interpret.
Using a straightforward density estimation technique, we identified three large (– Mpc) voids within the magnitude-limited survey and included all galaxies within these regions at densities less than the mean (). In addition to the void galaxies from CfA2, we have also included fainter galaxies in the same regions from the deeper Century Survey (Geller et al. (1997); hereafter CS) and 15R Survey (Geller et al. (2000)). We thereby gain extra sensitivity toward the faint end of the void galaxy luminosity distribution, up to 3 magnitudes fainter than .
Covering essentially the entire volume of three distinct voids, our sample should place improved constraints upon the luminosity, color, and morphological distributions, and star formation history of void galaxies. Moreover, this optically-selected sample should be more broadly representative than previous void galaxy studies restricted to emission-line, IRAS-selected, and Hi-selected objects. We also conduct a follow-up redshift survey to in our imaging survey fields and identify fainter void galaxy companions, akin to the Szomoru, van Gorkom, & Gregg (1996) Hi survey for neighbors of the Boötes void galaxies. We thereby probe the small-scale ( kpc) environments around galaxies in regions of large-scale ( Mpc) underdensity. Here and throughout we assume a Hubble Constant km s-1 Mpc-1.
In Paper I we introduced the sample and its selection procedure, described the broadband imaging survey, and examined the variation of the galaxy luminosity distribution and color distribution with increasing large-scale underdensity. The luminosity distribution in modestly overdense, void periphery regions () and in modestly underdense regions () are both consistent with typical redshift survey luminosity functions in and . However, galaxies in the lowest-density regions () have a significantly steeper LF (). Similarly, the color distribution does not vary with density down to , but at lower densities the galaxies are significantly bluer.
Here we address the morphology and current star formation (as indicated by EW(H)) of optically-selected galaxies in underdense regions. In addition, we describe a deeper redshift survey of the imaging survey fields designed to reveal nearby companions to the more luminous void galaxies. Section 2 reviews the void galaxy sample selection briefly (cf. Paper I ) and discusses the selection of redshift survey targets. We describe the spectroscopic observations and data reduction in §3. We then analyse the morphological distribution (§4) and H equivalent width distribution (§5) of the sample as a function of the smoothed large-scale ( Mpc) galaxy number density. Section 6 describes results from the redshift survey for close companions. We conclude in §7.
2 Sample Selection
Paper I contains a detailed description of the sample selection for the imaging and spectroscopic survey, summarized here in §2.1. In §2.2 we describe the selection procedure for a deeper redshift survey of the image survey fields to identify nearby companions of the sample galaxies.
2.1 Imaging and Spectroscopic Survey Sample
We use a Mpc-smoothed density estimator (Grogin & Geller (1998)) to identify three prominent voids in the CfA2 redshift survey. We attempt to include all CfA2 galaxies below the mean density contour () around the voids, as well as fainter galaxies in these regions from the 15R and Century Surveys. The apparent magnitude limit of the CS enables us to include void galaxies with absolute magnitude , some three magnitudes fainter than . By restricting our study to galaxies within three of the largest underdense regions in CfA2 ( Mpc diameter), we minimize the sample contamination by interlopers with large peculiar velocity. Table 2 lists the galaxy sample, including arcsecond B1950 coordinates, Galactocentric radial velocities, and the corresponding to those locations.
We define the galaxies in Table 2 with as the “full void sample”, hereafter FVS. We further examine the properties of two FVS subsamples: the lowest-density void subsample (hereafter LDVS) of 46 galaxies with , and the complementary higher-density void subsample (hereafter HDVS) of 104 galaxies with . Our survey also includes some of the galaxies around the periphery of the voids where . Typically the region surrounding the voids at is narrow, intermediate between the voids and the higher-density walls and clusters (cf. Paper I , Figs. 1–3). Although our sampling of galaxies in regions with is far from complete, we designate these galaxies as a “void periphery sample” (hereafter VPS) to serve as a higher-density reference for the FVS and its subsamples. Because the VPS galaxies are chosen only by their proximity to the voids under study, we should not have introduced any density-independent selection bias between the FVS and the VPS.
2.2 Void Galaxy Field Redshift Survey Sample
Most of the volume spanned by the voids of interest has only been surveyed to the CfA2 magnitude limi, . At the 5000–10000 km s-1 distance of these voids, this limiting magnitude corresponds to an absolute magnitude cutoff of or brighter. To gain information on the presence of fainter companions to the void galaxies in our study, we use the SExtractor program (Bertin & Arnouts (1996)) to make a list of fainter galaxies on the -band imaging survey fields. We define the SExtractor magnitude as the output MAG_BEST with ANALYSIS_THRESH set to 25 mag arcsec-2 (cf. Bertin & Arnouts (1996)). We limit the redshift survey to , the rough limit for efficient redshift measurement using the FAST spectrograph on the FLWO 1.5 m. This magnitude limit is also commensurate with the Century Survey limit () as well as with the deepest 15R Survey fields in our study (cf. Paper I ).
As a check on the reliability of SExtractor magnitudes, we compare against the isophotal photometry from our imaging survey of the Table 2 galaxies (Paper I ). Those -band magnitudes are determined at the mag arcsec-2 isophote; we denote them . Figure 1 shows SExtractor magnitudes versus for 291 of the 296 galaxies in Table 2; the remaining five do not have SExtractor magnitudes because of saturated -band image pixels (00132+1930, NGC 7311) or confusion with nearby bright stars (00341+2117, 01193+1531, 23410+1123). We indicate the linear least-squares fit between the two magnitude estimates (dotted line), with 11 outliers at clipped from the fitting. Because Table 2 includes fainter 15R and Century Survey galaxies, we have good calibration down to the limit of the companion redshift survey.
Figure 1 shows that the agreement between and is excellent over mags. The scatter about the fit is only 0.05 mag, comparable to the uncertainty in the magnitudes (Paper I ). The slope of the fit, indicates that the scale error is negligible. The crossover magnitude, for which , is mag. The linear fit is sufficiently well-constrained that our survey limit corresponds to a limiting . This value may be directly compared with with the similarly-calibrated 15R and Century limits given in Paper I . For the 5000–10000 km s-1 redshift range of the three voids, this redshift survey therefore includes galaxies brighter than to . Here and throughout the paper we leave off an implicit () when quoting absolute magnitudes.
The imaging survey fields are roughly centered on the target galaxies — the absolute mean deviation of the pointing offset is . Given this mean offset and the sample’s distribution of angular diameter distance, we estimate that the mean sky coverage of the redshift survey around the galaxies in Table 2 drops to 90% at a projected radius of kpc .
Table 4 lists the arcsecond B1950 coordinates and SExtractor magnitudes of the companion redshift survey targets (sorted by right ascension) as well as the angular separation of each from its respective “primary” (cf. Tab. 2). Some galaxies in Table 4 have multiple entries because they neighbor more than one primary. In some cases the neighbor is itself a primary from Table 2; we note this in the comment field. There are 211 unique galaxies in Table 4, which form 250 pairings with primaries from Table 2. Of these 250 pairs, 180 have projected separations kpc.
3 Observations and Data Reduction
Paper I describes the imaging survey and reductions in detail. The resulting CCD images from the F. L. Whipple Observatory 1.2 m reflector have typical exposure times of 300s in and s in . Here we describe 1) a high-S/N spectroscopic survey of the CGCG and 15R galaxies in the primary sample (cf. §2.1); and 2) a deeper redshift survey of galaxies in the -band fields of the imaging survey (cf. §2.2).
3.1 High-S/N Spectroscopic Survey
We carried out the spectroscopic survey of CGCG galaxies in our sample with the FAST longslit CCD spectrograph (Fabricant et al. (1998)) on the FLWO 1.5 m Tillinghast reflector over the period 1995–1998. We used a slit and a 300 line mm-1 grating, providing spectral coverage from 3600–7600Å at 6Å resolution. For the typical exposure times of 10–20 minutes, we obtained a signal-to-noise ratio (S/N) in the H continuum of per 1.5Å pixel.
For the 15R galaxies in our sample, we used the 15R redshift survey spectra. These spectra were taken over the period 1994–1996 with FAST in an identical observing setup to our CGCG spectra. The exposure times for these spectra are typically 6–12 minutes, giving an H continuum S/N of .
The high-S/N spectroscopic survey of CGCG and 15R galaxies is essentially complete: 100% for the LDVS; 99% for the HDVS; and 98% for the VPS. Including the unobserved Century Survey galaxies in the accounting, the overall spectroscopic completeness is 98% for the LDVS, 95% for the HDVS, and 95% for the VPS.
All spectra were reduced and wavelength-calibrated using standard IRAF tasks as part of the CfA spectroscopic data pipeline (cf. Kurtz & Mink (1998)). We flux-calibrate the resulting 1-D spectra with spectrophotometric standards (Massey et al. (1988); Massey & Gronwall (1990)) taken on the same nights. Because these spectra were observed as part of the FAST batch queue, the observing conditions were not always photometric. We therefore treat the flux calibrations as relative rather than absolute, and only quote equivalent widths rather than line fluxes.
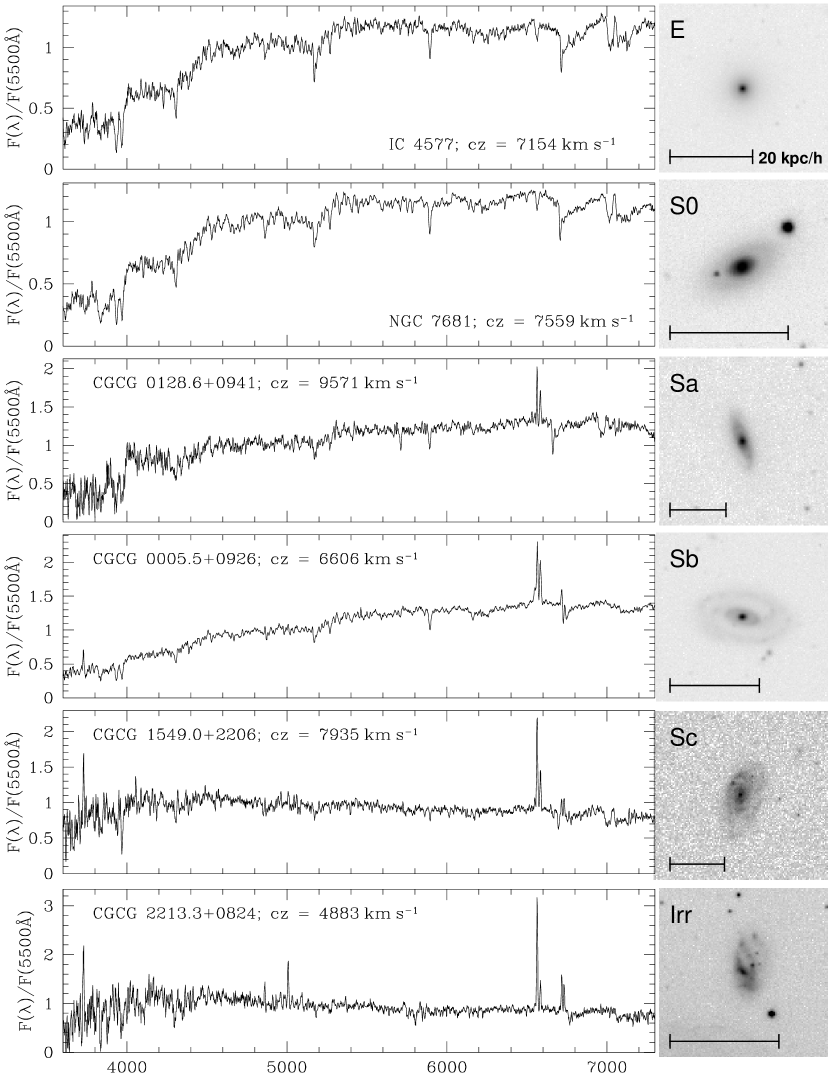
We next de-redshift each spectrum using the error-weighted mean of cross-correlation radial velocities found with FAST-customized emission- and absorption-line templates (cf. Kurtz & Mink (1998); Grogin & Geller (1998)). Our redshifts from the high-S/N CGCG spectra supersede the previous CfA redshift survey values and are reflected in the recent Updated Zwicky Catalog (hereafter UZC: Falco et al. (1999)). We do not correct the spectra for reddening (intrinsic or Galactic), but note that the majority of sample galaxies are at high Galactic latitudes where Galactic reddening is minimal. Figure 2 shows a representative subset of our reduced imaging and spectroscopic data: -band images and corresponding spectra for a range of early- to late-type galaxies.
We make a first pass through the de-redshifted spectra with SPLOT, fitting blended Gaussian line profiles to the H and Nii lines, and also fitting H and H for later Balmer-absorption correction. We note that the FAST spectral resolution of 6Å allows clean deblending of H 6563Å from the adjacent [Nii] 6548,6584Å lines. Using the first-pass line centers and widths, we make a second pass through the spectra to determine the equivalent widths and associated errors via direct line- and continuum-integration rather than profile-fitting.
We apply an approximate correction to EW(H) for Balmer absorption by using the greater of EW(H) and EW(H) if detected in absorption at . We note that only one of the 277 galaxies in our spectroscopic sample has Balmer absorption exceeding 5Å (CGCG 0109.0+0104), and this object has strong emission lines. There appear to be no “E+A” galaxies in our sample, which is not surprising given the small fraction (%) of such objects in the local universe (Zabludoff et al. (1996)). Table 2 includes the resulting H equivalent widths and their errors.
3.2 Redshift Survey of Void Galaxy Fields
We observed the redshift survey targets of Table 4 with the FAST longslit CCD spectrograph (Fabricant et al. (1998)) on the FLWO 1.5 m Tillinghast reflector over the period June 1996–November 1997 as part of the FAST batch queue. The exposure times ranged from 5–20 minutes, with a median of 12 minutes. The observing setup, as well as the spectrum reduction, wavelength-calibration, and redshift extraction, were identical to the high-S/N spectroscopic survey (§3.1).
Of the 211 galaxies in Table 4, we include new measurements for 83. Another 46 are members of the primary sample, and thus have known redshifts. For the remainder, we obtained 35 redshifts from the 15R and Century Surveys, the UZC (Falco et al. (1999)), ZCAT (Huchra et al. (1995)), and NED111The NASA/IPAC Extragalactic Database (NED) is operated by the Jet Propulsion Laboratory, California Institute of Technology, under contract with the National Aeronautics and Space Administration.. The median uncertainty for the redshifts presented in Table 4 is 21 km s-1.
We lack a redshift for 47 galaxies, a completeness of 78%. These galaxies are bunched near the magnitude limit — 36 of the 47 have . The survey completeness by field is somewhat greater because many of the imaging survey fields have no follow-up targets: 89% of the LDVS fields are fully surveyed, 85% of the HDVS, and 88% of the VPS.
Of the 165 galaxies in Table 4 which have a projected radius kpc from a Table 2 galaxy, we have redshifts for 129 — again 78% complete. The completeness by field is slightly larger when restricted to kpc because more of the fields have no targets: 91% of the LDVS fields are fully surveyed for kpc, 88% of the HDVS, and 90% of the VPS.
4 Morphology-Density Relation
One of us (N.A.G.) classified the morphologies of the entire sample by eye from the CCD images. The median seeing during the observations was and varied between and . The target galaxies, all with km s-1, are typically in diameter and are roughly centered within the CCD fields ( per -binned pixel). We assign each galaxy in Table 2 a “-type” from the revised morphological system, with the caveat that we list both irregular and peculiar galaxies as . From repeatability of classification for galaxies imaged on multiple nights, as well as from independent verification of the classifications by several “experts” (J. Huchra, M. Kurtz, R. Olowin, and G. Wegner), we estimate that the classifications are accurate to for the CGCG galaxies and for the fainter (and typically smaller in angular size) 15R and Century galaxies.
We plot (Fig. 3) the histograms of revised morphological type for the VPS (top), the HDVS (middle), and the LDVS (bottom). The VPS and the HDVS are very similar in their morphological mix, with an early-type fraction of % (Tab. 5). A chi-square test of these two histograms yields a probability of the null hypothesis that the VPS and HDVS have a consistent underlying morphological distribution.
In contrast, Figure 3 shows that the morphological mix changes significantly at the lowest densities (LDVS). There is a notable increase in the fraction of Irr/Pec galaxies and a corresponding decrease in the early-type fraction (Tab. 5). A chi-square test between the VPS and LDVS morphology histograms gives only a 7% probability that these two samples reflect the same underlying morphological mix. These two samples are well-separated in surrounding density — the uncertainty in the Mpc density estimator is at the distance of the three voids in this study (Grogin & Geller (1998)). Clearly a larger sample is desirable to better establish the morphological similarity between the VPS and HDVS, and their morphological contrast with the LDVS.
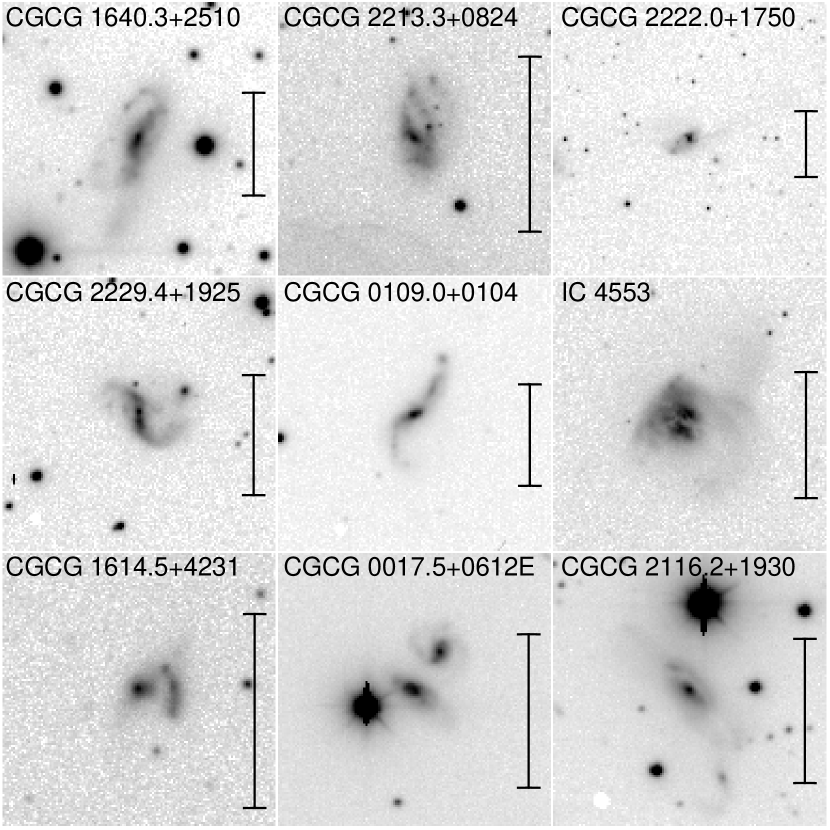
The incidence of qualitatively disturbed or interacting systems appears somewhat larger for the LDVS: , compared with for the galaxies at larger . We show (Fig. 4) a mosaic of 9 -band images of LDVS galaxies which are probable interactions. Notable among these interacting void galaxies is the spectacular object IC 4553 (Arp 220), the prototype (and nearest) ultraluminous IR galaxy. An increase in disturbed galaxies at the lowest global densities seems counterintuitive. We show (§6) that the effect may result from a low small-scale velocity dispersion in these regions.
5 EW(H)-Density Relation
Figure 5 shows the cumulative distribution function (CDF) of H equivalent width for the three different density regimes: the VPS (dashed), the HDVS (dotted), and the LDVS (solid). The similarity between the VPS and HDVS is evident, with a Kolmogorov-Smirnov (K-S) probability of 32% that the galaxies in these two density regimes have a consistent underlying distribution of EW(H). Given the similar fraction of early-type galaxies in these two samples (Fig. 3), it is not surprising that we see a similar fraction of absorption-line systems (). If this absorption-line fraction is representative of the overall survey at similar densities, then void galaxy studies drawn from emission-line surveys miss roughly one-third of the luminous galaxies in regions of modest global underdensitiy. Figure 5 shows that there are galaxies even at with old stellar populations and no appreciable current star formation.
The shift toward late-type morphology in the LDVS (Fig. 3) is mirrored by a shift toward larger H eqivalent widths (Fig. 5). Absorption-line systems are less than half as abundant at (% of the total); strong ELGs with EW(H) Å are more than three times as abundant. The K-S probability of the LDVS and VPS representing the same underlying distribution of EW(H) is only 0.4%. The probability rises to 3% between the LDVS and HDVS.
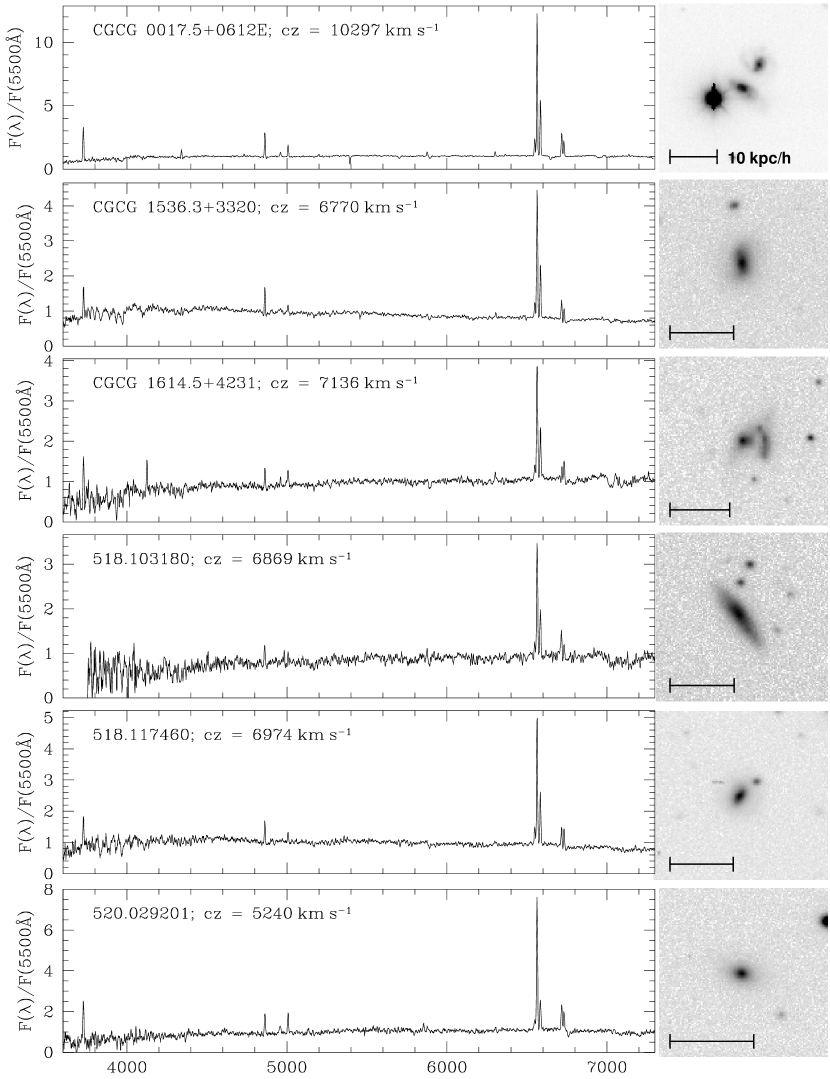
Figure 6 shows EW(H) as a function of the galaxies’ colors — the shift toward bluer galaxies in the LDVS is clear (cf. Paper I ). The red galaxies are predominantly absorption-line systems, with the notable exception of several galaxies in the LDVS with and EW(H) Å. Figure 7 displays these galaxies’ spectra and -band images. Only two have bright nearby companions (CGCG 0017.5+0612E, CGCG 1614.5+4231), but the others have possible faint companions. All appear to be disk systems, and the red colors probably result from internal reddening by dust; Balmer decrements are in the range 7–9 for these galaxies compared with the typical value of for case-B recombination.
6 Void Galaxy Companions
Here we discuss various results stemming from our deeper redshift survey of the imaging survey fields to (cf. §3.2). We determine the incidence of close companions as a function of density environment, examine the relationship between the presence of companions and the distribution of EW(H) versus density, and measure the velocity separation of the close companions as a function of .
6.1 Incidence of Close Companions and Effect on EW(H)
Figure 8 shows the projected separations (in kpc) and absolute velocity separations for all entries in Table 4 with measured redshift. A galaxy in Table 4 counts as a companion if the velocity separation from the primary is km s-1 (dashed horizontal line). This velocity cutoff is generous, but the gap in Figure 8 at –2000 km s-1 leads us to expect few interlopers. Because the sky coverage of the neighbor redshift survey becomes increasingly sparse at projected separations kpc (dotted vertical line), we repeat the analyses in this section with and without the added companion criterion kpc.
Table 6 lists the fraction of galaxies in the various density groupings which are classified as “unpaired” (zero companions as defined above) and “paired” (at least one such companion), or cannot yet be classified because of one or more missing redshifts in Table 4. The fraction of paired galaxies decreases consistently across all density subsamples by % under the restriction kpc . Table 6 shows that the fraction of paired galaxies is largely insensitive to the global density environment. Szomoru et al. (1996), who detected 29 companions around 12 Boötes void galaxies in Hi, also noted this tendency of void galaxies to be no less isolated on these small scales than galaxies at higher density.
We investigate the relationship between close companions and recent star formation in void galaxies by comparing EW(H) CDFs for paired versus unpaired galaxies. Figure 9 shows a dual-CDF plot of the paired and unpaired galaxies’ EW(H) (with the companion restriction kpc): the unpaired galaxies’ CDF increases from the bottom; the paired galaxies’ CDF decreases from the top. As in Figure 5, we distinguish between the VPS (dashed), HDVS (dotted), and LDVS (solid). The overall fraction of galaxies exceeding a given EW(H) is now represented by the interval between the upper and lower curves. For example, the excess of high-EW(H) galaxies in the LDVS is reflected here in the slower convergence of upper and lower solid curves until large EW(H). The upper and lower curves converge to the fraction of galaxies with EW(H) measurements but without detected companions. As the overall unpaired fraction is similar for each density subsample (cf. Tab. 6), it is reassuring that the three sets of curves converge at similar levels.
Inspection of the lower curves of Figure 9 reveals that the unpaired galaxies have much the same distribution of EW(H), regardless of the global density environment. The K-S probabilities (Tab. 7) confirm this impression. In contrast, the galaxies with companions have a very different EW(H) distribution depending on their density environment. Absorption-line systems account for % of the paired galaxies in both the VPS and the HDVS, while there are essentially no LDVS absorption-line systems with companions. A K-S comparison of the EW(H) distribution of the paired-galaxy LDVS with either the HDVS or VPS reveals a highly significant () mismatch, whereas the EW(H) distributions for the paired-galaxy HDVS and VPS are consistent (Tab. 7).
6.2 Pair Velocity Separation vs. Density
Figure 10 shows the radial velocity separation versus projected separation for entries in Table 4 with km s-1. Clearly the velocity separations of the LDVS pairs (solid triangles) are much smaller than either the HDVS pairs (open squares) or the VPS pairs (open stars). For the pairs which fall within the % coverage radius of kpc (dotted line), the dispersion in velocity separation is km s-1 for the LDVS, compared with km s-1 for the HDVS and km s-1 for the VPS (Table 6). These values for do not vary by more than the errors if we include the points in Figure 10 with projected separations kpc (“All ” in Tab. 6).
An F-test (Tab. 8) between the respective distributions for companions with kpc gives a low probability that the LDVS could have the same underlying variance as the HDVS () or the VPS (). The difference between HDVS and VPS dispersions is not significant at the level (). The F-test probabilities using all from Table 4 are almost identical (Tab. 8). We discuss the implications of the velocity dispersion variation in §7.
7 Summary and Conclusions
Our - and -band CCD imaging survey and high-S/N longslit spectroscopic survey of galaxies in and around three prominent nearby voids have enabled us to examine the morphologies and star-formation history (in terms of EW(H)) as a function of the global density environment for . These studies complement our earlier examination of the luminosity and color distributions of the same galaxies (Paper I ). We have also described an additional redshift survey of projected “companions” to which probes the very local environments ( kpc) around these galaxies within globally ( Mpc) low-density regions.
Our analysis of the CCD morphologies and H linewidths reveals:
-
1.
The distribution of galaxy morphologies varies little with large-scale ( Mpc) density environment over the range , with a consistent fraction of early types (% with ). The distribution of H equivalent widths, indicative of star-formation history, is similarly invariant with large-scale density over this range.
-
2.
At large-scale densities below half the mean, both the morphology and EW(H) distributions deviate at the 2–3 level from the higher-density subsamples. There is a reduction in the early-type fraction (down to %) and a corresponding increase in the fraction of irregular/peculiar morphologies. More of these galaxies show active star formation; even several of the redder galaxies () have EW(H)Å. Many of the void galaxies, particularly at the lowest densities, show evidence of recent or current mergers/interaction.
The results here and in Paper I can be combined into a consistent picture of the trends in galaxy properties with large-scale underdensity. In Paper I we showed that the luminosity function in the voids at is consistent with typical redshift survey LFs; at densities below the LF faint-end slope steepens to . Recent studies point to a type-dependent galaxy LF with steeper faint-end slope for the late morphologies in CfA2+SSRS2 (Marzke et al. (1998)) and for the ELGs in the Las Campanas Redshift Survey (Bromley et al. (1998)). We might therefore expect our morphological and spectroscopic distributions to vary little over the range and to shift toward late types and ELGs at the lowest densities. This trend is exactly what we observe (cf. §4)
Furthermore, we found in Paper I that the color distribution of our sample at densities is consistent with the overall survey and shifts significant toward the blue for . This trend is consistent with the observed shift at toward late-type and high-EW(H) galaxies, which are typically bluer than early-type and absorption-line systems.
To ascertain whether these changes in galaxy properties below are caused by variations in the local redshift-space environments of these galaxies (within kpc), we have carried out a deeper redshift survey of the imaging survey fields, to . The relative fractions of unpaired versus paired galaxies (paired galaxies are closer than kpc projected and 1000 km s-1 in redshift) does not significantly vary with the degree of global underdensity. Furthermore, the distribution of EW(H) for the unpaired galaxies varies little between our density subsamples. However, the galaxies at the lowest densities () which have companions are invariably ELGs. At higher global densities, roughly of the galaxies with companions are absorption-line systems. This difference in paired galaxy EW(H) with density is significant at the level.
Our companion redshift survey further reveals that the pair velocity separation decreases significantly () at the lowest densities, in support of theoretical predictions (e.g., Narayanan, Berlind, & Weinberg (1998)) that within the voids the velocity dispersion among galaxies should decline. Because associated galaxies at smaller velocity separations should have more effective interactions, the excess strong ELGs and disturbed morphologies at global underdensities may be ascribed to local influences.
These results argue for a hierarchical galaxy formation scenario where the luminous galaxies in higher-density regions formed earlier than at much lower density (e.g., Kauffmann (1996)). The older galaxies at higher-density would typically have less gas and dust at the present epoch, and thus show less active star formation even in the presence of nearby companions. In the voids, where the luminous galaxies presumably formed more recently, there should be more gas and dust present for active star formation triggered by nearby companions. As the EW(H) distributions are almost identical for the unpaired galaxies at different global density, we conclude that the local environment, i.e. the presence or absence of nearby ( kpc) companions, has more influence upon the current rate of star formation in these regions. In a future paper we hope to clarify the relationship between global underdensity and galaxy age (and metallicity) by studying the absorption-line indices of our high-S/N spectra (cf. Trager et al. (1998) and references therein). We may thereby use low-density regions to test the prediction by Balland, Silk, & Schaeffer (1998) that non-cluster ellipticals must have all formed at high redshift ().
Although the sample of void galaxies described here is much larger than previous studies of at most a few dozen objects (e.g. Cruzen, Weistrop, & Hoopes (1997); Szomoru, van Gorkom, & Gregg (1996); Thorstensen et al. (1995); Weistrop et al. (1995)), the distinctions in galaxy properties we observe at the lowest densities are based upon objects. We should like to increase the LDVS sample size to improve our statistics. One avenue is to include all other low-density portions of CfA2 and the comparably deep SSRS2 survey (Da Costa et al. (1998)). Unfortunately the centers of voids are very empty, at least to , and we would only expect to increase the low density sample thereby to galaxies. Because the global density estimator requires a well-sampled, contiguous volume with dimensions Mpc, growing the LDVS sample significantly is contigent upon deeper, wide-angle redshift surveys like the Sloan Digital Sky Survey (Bahcall (1995)) and the 2dF Galaxy Redshift Survey (Folkes et al. (1999)).
Acknowledgements.
We acknowledge the FAST queue observers, especially P. Berlind and J. Peters, for their help in obtaining our spectra; E. Barton, A. Mahdavi, and S. Tokarz for assistance with the spectroscopic reduction; and D. Fabricant for the FAST spectrograph. We give thanks to J. Huchra, M. Kurtz, R. Olowin, and G. Wegner for sharing their expertise in morphological classification, and to J. Huchra and A. Mahdavi for each kindly providing a redshift in advance of publication. This research was supported in part by the Smithsonian Institution.References
- Bahcall (1995) Bahcall, N. 1995, PASP, 107, 790
- Balland, Silk, & Schaeffer (1998) Balland, C., Silk, J., & Schaeffer, R. 1998, ApJ, 497, 541
- Bertin & Arnouts (1996) Bertin, E., & Arnouts, S. 1996, A&A, 117, 393
- Binggeli (1989) Binggeli, B. 1989, in Large-Scale Structure and Motions in the Universe, ed. M. Mezetti (Dordrecht: Kluwer), 47
- Bothun et al. (1993) Bothun, G. D., Schombert, J. M., Impey, C. D., Sprayberry, D., & McGaugh, S. S. 1993, AJ, 106, 530
- Bromley et al. (1998) Bromley, B. C., Press, W. H., Lin, H., & Kirshner, R. P. 1998, ApJ, 505, 25
- Cruzen, Weistrop, & Hoopes (1997) Cruzen, S. T., Weistrop, D., & Hoopes, C. G. 1997, AJ, 113, 1983
- Da Costa et al. (1998) Da Costa, L. N., WIllmer, C. N. A., Pellegrini, P. S., Chaves, O. L., Rité, C., Maia, M. A. G., Geller, M. J., Latham, D. W., Kurtz, M. J., Huchra, J. P., Ramella, M., Fairall, A. P., Smith, & C., Lípari, S. 1998, AJ, 116, 1
- Dekel & Silk (1986) Dekel, A. & Silk, J. 1986, ApJ, 303, 39
- Dressler (1980) Dressler, A. 1980, ApJ, 236, 351
- Fabricant et al. (1998) Fabricant, D., Cheimets, P., Caldwell, N., & Geary, J. 1998, PASP, 110, 79
- Falco et al. (1999) Falco, E. E., Kurtz, M. J., Geller, M. J., Huchra, J. P., Peters, J., Berlind, P., Mink, D. J., Tokarz, S. P., & Elwell, B. 1999, PASP, 111, 438
- Folkes et al. (1999) Folkes, S. et al. 1999, MNRAS, 308, 459
- Geller & Huchra (1989) Geller, M. J., & Huchra, J. P. 1989, Science, 246, 897
- Geller et al. (1997) Geller, M. J., Kurtz, M. J., Wegner, G., Thorstensen, J. R., Fabricant, D. G., Marzke, R. O., Huchra, J. P., Schild, R. E., Falco, E. E. 1997, AJ, 114, 2205
- Geller et al. (2000) Geller, M. J., et al. 2000, in preparation
- Grogin & Geller (1998) Grogin, N. A. & Geller, M. J. 1998, ApJ, 505, 506
- (18) Grogin, N. A. & Geller, M. J. 1999, AJ, in press (astro-ph/9910073)
- Henning & Kerr (1989) Henning, P. A., & Kerr, F. J. 1989, ApJ, 347, L1
- Hoffman, Silk, & Wyse (1992) Hoffman, Y., Silk, J., & Wyse, R. F. G. 1992, ApJ, 388, L13
- Huchra et al. (1995) Huchra, J. P., Geller, M. J., Clemens, C. M., Tokarz, S. P., & Michel, A. 1995, The CfA Redshift Catalog (NSSDC/ADC Cat. A7193) (Greenbelt, MD: GSFC)
- Kauffmann (1996) Kauffmann, G. 1996, MNRAS, 281, 487
- Kirshner et al. (1981) Kirshner, R. P., Oemler, A., Schechter, P.L., & Shectman, S. A. 1981, ApJ, 248, L57
- Kirshner et al. (1987) Kirshner, R. P., Oemler, A., Schechter, P.L., & Shectman, S. A. 1987, ApJ, 314, 493
- Kuhn, Hopp, & Elsässer (1997) Kuhn, B., Hopp, U., & Elsässer, H. 1997, A&A, 318, 405
- Kurtz & Mink (1998) Kurtz, M. J., & Mink, D. J. 1998, PASP, 110, 934
- Lacey et al. (1993) Lacey, C., Guiderdoni, B., Rocca-Volmerange, B., & Silk, J. 1993, ApJ, 402, 15
- Marzke et al. (1998) Marzke, R. O., Da Costa, L. N., Pellegrini, P. S., Willmer, C. N. A., Geller, M. J. 1998, ApJ, 503, 617
- Massey et al. (1988) Massey, P., Strobel, K., Barnes, J. V., & Anderson, E. 1988, ApJ, 328, 315
- Massey & Gronwall (1990) Massey, P. & Gronwall, C. 1990, ApJ, 358, 344
- Narayanan, Berlind, & Weinberg (1998) Narayanan, V. K., Berlind, A. A., & Weinberg, D. H. 1998, preprint (astro-ph/9812002)
- Popescu, Hopp, & Elsässer (1997) Popescu, C. C., Hopp, U., & Elsässer, H. 1997, A&A, 325, 881
- Postman & Geller (1984) Postman, M. & Geller, M. J. 1984, ApJ, 281, 95
- Szomoru, van Gorkom, & Gregg (1996) Szomoru, A., van Gorkom, J. H., Gregg, M. D. 1996, AJ, 111, 2141
- Szomoru et al. (1996) Szomoru, A., van Gorkom, J. H., Gregg, M. D., & Strauss, M. A. 1996, AJ, 111, 2150
- Thorstensen et al. (1995) Thorstensen, J. R., Kurtz, M. J., Geller, M. J., Ringwald, F. A., & Wegner, G. 1995, AJ, 109, 2368
- Trager et al. (1998) Trager, S. C., Worthey, G., Faber, S., M., Burstein, D., & González, J. J. 1998, ApJS, 116, 1
- Weinberg et al. (1991) Weinberg, D. H., Szomoru, A., Guhathakurta, P., & van Gorkom, J. H. 1991, ApJ, 372, L13
- Weistrop et al. (1995) Weistrop, D., Hintzen, P., Liu, C., Lowenthal, J., Cheng, K.-P., Oliversen, R., Brown, L., & Woodgate, B. 1995, AJ, 109, 981
- Zabludoff et al. (1996) Zabludoff, A. I., Zaritsky, D., Lin, H., Tucker, D., Hashimoto, Y., Shectman, S. A., Oemler, A., & Kirshner, R. P. 1996, ApJ, 466, 104
- Zwicky et al. 1961– (1968) Zwicky, F., Herzog, E., Wild, P., Karpowicz, M., & Kowal, C. T. 1961-8, Catalogue of Galaxies and Clusters of Galaxies (Pasadena: California Institute of Technology)
| Name | R.A. | Decl. | DensityaaDensity uncertainty (Grogin & Geller 1998). | bbSExtractor MAG_BEST (cf. §2.2). | cc-band CCD morphology. Both Irr and Pec assigned . | EW(H) | ||
|---|---|---|---|---|---|---|---|---|
| (B1950.0) | (B1950.0) | (km/s) | (mag) | (Å) | ||||
| CfA2 Survey Galaxies | ||||||||
| IC 5378 | 00 00 03.98 | 16 21 56.9 | 6554 | 1.19 | 13.43 | 5 | 0.5 | 0.4 |
| 000121555 | 00 01 10.32 | 15 54 30.2 | 6636 | 1.14 | 14.84 | 3 | 34.2 | 1.9 |
| 000171030 | 00 01 39.12 | 10 30 42.5 | 8134 | 0.91 | 13.66 | 3 | 8.8 | 1.1 |
| NGC 7825 | 00 02 32.74 | 04 55 31.1 | 8220 | 1.45 | 13.81 | 3 | 0.1 | 0.6 |
| 000550926 | 00 05 32.74 | 09 26 22.6 | 6606 | 1.18 | 13.29 | 3 | 6.5 | 0.6 |
| 000590956 | 00 05 54.05 | 09 55 37.9 | 6608 | 1.16 | 14.06 | 2 | 4.1 | 1.2 |
| 15R Survey Galaxies | ||||||||
| 464.015505 | 00 01 02.21 | 10 19 30.4 | 8085 | 0.91 | 14.18 | 5 | 0.4 | 0.8 |
| 464.040541 | 00 05 19.08 | 11 34 57.7 | 6685 | 1.06 | 15.14 | 5 | 5.4 | 1.8 |
| 464.069313 | 00 11 08.35 | 12 55 00.1 | 8059 | 0.77 | 15.46 | 0 | 10.8 | 3.5 |
| 465.011685 | 00 26 35.78 | 10 19 10.9 | 9887 | 1.78 | 15.21 | 10 | 88.0 | 7.2 |
| 467.045084 | 01 11 34.99 | 12 24 11.5 | 5894 | 1.18 | 15.05 | 3 | 23.2 | 2.5 |
| 467.017701 | 01 19 00.91 | 10 36 51.8 | 9989 | 1.99 | 14.66 | 5 | 0.7 | 1.1 |
| Century Survey Galaxies | ||||||||
| c20.CJ | 13 33 32.59 | 29 28 09.1 | 6414 | 1.38 | 16.48 | 5 | ||
| c14.FB | 13 56 20.90 | 29 37 54.1 | 5748 | 0.65 | 16.07 | 10 | ||
| c14.HQ | 14 02 20.71 | 29 24 50.0 | 7624 | 1.51 | 15.36 | 3 | ||
| c14.JA | 14 06 04.70 | 29 15 11.9 | 7412 | 1.01 | 15.81 | 6 | ||
| c14.JK | 14 07 58.01 | 29 40 08.0 | 6574 | 0.38 | 15.76 | 10 | ||
| e1390.CX | 14 44 36.60 | 29 23 06.0 | 8316 | 1.21 | 15.49 | 2 | ||
Note. — Right ascension in hours, minutes, and seconds of time. Declination in degrees, minutes, and seconds of arc. Radial velocities are Galactocentric. Table 2 is available in its entirety by request from the authors. A portion is shown here for guidance regarding its form and content.
| R.A. | Decl. | aaSExtractor MAG_BEST (cf. §2.2). | Neighbor | |||||
|---|---|---|---|---|---|---|---|---|
| (B1950) | (B1950) | (km/s) | (mag) | PrimarybbName as given in Table 1. | () | (km/s) | Comments | |
| 00 00 04.01 | 22 24.2 | 5834 | 5 | 15.24 | IC 5378 | 27 | 515 | NED redshift |
| 00 00 06.89 | 19 18.5 | 6328 | 18 | 15.33 | IC 5378 | 163 | 21 | |
| 00 02 53.21 | 53 52.8 | 5629 | 14.26 | NGC 7825 | 321 | 2426 | NED redshift | |
| 00 05 14.45 | 25 53.4 | 15.43 | 000550926 | 272 | ||||
| 00 05 56.50 | 56 06.7 | 15.18 | 000590956 | 46 | ||||
| 00 17 15.36 | 07 39.7 | 27074 | 21 | 15.71 | 001750612E | 285 | 16937 | |
| 00 17 16.08 | 10 54.8 | 10145 | 16 | 15.60 | 001750612E | 183 | 8 | |
| 00 17 28.03 | 11 24.0 | 10360 | 14 | 15.24 | 001750612E | 15 | 223 | |
| 00 19 53.71 | 29 30.1 | 40642 | 45 | 15.78 | 002030633 | 364 | 33087 | |
| 00 20 31.30 | 28 28.2 | 14820 | 29 | 14.07 | 002030633 | 335 | 7265 | |
| 00 22 40.06 | 13 16.3 | 15.36 | 002270613 | 71 | ||||
| 00 32 09.12 | 57 43.9 | 26870 | 42 | 16.04 | IC 31 | 317 | 17346 | |
| 00 33 48.22 | 25 33.2 | 10118 | 26 | 14.52 | 003361222 | 301 | 54 | 15R redshift |
| 00 34 05.21 | 19 57.0 | 9310 | 21 | 14.51 | 003412117 | 152 | 232 | |
| 00 35 09.17 | 32 56.8 | 15.89 | 003530437 | 361 | ||||
| 00 36 45.17 | 50 19.3 | 10618 | 5 | 15.90 | 003671250S | 70 | 149 | NED redshift |
| 00 36 51.46 | 44 20.8 | 15.56 | 003670341 | 244 | ||||
| 00 36 57.72 | 58 12.4 | 17211 | 41 | 16.04 | 003722056 | 206 | 8063 | |
| 00 36 58.51 | 39 32.0 | 4748 | 6 | 15.26 | 003670341 | 226 | 539 | NED redshift |
| 00 37 01.90 | 44 12.5 | 15.95 | 003670341 | 339 | ||||
| 00 37 04.30 | 57 36.4 | 17358 | 60 | 14.56 | 003722056 | 109 | 8210 | NED redshift |
| 00 37 20.09 | 56 39.8 | 16356 | 40 | 15.81 | 003722056 | 136 | 7208 | |
| 01 03 31.13 | 21 01.4 | 23418 | 40 | 15.54 | 010342517 | 239 | 16784 | |
| 01 06 42.53 | 39 47.2 | 15.35 | 010681935 | 248 | ||||
| 01 06 49.42 | 33 29.2 | 15.90 | 010681935 | 147 | ||||
| 01 08 49.34 | 00 47.9 | 6780 | 10 | 15.08 | 010900104 | 187 | 6 | NED redshift |
| 01 11 27.98 | 25 00.8 | 16320 | 37 | 15.46 | 467.045084 | 114 | 10571 | 15R redshift |
| 01 14 17.62 | 44 24.4 | 15.68 | 011431245 | 87 | ||||
| 01 14 28.80 | 43 25.0 | 15.66 | 011431245 | 183 | ||||
| 01 17 26.95 | 05 49.2 | 16.00 | 011741406 | 54 | ||||
| 01 17 50.93 | 48 35.6 | 16143 | 40 | 15.98 | NGC 476 | 246 | 9856 | |
| 01 20 29.09 | 35 07.4 | 12987 | 15 | 15.49 | 012060039 | 274 | 5497 | |
| 01 20 41.42 | 35 28.0 | 23112 | 17 | 15.99 | 012060039 | 199 | 15622 | |
| 01 22 33.26 | 36 45.0 | 6376 | 17 | 14.06 | IC 1700 | 166 | 36 | IC 107 |
| IC 1698 | 176 | 188 | ||||||
| 01 22 42.10 | 34 43.3 | 6564 | 17 | 13.52 | IC 1700 | 100 | 224 | IC 1698 |
| IC 107 | 177 | 188 | ||||||
| 01 22 44.62 | 36 16.2 | 6340 | 18 | 12.71 | IC 1698 | 99 | 224 | IC 1700 |
| IC 107 | 168 | 36 | ||||||
Note. — Right ascension in hours, minutes, and seconds of time. Declination in degrees, minutes, and seconds of arc. Radial velocities are heliocentric. Table 4 is available in its entirety by request from the authors. A portion is shown here for guidance regarding its form and content.
| Sample | |||||||
|---|---|---|---|---|---|---|---|
| LDVS | 46 | 15 | 5% | 65 | 7% | 20 | 6% |
| HDVS | 104 | 27 | 4% | 62 | 5% | 12 | 3% |
| VPS | 130 | 32 | 4% | 58 | 4% | 9 | 3% |
| Unpaired | Paired | Unknown | |||
|---|---|---|---|---|---|
| Density Sample | (km/s) | ||||
| LDVS | |||||
| kpc | 76% | 15% | 9% | 8 | |
| All | 67% | 22% | 11% | 13 | |
| HDVS | |||||
| kpc | 68% | 20% | 12% | 30 | |
| All | 61% | 28% | 12% | 39 | |
| VPS | |||||
| kpc | 69% | 22% | 9% | 36 | |
| All | 63% | 28% | 8% | 64 |
| Overall | Unpaired | Paired | Unpaired | Paired | |
|---|---|---|---|---|---|
| Density Samples | ( kpc) | (All ) | |||
| (LDVS vs. VPS) | 0.43% | 13% | 0.073% | 40% | 0.084% |
| (LDVS vs. HDVS) | 2.8% | 75% | 0.010% | 65% | 1.9% |
| (HDVS vs. VPS) | 32% | 4.7% | 20% | 31% | 0.73% |
| Density Samples | kpc | All |
|---|---|---|
| (LDVS vs. VPS) | 0.59% | 0.48% |
| (LDVS vs. HDVS) | 3.2% | 4.4% |
| (HDVS vs. VPS) | 13% | 12% |