EROS2 microlensing search towards the Magellanic Clouds
Abstract
eros2 is a second generation microlensing experiment operating since mid-1996 at the European Southern Observatory (ESO) at La Silla (Chile). We present the two year analysis from our microlensing search towards the Small Magellanic Cloud (smc), and report on the intensive observation of the caustic crossing event macho-smc98-1 and the limit derived on the location of the lens. We also give preliminary results from our search towards the Large Magellanic Cloud (lmc); 25 square degrees are being analyzed and two candidates have been found. This allows us to set another limit on the halo mass fraction comprised of compact objects.
CEA/Saclay, DSM/DAPNIA/SPP, F-91191 Gif-sur-Yvette, France
1. Introduction
A few years after Paczyński’s proposal (Paczyński 1986), the eros collaboration engaged in long term microlensing observations towards the Magellanic Clouds in order to probe the Galactic halo. eros1 and macho experiments set strong limits on the maximum contribution of low mass objects to the halo of the Milky Way (Alcock et al. 1998). Towards the lmc, the optical depth has been estimated by macho as , from 8 events (Alcock et al. 1997a); the time scales associated with these events indicate high mass lenses () that are not observed visually. Based on 2 candidates, eros1 gave an upper limit on the halo mass fraction in machos (Ansari et al. 1996) that is below that required to explain the rotation curve of our galaxy 111Assuming the 2 candidates are microlensing events, they correspond to .. It has been suggested that the lenses might be in the bar/disk of the lmc itself (Sahu 1994,Wu 1994); but simple dynamical arguments seem to rule out this possibility (Gould 1995). Nevertheless, more complicated lmc models allow for a larger optical depth (). smc microlensing search provides a test of the halo-lens hypothesis; in this model both the optical depth and the typical durations should be similar towards the lmc and the smc. To date, two smc events have been observed; they are significantly longer than the average for lmc events. However, no definite conclusion can be drawn from this without more smc events.
2. SMC two year analysis
One candidate, macho-smc97-1/eros-smc97-1 was found in this analysis (Alcock et al. 1997b, Palanque-Delabrouille et al. 1998). The result of a microlensing fit leads to an Einstein radius crossing time days. The is 261 for 279 d.o.f., taking into account the intrinsic variability of the amplified star ( days, see Palanque-Delabrouille et al. 1998, Udalski et al. 1997). This single event allows us to constrain the halo composition, in particular we exclude that more than 50 % of the standard dark halo is made of objects.
3. Results from the caustic crossing in event MACHO-SMC98-1
The macho collaboration sent a first level alert for this event on May , 1998, followed by an announcement that a caustic crossing had occurred on June . A second caustic crossing was predicted around June . After a planned technical maintenance, we could only observe in great detail the end of the second caustic crossing. Using this data alone, we could extract a limit on the caustic crossing time, which together with public data from macho enabled us to determine (at a 90% likelihood) that the deflector is in the smc (Afonso et al. 1998). This result has been confirmed and improved by other groups, leading to a common publication (Afonso et al. 1999, and references therein).
4. Preliminary analysis of the LMC data
Since August 1996, we have been monitoring 66 one-square-degree fields towards the lmc. Of these, data prior to May 1998 from 25 square-degrees spread over 43 fields are being analyzed. This represents 450 Gbytes of raw data, and about 100 days of cpu to produce the light curves.
| Fit | ||||||
|---|---|---|---|---|---|---|
| lmc-1 | Blended | 1 | 208/145 | |||
| lmc-2 | Combined | 1 | 1 | 406/150 |
About 90 images of each field were taken, with exposure times from 3 min in the center to 12 min in the outermost regions; the sampling is one point every 5 days on average. We report a preliminary analysis of the light curves of 17.5 million stars using a new set of selection criteria to isolate microlensing candidates. Starting from the images we built a star catalog using the peida photometry package, and then removed the 90% most stable stars. Among stars with the most significant variations, we used the quality of the microlensing fit to select the candidates. In order to maximize the number of surveyed stars and to study the background of microlensing searches, we did not remove any star based solely on its position in the color-magnitude diagram. With this strategy, we characterized the Blue Bumper stars that mimic a microlensing signal. In this way we removed the stars, located in the upper left of the color-magnitude diagram, that pass all cuts, but have the following features : , and , where are the red(blue) observed amplifications. Among the 17.5 million light curves, two events passed all the cuts (see table 1). Event eros2-lmc-1 is a main sequence star blended in red (76% of the visible flux was magnified). Event eros2-lmc-2 is located just under the red giant clump, and necessitates a deeper photometry study to confirm its validity; it is consistent nevertheless with being achromatic.
To set conservative limits on the halo mass fraction comprised of compact objects of mass , we can assume that the observed events are in the dark halo. We only consider the standard spherical halo model described in Palanque-Delabrouille et al. 1998. The most probable mass associated with both candidates is determined by finding the mass for which the (near Gaussian) distribution of peaks at the geometric mean
| (1) |
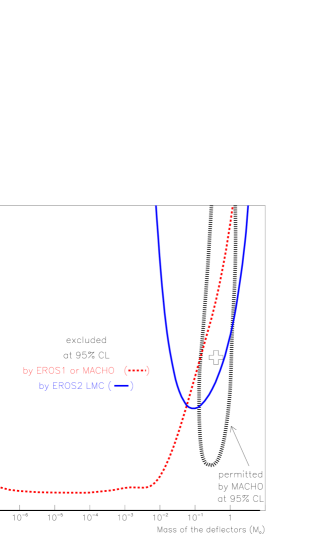
The resulting mass is found to be . We can also define a 68% confidence interval as follows: the upper (lower) bound is determined as the mass for which 16% of detected events would have durations greater (less) than . This mass interval is found to be : . Let be the total expected number of events for the standard halo model (considering our detection efficiency). To be conservative, we simply consider our two candidates without taking their mass into account. In this way, the 95% CL Poisson limit for a given mass is obtained by computing the expected number of events compatible with the observations: , where is the Poisson probability of observing events where are expected. The fraction for each mass is given by . This allows us to put a preliminary constraint excluding (at 95 % CL) that 60 % of the dark halo is composed of objects in the range (see fig. 1).
5. Discussion
There is growing evidence, from three different eros data sets (eros1-lmc, eros2-smc, and eros2-lmc) that the standard spherical halo model fully comprised of machos is inadequate. The only way to evade this limit is to suppose that the masses of the machos are greater than , or to consider non spherical halos. Another way to understand the observed events is to assume that they are due to self-lensing, in which case it is important to study their spatial distribution on the face of the lmc. In that respect, it is worth noting that our limit is derived from more than 17 million stars spread over 43 square degrees, in comparison with the macho experiment that monitored 9 millions stars covering 11 square degrees of the lmc bar (Alcock et al. 1997a). Finally, more exotic microlensing events (parallax effect, binary lens …) would allow us to locate precisely some lenses, and so to test the self-lensing hypothesis.
References
Afonso, C. et al. 1998, A&A, 337, L17.
Afonso, C. et al. 1999, (eros , macho/gman, mps, ogle, planet Coll.), astro-ph/9907247, submitted to ApJ.
Alcock, C. et al. 1997a, ApJ, 486, 697.
Alcock, C. et al. 1997b, ApJ, 491, L11.
Alcock, C. et al. (macho & eros Coll.) 1998, ApJ, 499, 9.
Ansari, R. et al. 1996, A&A, 314, 94A.
Gould, A. 1995, ApJ, 441, 77.
Paczynski, B. 1986, ApJ, 304, 1.
Palanque-Delabrouille, N. et al. 1998 A&A, 332, 1.
Sahu, K. C. 1994, Nat. 370, 275.
Udalski, A. et al. 1997, Act. Astr. 47, 431.
Wu, X.-P. 1994, ApJ, 435, 66.