Surface photometry of bulge dominated low surface brightness galaxies
Abstract
We present results of broad band BVRI observations of a sample of galaxies with a low surface brightness (LSB) disk and a bulge. These galaxies are well described as exponential disks and exponential bulges with no preferred value for either scale length or central surface brightness. The median B band disk scale length is 12.6 kpc ( = 75 km s-1 Mpc-1) which is much larger than scale lengths of typical (disk dominated) LSB or high surface brightness (HSB) galaxies. Furthermore, the disk and bulge scale lengths are correlated, suggesting a coupling in the formation. Bulge dominated LSB galaxies are observed to be redder than disk dominated LSB galaxies and their bulge-to-disk ratios are increasing towards redder wavelengths. We find colors that are comparable to or bluer than HSB galaxies of the same morphological types. Bulge dominated LSB galaxies are therefore not faded HSB galaxies with no current star formation. We find that bulge dominated LSB galaxies fit in with the general trends defined by the HSB galaxies. The properties of these bulge dominated LSB galaxies show that LSB galaxies do not just come in two varieties. They cover the entire range in optical and morphological properties between late-type disk dominated LSBs and giant Malin-1-like LSBs. LSB galaxies thus also form a LSB Hubble sequence, parallel to the classical HSB one.
Key Words.:
Galaxies: fundamental parameters – Galaxies: photometry – Galaxies: spiral1 Introduction
When studying the properties and evolution of galaxies it is necessary to have a proper census of all types of galaxies. Deep photographic surveys have shown the existence of a large number of galaxies with surface brightnesses much fainter than the night sky. The severe selection effects caused by the brightness of the night sky ensures that these galaxies are very much under-represented in conventional galaxy catalogs. However, in the last 20 years it has become clear that these low surface brightness (LSB) galaxies may constitute a major fraction of the total galaxy population. Clearly, LSB galaxies show us an alternative path of galaxy evolution which does not lead to the classical Hubble sequence and offer us a new window onto galaxy evolution (Impey & Bothun impey (1997); Bothun et al. bothun (1997)).
Most of the LSB galaxies investigated in any detail are either late-type and disk dominated (de Blok et al. de blok et al (1995), hereafter dB95; McGaugh & Bothun mc gaugh (1994)), or giant, Malin-1-like galaxies (Sprayberry et al. sprayberry (1995); Pickering et al. pickering (1997)). The disk dominated LSB galaxies have only small traces of star formation (de Blok et al. db (1996)a), are very gas-rich (de Blok et al. db2 (1996)b), and appear quite unevolved (van der Hulst et al. vdhulst (1993)). The H i masses are a few times (de Blok et al. db2 (1996)b) and the H i surface densities are usually close to the critical density for star formation (van der Hulst et al. vdhulst (1993); de Blok et al. db2 (1996)b; Kennicutt kennicutt (1989)). They also have color gradients, the outer parts of the disks are bluer than the inner parts. Apart from this the LSB galaxies investigated by de Blok, McGaugh and van der Hulst tend to be bluer than classical Hubble sequence HSB galaxies. There has been some discussion on whether this was an intrinsic property of LSB galaxies or yet another selection effect, due to the blue-sensitive plates used for the LSB surveys. The discovery of a large number of red LSB galaxies (O’Neil et al. o'neil (1997)) showed that there is also a red (B-V 0.9) component of the LSB population. The continuous range of colors from the very blue to the very red clearly shows that LSB galaxies define a wide range of evolutionary states.
The fact that most LSB galaxies discovered so far are either bulgeless, late-type “normal-sized” galaxies or giant galaxies with a significant bulge component, raises the question whether there are any “normal-sized”, bulge dominated LSB galaxies. Are there LSB galaxies with disks with scale lengths of a few kpc and a low surface brightness that have a significant bulge component?
If these galaxies do indeed exist then the fact that they are not turning up in LSB galaxy surveys can only mean that there are severe selection effects against them, or that we already found them and included them in our catalogs.
Because of their obvious bulge components it is hard to see which of the known selection effects could make us very much biased against them. We have therefore assumed that at least a fraction of the bulge dominated LSB galaxies have already been included in conventional catalogs, and have selected a small sample of what we can call bulge dominated LSB galaxies from the ESO-LV catalog (Lauberts & Valentijn lauberts_valentijn (1989)).
In the universe galaxies have surface brightnesses in a continuous range from low to high surface brightness, the low end being set by instrument sensitivity. Normally a LSB galaxy is defined to be a galaxy with a face-on disk central surface brightness more than one magnitude fainter than the Freeman (freeman (1970)) value of B mag arcsec-2. In the presence of a bulge the true central surface brightness of the galaxy will of course be much higher and it would be hard to call them LSB for that reason. However, that is not the point here. Bulge dominated galaxies can still have a LSB disk, and in that sense the central disk surface brightness is used as an indicator for the amount of evolution in the disk. For late-type galaxies one can roughly equate (for undisturbed galaxies) the central disk surface brightness with evolutionary stage. The possibility of having a bulge sitting in the middle of a LSB, possibly unevolved, disk raises interesting questions as how can an evolved component such as a bulge exist in an unevolved disk without affecting its evolution? Do bulges and disks evolve independently in LSB galaxies? Are bulge and disk surface brightnesses and sizes related? Galaxies towards the later types have a range in surface brightness and size. The early-type galaxies are mostly HSB or giant LSB galaxies. Do bulge dominated LSB galaxies form the “missing link” between HSB and giant LSB galaxies?
To explore some of these questions we selected and observed a sample of 20 LSB galaxies with bulges. This paper is organized in the following way: in section 2 we discuss the sample selection and reduction. The structural parameters, central surface brightness and scale length, will be discussed in section 3.1 and magnitudes in section 3.2. The colors and color profiles are described in section 3.3. These properties are then discussed and compared to the properties of disk dominated LSB and HSB galaxies in sections 4.1 and 4.2. A detailed look at the bulges is taken in section 4.3. We will summarize the discussion and give concluding remarks in section 5. We define a LSB galaxy to be a galaxy with a face-on disk central surface brightness one magnitude fainter than the Freeman value. In this paper we use = 75 km s-1 Mpc-1.
2 The sample and reduction
The sample of galaxies was taken from the ESO-LV catalog (Lauberts & Valentijn lauberts_valentijn (1989)). Here we will briefly describe the selection criteria with their justifications.
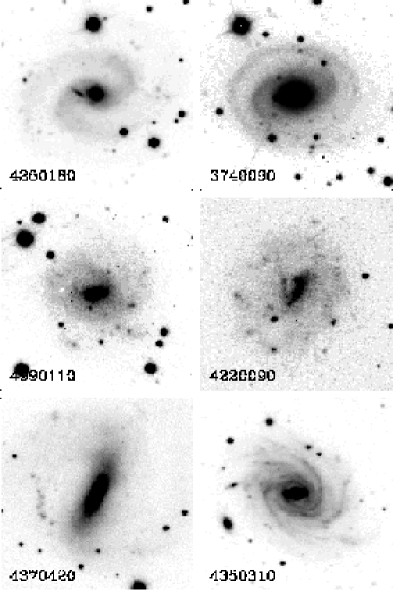
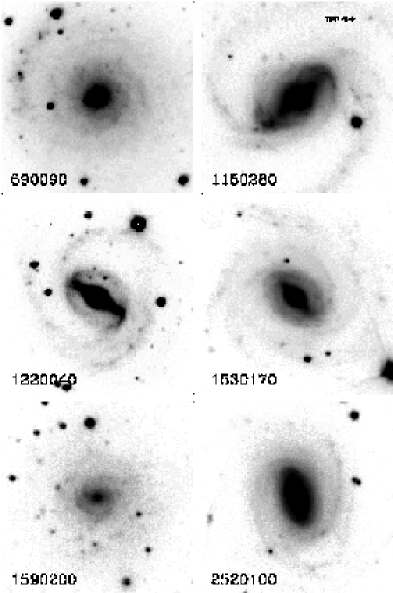
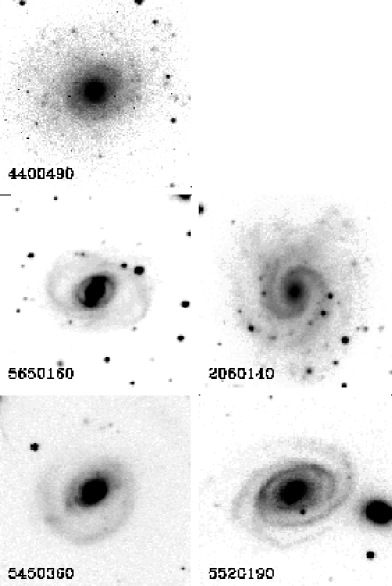
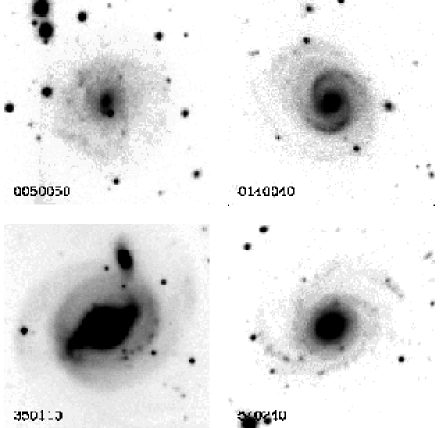
The galaxies were selected to have types Sa–Im so that we are not biasing ourselves to one person’s/algorithm’s classification scheme. The galactic latitudes were chosen so as to diminish foreground extinction ( ) and the inclinations were selected to be smaller than 50 to be not too sensitive to internal extinction. Furthermore, the surface brightnesses of the disks at half light radius were selected to be fainter than 23.8 B mag arcsec-2 and the diameters of the 26 B mag arcsec-2 isophotes were selected to lie between 1 (pick large enough galaxies) and 3 (chipsize limitation). These selection criteria resulted in approximately 600 galaxies. All these galaxies were inspected and selected on clean stellar foreground. From this subsample a random sample of galaxies which had central light concentrations was chosen. The result of this selection is that most of the galaxies in our sample have high surface brightness bulges embedded in low surface brightness disks. In the appendix R band images of our sample of LSB galaxies are shown. These images are presented using linear or exponential intensity scale (see captions) and central parts may be saturated. It can be seen from these images that we have roughly two types of bulge LSB galaxies in our sample. One type has a normal, round bulge and the other type has bars and rings. In table 1 we list relevant sample information. Column 1 contains the ESO-LV name of the galaxy, column 2 gives the right ascension (1950.0) and column 3 the declination (1950.0). Column 4 gives the distance (Mpc) as taken from the ESO-LV catalog. Where not available, redshifts were determined with the single dish Parkes telescope (de Blok et al. 1999, in preparation). The inclination as derived from the data is given in column 5 and total absolute B magnitudes as derived from the data are given in column 6. Hubble types are listed in column 7.
All BVRI images were taken with the 0.9 meter Dutch Telescope at La Silla in October 1993, January 1994 and in March 1994. The CCD image reduction was done using standard procedures in the Image Reduction and Analysis Facility (IRAF) and the Groningen Image Processing SYstem (GIPSY; van der Hulst et al. vdhulst2 (1992)). The average seeing was and the images have a limiting surface brightness of B mag arcsec-2. The main source of errors in determining magnitudes and colors is the uncertainty in the sky level. We measured the sky level in five boxes placed on parts of the image free of stellar emission. The mean difference between the median sky levels in these boxes was used as an estimate for the error introduced by subtracting the sky. We determined the position angles and inclinations from smoothed R images. Stars and cosmic ray defects were blanked prior to any fitting. We used fixed position angles, inclinations and ellipse centers to make ellipse fits to the isophotes of the galaxies and to integrate along these ellipses. Each band of a galaxy is thus fit with the exact same model. All magnitudes and colors have been corrected for atmospheric and galactic extinction. Extinctions in the B band were taken from the NED database.
| (1) | (2) | (3) | (4) | (5) | (6) | (7) |
|---|---|---|---|---|---|---|
| Name | D | i | Type | |||
| 2060140 | 06:27:10 | -48:43:42 | 200 | 37 | -21.91 | SAc |
| 1150280 | 02:42:31 | -60:07:28 | 87 | 52 | -20.57 | SBc |
| 1530170 | 02:03:21 | -55:20:58 | 88 | 44 | -20.86 | SABbc |
| 2520100 | 05:04:41 | -45:06:45 | 133 | 41 | -21.49 | SBb |
| 3500110 | 00:20:00 | -34:23:52 | 200 | 26 | -22.08 | - |
| 4220090 | 04:52:42 | -28:44:12 | 63 | 24 | -18.48 | SBd |
| 4250180 | 06:18:49 | -27:53:36 | 91 | 33 | -19.03 | SABd |
| 4990110 | 09:49:43 | -25:04:36 | 37 | 34 | -17.66 | SBd |
| 5450360 | 02:31:38 | -21:15:44 | 231 | 31 | -21.39 | SAa |
| 5520190 | 04:51:21 | -18:00:12 | 163 | 52 | -21.19 | S? |
| 1220040 | 06:41:38 | -61:01:12 | 127 | 51 | -20.50 | SBa |
| 0140040 | 02:42:13 | -78:20:24 | - | 35 | - | Sb |
| 1590200 | 05:33:22 | -55:54:48 | - | 27 | - | SABd |
| 3740090 | 09:52:49 | -33:49:30 | 37 | 36 | -17.80 | Sa |
| 4350310 | 09:59:16 | -30:28:06 | - | 42 | - | Sbc |
| 0050050 | 07:33:35 | -84:12:00 | - | 23 | - | SABdm |
| 0540240 | 03:51:32 | -72:05:30 | 196 | 33 | -20.77 | SABab |
| 5650160 | 09:31:54 | -21:45:12 | - | 41 | - | SB0/a |
| 0590090 | 07:36:33 | -70:35:48 | 20 | 28 | -17.69 | Sadm |
| 4370420 | 10:39:08 | -31:31:06 | 35 | 48 | -18.43 | SBc |
| 4400490 | 12:02:59 | -31:08:42 | 29 | 35 | - | SABd |


3 Structural parameters
3.1 Central surface brightnesses and scale lengths
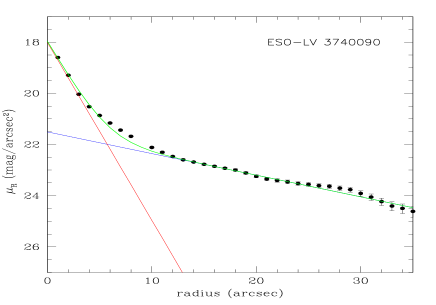
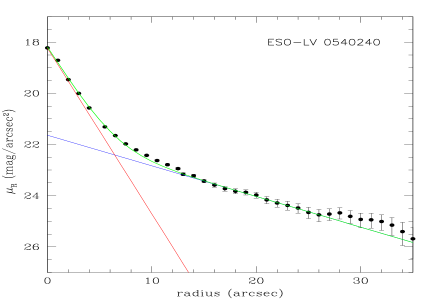
Most luminosity profiles clearly reveal the presence of a (HSB) bulge embedded in a low surface brightness disk (Figs. 1, upper panels). The profiles were decomposed into bulge and disk components by taking exponential profiles of the form
| (1) |
where is the central intensity (e.g. L⊙ pc-2), is the scale length of either bulge or disk and is taken to be 1 for both bulge and disk. Transforming to a logarithmic scale this equation becomes
| (2) |
where is the central surface brightness (mag arcsec-2) of either disk or bulge and is the distance along the major axis. Typical errors are 15% in scale length and 0.1 mag arcsec-2 in surface brightness. In the past people used r1/4 profiles for fitting bulges of all types of spiral galaxies. But it is now known that the bulge exponent correlates well with the morphological type of the galaxy. Ellipticals and S0’s have luminosity profiles that follow the r1/4 law (de Vaucouleurs de vaucouleurs (1948)), while bulges of Sa and Sb galaxies are better described by r1/2 profiles. The bulges of later types can be well represented by exponential () luminosity profiles (Andredakis andredakis (1997); de Jong de jong (1995), hereafter dJ95). However, the bulges of the galaxies in our sample were all better fitted with exponential profiles, regardless of their exact morphological types. This of course should not come as a surprise given the large difficulties in assigning Hubble types to such low contrast galaxies. Examples of bulge-disk decompositions are shown in Figs. 3.
The structural parameters derived from our fits are listed in Table LABEL:structural_parameters. The histograms of the structural disk parameters, scale length and central surface brightness, for our sample, a HSB sample (dJ95) and a giant LSB sample (Sprayberry et al. sprayberry (1995)) are shown in Fig. 2.
The distribution of B band disk scale lengths is very broad and has a median value of = 12.6 kpc. Our LSB sample has a median disk central surface brightness of = 23.04 B mag arcsec-2. There is no preferred value of either. The one HSB galaxy (ESO-LV 1150280) in our sample (Fig. 2) was not used in all further discussions and conclusions about bulge dominated LSB galaxies. The fact that there is only one HSB disk galaxy in our sample confirms that our selection was succesful in picking LSB disks.
3.2 Effect of seeing on bulge scale lengths
The typical sizes of the bulges in our sample are and the mean B band bulge scale length is 2.37″. The bulges are thus larger than the seeing disk () and only the innermost () parts are not resolved. In order to investigate the effect of seeing on the fitted bulge scale lengths we used the images of the galaxies with the smallest bulges as scaled models and smoothed these to various resolutions. It appeared that only the innermost one or two points are affected. The fitted scale lengths, which are largely determined by the outerpoints between radii of 2″and , do not change within the stated errors, so we did not attempt to correct for seeing.
3.3 Total magnitudes
Total apparent magnitudes can be determined by integrating Eq. 1 out to infinity and converting to a logarithmic scale:
| (3) |
Optical depth effects in the galaxies have not been taken into account, because of the small inclinations. However, we did not use Eq. 3 as depends on extrapolation of the light profile which introduces uncertainties. Furthermore, it does not take into account bars and rings which are clearly present in some of the galaxies in our sample. To determine total absolute magnitudes we used aperture magnitudes instead. We summed all the light to above sky ( B mag arcsec-2) and converted this to magnitudes. We used the distances listed in Table 1 to derive total absolute magnitudes. Figure 4 shows the distribution of absolute magnitudes derived in this way. It is evident that low surface brightness does not imply low luminosity. LSB galaxies can be very luminous.
3.4 Colors and color profiles
Radial color profiles were obtained by subtracting two radial luminosity profiles from each other. The bottom panels of Figs. 1 show color profiles of the colors B-R, B-V and R-I. The errors in the color profiles were estimated by adding in quadrature the errors in the surface brightness profiles. Most galaxies show color gradients and become bluer with increasing radius (declining profiles). It is believed that the dust content in disk LSB galaxies is low (dB95). Despite having no CO and metallicity information of the galaxies in our sample we probably can assume that some bulge LSB galaxies are also dust poor - in ESO-LV 4250180 you can actually see a background galaxy through the spiral arms. Then these color gradients are probably not caused by dust only. The bluer colors in the outer parts could be caused by relatively more light coming from a younger population at larger radii. This suggests that star formation started in the inner parts and progressed outwards.
Total integrated colors were determined by dividing sky-subtracted images and then integrating within ellipses. The same ellipse parameters as for determining the radial luminosity profiles have been used. We determined three total colors. The nuclear color is the color of the inner 10″. The luminosity weighted color is the color as measured through a large isophotal aperture covering almost the entire galaxy. The area weighted color is determined from the average of the colors of many pixel-sized apertures over the entire disk. When determining luminosity weighted colors most weight is given to bright regions (nucleus, H ii regions) of the galaxy. This is in contrast with area weighted colors where all parts have equal weight and only the area matters. Table 3 gives total colors of our sample. The estimated errors are mag.
4 Discussion
4.1 Structural parameters
Here and in the next subsection we will discuss the structural parameters and colors of bulge dominated LSB galaxies and compare them to disk dominated LSB galaxies and HSB galaxies. We will focus on trends to explore the question whether bulge dominated LSB galaxies fit in with the general trends defined by HSB galaxies, and more importantly, whether they form the “missing link” between HSB and giant LSB galaxies.
The majority of disk dominated LSB and HSB galaxies has disk scale lengths between 2 and 6 kpc (McGaugh & Bothun mc gaugh (1994); de Blok de blok (1997); dJ95). The galaxies in our sample have much larger disk scale lengths and the largest galaxies also have bulges. There appears a trend that the longest disk scale lengths appear in galaxies with the longest bulge scale lengths.
We use the Pearson correlation coefficient to determine the significance of the correlation and find r = 0.59. We thus find a restricted range for the bulge-to-disk ratios at the 99.8% probability level. The correlation between B band disk and bulge scale length is shown in Fig. 5 and is consistent with other studies (dJ95; Courteau et al. courteau (1996)).
However, the trend could be partly due to the selection criteria used, because we are discriminating against large bulge, small disk galaxies. Galaxies with compact, bright bulges and faint extended disks would comply to the criteria, but we do not have them in our sample. Furthermore, there are no large, pure disk, LSB galaxies known till now, so it is likely that only the area below the plotted trend is affected by selection effects. A correlation between disk and bulge scale length suggests that the formation of bulge and disk is coupled.
The ratio of disk-to-bulge scale length for both HSB and LSB galaxies has large scatter around and is illustrated in Fig. 6. The LSB galaxies continue the trend defined by HSB galaxies towards lower surface brightnesses.

| (1) | (2) | (3) | (4) | (5) | (6) | (7) | (8) | (1) | (2) | (3) | (4) | (5) | (6) | (7) | (8) |
| Name | Band | Name | Band | ||||||||||||
| 0140040 | B | 22.46 | 20.18 | 12.96 | 1.32 | - | - | 2060140 | B | 22.97 | 21.75 | 22.00 | 1.59 | 21.3 | 1.5 |
| V | 21.71 | 19.12 | 14.31 | 1.53 | - | - | V | 22.14 | 20.93 | 18.90 | 1.76 | 18.3 | 1.7 | ||
| R | 20.67 | 18.32 | 9.60 | 1.29 | - | - | R | 21.57 | 20.19 | 17.75 | 1.62 | 17.2 | 1.6 | ||
| I | 19.98 | 17.69 | 8.96 | 1.25 | - | - | I | 20.92 | 19.83 | 15.97 | 1.77 | 15.5 | 1.7 | ||
| 1590200 | B | 22.90 | 22.28 | 19.82 | 3.14 | - | - | 1150280 | B | 21.19 | 19.71 | 10.97 | 2.01 | 4.6 | 0.8 |
| V | 22.40 | 21.58 | 18.35 | 3.49 | - | - | V | 20.07 | 18.46 | 9.31 | 1.70 | 3.9 | 0.7 | ||
| R | 21.92 | 20.89 | 18.22 | 3.47 | - | - | R | 20.07 | 17.36 | 12.01 | 1.70 | 5.0 | 0.7 | ||
| I | 21.45 | 20.37 | 18.46 | 2.76 | - | - | I | 19.25 | 16.94 | 10.69 | 1.80 | 4.5 | 0.8 | ||
| 3740090 | B | 23.40 | 19.98 | 16.71 | 1.82 | 3.0 | 0.3 | 1530170 | B | 23.07 | 18.96 | 29.32 | 1.82 | 12.5 | 0.8 |
| V | 22.28 | 18.73 | 15.18 | 1.70 | 2.7 | 0.3 | V | 22.20 | 18.78 | 22.24 | 3.24 | 9.5 | 1.4 | ||
| R | 21.37 | 18.32 | 12.07 | 1.83 | 2.2 | 0.3 | R | 21.63 | 17.79 | 23.74 | 2.59 | 10.1 | 1.1 | ||
| I | 20.69 | 17.37 | 11.96 | 1.59 | 2.2 | 0.3 | I | 20.97 | 16.93 | 20.14 | 2.14 | 8.6 | 0.9 | ||
| 4350310 | B | 22.33 | 19.55 | 15.14 | 1.17 | - | - | 2520100 | B | 22.69 | 20.06 | 19.29 | 3.07 | 12.5 | 2.0 |
| V | 21.27 | 18.62 | 11.38 | 1.23 | - | - | V | 21.40 | 18.76 | 13.33 | 2.64 | 8.6 | 1.7 | ||
| R | 20.72 | 17.88 | 10.81 | 1.17 | - | - | R | 20.68 | 18.06 | 12.94 | 2.63 | 8.4 | 1.7 | ||
| I | 20.14 | 17.18 | 10.75 | 1.10 | - | - | I | 19.72 | 17.55 | 10.04 | 2.51 | 6.5 | 1.6 | ||
| 0050050 | B | 23.31 | 22.80 | 18.04 | 3.74 | - | - | 3500110 | B | 22.72 | 19.26 | 14.67 | 1.63 | 14.2 | 1.6 |
| V | 22.52 | 21.66 | 14.09 | 2.21 | - | - | V | 21.37 | 18.46 | 11.99 | 2.14 | 11.6 | 2.1 | ||
| R | 22.09 | 21.11 | 13.93 | 2.41 | - | - | R | 20.54 | 17.60 | 11.94 | 2.07 | 11.6 | 2.0 | ||
| I | 21.63 | 20.53 | 12.64 | 2.49 | - | - | I | 20.23 | 17.83 | 14.14 | 4.47 | 13.7 | 4.3 | ||
| 0540240 | B | 23.00 | 19.68 | 10.23 | 1.85 | 9.7 | 1.8 | 4220090 | B | 24.05 | 23.13 | 44.18 | 4.72 | 13.4 | 1.4 |
| V | 22.42 | 18.84 | 11.58 | 1.72 | 11.0 | 1.6 | V | 23.02 | 22.71 | 17.31 | 5.24 | 4.7 | 1.6 | ||
| R | 21.65 | 18.18 | 13.09 | 1.82 | 12.4 | 1.7 | R | 22.84 | 21.90 | 30.32 | 4.18 | 9.2 | 1.3 | ||
| I | 22.13 | 17.63 | 15.73 | 1.85 | 14.9 | 2.7 | I | 22.50 | 21.45 | 22.25 | 4.94 | 6.8 | 1.5 | ||
| 5650160 | B | 23.41 | 19.95 | 18.38 | 1.41 | - | - | 4250180 | B | 23.65 | 20.46 | 16.43 | 1.42 | 7.2 | 0.6 |
| V | 22.31 | 18.88 | 14.64 | 1.44 | - | - | V | 22.83 | 19.89 | 20.74 | 1.53 | 9.1 | 0.7 | ||
| R | 21.90 | 18.21 | 14.86 | 1.69 | - | - | R | 22.30 | 19.30 | 17.08 | 1.57 | 7.5 | 0.7 | ||
| I | 21.36 | 17.63 | 13.18 | 1.73 | - | - | I | 21.66 | 19.00 | 15.94 | 1.63 | 7.0 | 0.7 | ||
| 0590090 | B | 23.09 | 22.67 | 26.52 | 2.35 | 2.6 | 0.2 | 4990110 | B | 23.91 | 22.59 | 30.95 | 4.33 | 5.6 | 0.8 |
| V | 22.19 | 21.46 | 25.62 | 2.48 | 2.5 | 0.2 | V | 23.41 | 22.02 | 28.77 | 5.07 | 5.2 | 0.9 | ||
| R | 21.57 | 20.78 | 24.99 | 2.89 | 2.4 | 0.3 | R | 22.91 | 21.59 | 26.80 | 5.10 | 4.9 | 0.9 | ||
| I | 20.87 | 20.29 | 21.13 | 3.28 | 2.0 | 0.3 | I | 22.37 | 21.10 | 26.09 | 4.93 | 4.7 | 0.9 | ||
| 4370420 | B | 22.50 | 19.17 | 20.23 | 1.90 | 3.4 | 0.3 | 5450360 | B | 23.62 | 22.74 | 26.37 | 4.18 | 29.5 | 4.7 |
| V | 22.00 | 18.73 | 21.10 | 2.16 | 3.5 | 0.4 | V | 21.66 | 18.98 | 11.84 | 1.63 | 13.2 | 1.8 | ||
| R | 21.58 | 18.29 | 18.26 | 1.95 | 3.1 | 0.3 | R | 20.80 | 17.94 | 9.72 | 1.36 | 10.9 | 1.5 | ||
| I | 21.02 | 18.04 | 17.15 | 2.02 | 2.9 | 0.3 | I | 20.19 | 17.37 | 10.30 | 1.47 | 11.5 | 1.6 | ||
| 4400490 | R | 21.64 | 19.80 | 17.99 | 3.06 | 2.6 | 0.4 | 5520190 | B | 22.75 | 20.25 | 20.49 | 1.60 | 16.2 | 1.3 |
| 1220040 | B | 23.96 | 20.09 | 39.81 | 2.27 | 24.5 | 1.4 | V | 21.49 | 19.16 | 12.90 | 1.50 | 10.2 | 1.2 | |
| V | 23.18 | 18.97 | 33.06 | 2.20 | 20.3 | 1.3 | R | 20.86 | 18.78 | 12.32 | 1.75 | 9.7 | 1.4 | ||
| R | 22.67 | 18.28 | 25.20 | 2.07 | 15.5 | 1.3 | I | 20.33 | 18.04 | 11.98 | 1.54 | 9.5 | 1.2 | ||
| I | 21.89 | 17.59 | 21.83 | 2.04 | 13.4 | 1.3 | |||||||||
| Notes: | |||||||||||||||
| (1) ESO-LV name of the galaxy. | |||||||||||||||
| (2) Photometric band. | |||||||||||||||
| (3) Central disk surface brightness in mag arcsec-2. | |||||||||||||||
| (4) Central bulge surface brightness in mag arcsec-2. | |||||||||||||||
| (5) Exponential disk scale length in arcseconds. | |||||||||||||||
| (6) Exponential bulge scale length in arcseconds. | |||||||||||||||
| (7) Exponential disk scale length in kpc. | |||||||||||||||
| (8) Exponential bulge scale length in kpc. | |||||||||||||||
| nuc | lum | area | ||||||||||
|---|---|---|---|---|---|---|---|---|---|---|---|---|
| Name | B-V | B-R | V-R | R-I | B-V | B-R | V-R | R-I | B-V | B-R | V-R | R-I |
| ESO-LV 2060140 | 0.67 | 1.13 | 0.46 | 0.49 | 0.50 | 0.90 | 0.40 | 0.43 | 0.44 | 0.83 | 0.36 | 0.45 |
| 1150280 | 0.92 | 1.56 | 0.62 | 0.50 | 0.67 | 1.45 | 0.66 | 0.33 | 0.60 | 0.99 | 0.58 | 0.46 |
| 1530170 | 0.87 | 1.45 | 0.58 | 0.51 | 0.49 | 1.16 | 0.67 | 0.34 | 0.50 | 1.01 | 0.52 | 0.35 |
| 2520100 | 0.98 | 1.60 | 0.62 | 0.54 | 0.58 | 1.13 | 0.55 | 0.38 | 0.62 | 1.08 | 0.57 | 0.41 |
| 350110 | 1.09 | 1.81 | 0.72 | 0.75 | 0.95 | 1.68 | 0.73 | 0.75 | 0.89 | 1.63 | 0.69 | 0.88 |
| 4220090 | 0.49 | 0.93 | 0.44 | 0.34 | 0.26 | 0.76 | 0.49 | 0.24 | 0.30 | 0.73 | - | 0.18 |
| 4250180 | 0.67 | 1.13 | 0.46 | 0.42 | 1.32 | 1.40 | 0.08 | 0.43 | 0.96 | 1.22 | 0.18 | 0.50 |
| 4990110 | 0.59 | 0.98 | 0.39 | 0.39 | 0.92 | 1.11 | 0.19 | 0.42 | 0.62 | 1.01 | 0.34 | 0.47 |
| 5450360 | 1.06 | 1.72 | 0.66 | 0.62 | 1.05 | 1.62 | 0.57 | 0.65 | 0.92 | 1.41 | 0.54 | 0.69 |
| 5520190 | 0.95 | 1.56 | 0.61 | 0.54 | 0.39 | 0.60 | 0.21 | 0.55 | 0.57 | 1.20 | 0.52 | 0.57 |
| 1220040 | 0.93 | 1.43 | 0.50 | 0.58 | 0.87 | 1.16 | 0.29 | 0.50 | 0.66 | 0.74 | 0.36 | 0.54 |
| 140040 | 0.98 | 1.53 | 0.55 | 0.54 | 0.96 | 1.28 | 0.32 | 0.42 | 0.74 | 1.19 | 0.48 | 0.45 |
| 1590200 | 0.55 | 1.04 | 0.49 | 0.39 | 0.32 | 0.89 | 0.57 | 0.41 | 0.43 | 0.72 | 0.43 | 0.48 |
| 3740090 | 0.91 | 1.44 | 0.52 | 0.56 | 1.06 | 1.37 | 0.31 | 0.54 | 0.88 | 1.43 | 0.40 | - |
| 4350310 | 0.84 | 1.44 | 0.60 | 0.54 | 0.55 | 1.06 | 0.51 | 0.48 | 0.49 | 0.70 | 0.46 | 0.50 |
| 50050 | 0.53 | 0.91 | 0.38 | 0.31 | 0.49 | 0.94 | 0.45 | 0.10 | 0.37 | 0.67 | 0.27 | 0.26 |
| 540240 | 0.84 | 1.42 | 0.58 | 0.57 | 0.94 | 1.44 | 0.50 | 0.59 | 0.70 | 1.08 | 0.42 | 0.64 |
| 5650160 | 0.96 | 1.56 | 0.60 | 0.58 | 0.84 | 1.36 | 0.52 | 0.49 | 0.72 | 1.17 | 0.50 | 0.51 |
| 590090 | 0.69 | 1.12 | 0.43 | 0.40 | 0.61 | 0.99 | 0.38 | 0.30 | 0.59 | 0.96 | 0.37 | 0.43 |
| 4370420 | 0.58 | 0.83 | 0.25 | 0.34 | 0.63 | 0.84 | 0.21 | 0.35 | 0.53 | 0.74 | 0.14 | 0.45 |


In Fig. 7 we plot the distribution of disk central surface brightness with disk scale length for the samples of dJ95, dB95, Sprayberry and the current sample. All samples fit in with the general trend that there are no galaxies with high central surface brightnesses and large disk scale lengths. Some of the galaxies in our sample have such large disk scale lengths that they are found in the region of giant LSB galaxies and therefore could be classified as such.

To investigate whether disk and bulge central surface brightnesses are related we plot these parameters in Fig. 8 for the samples of dJ95 and our sample. The figure clearly shows how the LSB galaxies fill the low surface brightness region, but split into two groups; one near = 20 mag arcsec-2 and one near = 22 mag arcsec-2. These groups do not correspond to the two types of bulge LSB galaxies mentioned in Section 2, but the groups are a mixture of both these types. There seems to be a very broad general tendency for both HSB and LSB galaxies to have brighter bulge central surface brightnesses with increasing disk central surface brightnesses.

| ESO-LV # | band | B/D | ESO-LV # | band | B/D | |
|---|---|---|---|---|---|---|
| 2060140 | B | 0.02 | 140040 | B | 0.08 | |
| V | 0.03 | V | 0.12 | |||
| R | 0.03 | R | 0.16 | |||
| I | 0.03 | I | 0.16 | |||
| 1150280 | B | 0.13 | 1590200 | B | 0.04 | |
| V | 0.15 | V | 0.08 | |||
| R | 0.24 | R | 0.09 | |||
| I | 0.24 | I | 0.06 | |||
| 1530170 | B | 0.17 | 0050050 | B | 0.07 | |
| V | 0.50 | V | 0.05 | |||
| R | 0.41 | R | 0.07 | |||
| I | 0.47 | I | 0.11 | |||
| 2520100 | B | 0.29 | 540240 | B | 0.59 | |
| V | 0.44 | V | 0.60 | |||
| R | 0.46 | R | 0.93 | |||
| I | 0.46 | I | 0.87 | |||
| 350110 | B | 0.30 | 0590090 | B | 0.01 | |
| V | 0.47 | V | 0.02 | |||
| R | 0.45 | R | 0.03 | |||
| I | 0.91 | I | 0.04 | |||
| 4220090 | B | 0.03 | 5650160 | B | 0.14 | |
| V | 0.12 | V | 0.23 | |||
| R | 0.05 | R | 0.38 | |||
| I | 0.13 | I | 0.53 | |||
| 4250180 | B | 0.14 | 4370420 | B | 0.19 | |
| V | 0.08 | V | 0.21 | |||
| R | 0.13 | R | 0.24 | |||
| I | 0.12 | I | 0.21 | |||
| 4990110 | B | 0.07 | 4350310 | B | 0.08 | |
| V | 0.11 | V | 0.13 | |||
| R | 0.12 | R | 0.16 | |||
| I | 0.11 | I | 0.16 | |||
| 5450360 | B | 0.06 | 3740090 | B | 0.28 | |
| V | 0.22 | V | 0.33 | |||
| R | 0.28 | R | 0.38 | |||
| I | 0.27 | I | 0.38 | |||
| 5520190 | B | 0.06 | 1220040 | B | 0.11 | |
| V | 0.12 | V | 0.21 | |||
| R | 0.14 | R | 0.39 | |||
| I | 0.14 | I | 0.46 |
4.2 Colors
The color profiles (Figs. 1, bottom panels) show that in most galaxies the outer parts are bluer than the inner parts. It was shown by dB95 that this is also true for late-type LSB galaxies. It is hard to draw conclusions about the colors of the bulges judging from the color profiles alone. But one can reveal differences between disk and bulge colors by comparing bulge-to-disk (B/D) ratios in different wavelength bands. We determined B/D ratios by comparing the total light output of bulge and disk per passband. We noticed a clear tendency for the B/D ratios to increase towards the redder wavelengths (Table 4). This means that the bulges of LSB galaxies are redder than their disks, confirming a trend also observed for HSB galaxies (dJ95).
In Table 5 we present the integrated colors of the galaxies in our sample and those of disk dominated LSB (de Blok de blok (1997)) and giant LSB galaxies (Sprayberry et al. sprayberry (1995)). Prior to determining the mean nuclear color of the galaxies in our sample galaxies without a clear bulge were excluded. For the determination of the mean area weighted colors the galaxies without a clear bulge were included. The systems in our sample have redder area weighted colors than disk LSB galaxies and this would be more pronounced if the more or less bulgeless galaxies were left out of the sample.
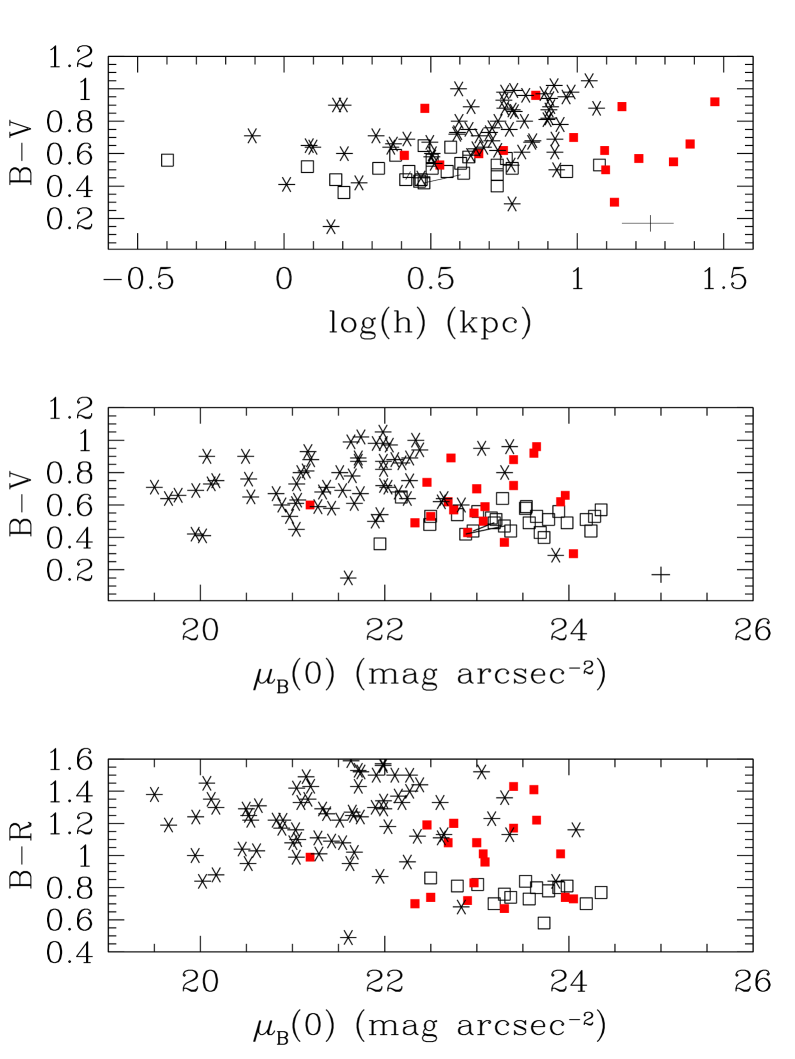
Figure 9 shows the distribution of B-V color with disk scale length (top) as well as the distribution of B-V color (center) and B-R color (bottom) with disk central surface brightness. There is no trend of central surface brightness with color and the colors do not depend on size. HSB galaxies cannot be the progenitors of LSB galaxies since galaxies fade and redden. The bluest galaxies are the disk dominated LSB galaxies and are concentrated in a rather small area whereas the HSB galaxies scatter over the entire color range towards the redder colors. The bulge dominated LSB galaxies fill up the region between these two samples. The large scatter in color for the bulge dominated LSB sample is due to the wider range in morphological types. The disk dominated LSB galaxies are quiescent and form a fairly uniform sample. The galaxies in our sample have red bulges, but some of them also have bars and (blue) rings making the spread in color larger than for a more uniform sample.
Some of the large bulge dominated LSB galaxies in our sample could easily be classified as giant LSB galaxies, judging from their sizes and luminosities. It is therefore instructive to compare the colors with those of giant LSB galaxies. The disk colors of the biggest galaxies in our sample are significantly bluer than giant disks (Table 5) and the B/D ratios are smaller than for typical giants (Sprayberry et al. sprayberry (1995)). So although they have bulges and very large low surface brightness disks, they are not as evolved as the giants.
The comparison of our sample with a large sample of typical “Freeman galaxies” (de Jong & van der Kruit de jong_vdkruit (1994)) not only shows that on average the bulge dominated LSB galaxies are bluer, but also that one can distinguish a LSB from a HSB galaxy of the same type by its bluer color.
| B-V | B-R | |||||
| (1) | (2) | (3) | (4) | (2) | (3) | (4) |
| Type | Nuc | Area | Disk | Nuc | Area | Disk |
| Bulge LSB | ||||||
| Disk LSB | ||||||
| Giant LSB | ||||||
| Largest galaxies | ||||||
| in our sample | ||||||
| Notes: | ||||||
| (1) Type of galaxy. | ||||||
| (2) Mean nuclear colors. | ||||||
| (3) Mean area weighted colors. | ||||||
| (4) Mean disk colors. | ||||||
4.3 Bulge formation scenarios for LSB galaxies
We will take a more detailed look at the two types of bulge LSB galaxies as described in section 2 to see if any systematic differences show up in their properties. We will also try to make some rough quantitative statements about the bulges of the galaxies in our sample.
Figure 10 shows the relation between various galaxy properties as derived from the photometry for both types of LSB galaxies present in our sample. In the two top panels both types follow roughly the expected trend of having redder nuclear colors than area weighted colors. In the bottom-left panel it is seen that the bulges do not follow the same trend as the disks; there are galaxies with large bulge scale lengths and high bulge central surface brightnesses. The galaxies with bars appear to have relatively high bulge central surface brightnesses, while the ones with round bulges show a large(r) spread. The bottom-right panel shows the division in high and lower luminosity galaxies, but both types are mixed.
On the basis of disk or bulge colors, scale lengths, surface brightnesses or absolute magnitudes no clear distinction can be made between the two types.
The correlation between bulge and disk scale lengths suggests that the formation of these two components is closely coupled. The restricted range of the ratio between bulge and disk scale lengths of is used as an argument for secular evolution models (Courteau et al. courteau (1996)). In this picture bulges form from small dynamical instabilities of disks which induce formation of bars. Secular accretion or satellite accretion in the center in turn can dissolve the bar into a spheroidal component (Norman et al. norman (1996)). If this scenario is correct then the bulges are relatively young.
However, the observed color gradients suggest that at larger radii the emitted light is dominated by a relatively young population of stars. This and the fact that the bulges are redder than the disks favors a scenario in which the bulge forms before the disk. It is hard to pin down the exact causes of the color gradients without metallicity and extinction information. Andredakis (andredakis2 (1998)) has shown that a correlation between bulge and disk scale lengths also quite naturally arises if the bulge were to be formed before the disk. If this scenario is correct then the bulges are relatively old.
By examining the bottom panels of Figs. 1 we see that the R-I gradient is in general less steep than the B-V and B-R gradients and the R-I profile is in most cases fairly constant. Comparison of bulge and disk colors shows that the color difference is smallest in R-I. This is reflected in the fact that the differences in B/D ratios are also smallest between R and I band for most of the galaxies in our sample. This could indicate that the old stellar populations in the bulge and disk are of approximately the same age. But without knowledge of metallicity, extinction, initial mass function, and/or star formation history it is hard to make any definite statements about the difference in age between bulge and disk. The effects that differences in these properties have on the colors of disk galaxies are extensively discussed in van den Hoek et al. (A&A submitted). Peletier & Balcells (peletier_balcells (1996)) conclude from their study of optical and near-infrared colors of 30 galaxies of types S0 to Sbc that the inner disks are only slightly younger than bulges. The difference in age generally lies somewhere between 0 and 3 Gyrs.

A natural question that arises is whether the bulges of LSB galaxies are different than those of HSB galaxies. To explore this question we compared the bulge parameters, central surface brightness (R band) and scale length, with a sample of 33 Sb,Sc type HSB galaxies (Andredakis 1997, see upper panel of Fig. 11). The bulge colors were compared with another sample of 30 S0–Sbc type galaxies (Peletier & Balcells peletier_balcells (1996), see bottom panel of Fig. 11). Andredakis’ sample uses r band photometry (Thuan & Gunn thuan_gunn (1976)), but that has no effect on our conclusions. Peletier & Balcells take the bulge color at 0.5 or at 5″, whichever is larger and the disk color at 2 K band scale lengths. We take the nuclear color as bulge color and the color at 2 R band disk scale lengths as disk color. No distinction can be made between bulges of HSB and LSB galaxies on basis of their structural parameters. The distribution of bulge colors of the LSB galaxies has a larger spread, but on average the bulges of HSB and LSB galaxies have similar colors. LSB disks are bluer making the differences between bulge and disk colors larger for LSB galaxies.

We note that all our conclusions are based on a small sample of LSB galaxies and it would clearly help if data for more bulge LSB galaxies would become available.
5 Summary
We have presented BVRI imaging of a sample of LSB galaxies with bulges. We find that these objects are well described as exponential disks with exponential bulges. The disk and bulge scale lengths of the galaxies have no preferred value. The central surface brightness does not depend on scale length or color, excluding fading scenarios. Despite the median central surface brightness of = 23.04 mag arcsec-2 the median scale length ( = 12.6 kpc) is very large. The largest galaxies have sizes and luminosities comparable to giant LSB galaxies.
By decomposing the luminosity profiles using double exponentials we find that the disk scale lengths are correlated with the bulge scale lengths. This suggest a coupling in the formation of bulge and disk.
The bulge dominated LSB galaxies are observed to be redder than disk dominated LSB galaxies. On average the colors are still bluer than the colors of typical Freeman galaxies. The B/D ratios are observed to increase towards the longer wavelengths indicating that the bulges of LSB galaxies are redder than their disks.
The ratios between bulge and disk scale lengths scatter around and the increase in B/D ratios towards longer wavelengths is consistent with observations of HSB spirals (dJ95). From the images shown in the appendix it is apparent that LSB galaxies exist in a wide range of morphological types. There seem to be roughly two types of bulge LSB galaxies in our sample. There are the ones with normal (round) bulges and the ones that look like they are undergoing some heavy evolution with blue rings and bars. But besides appearance no systematic differences show up in the rest of their investigated properties.
It remains unclear whether the bulge formed before or after the disk. More observations are needed to resolve this issue. We did not find any systematic differences in structural parameters or colors of the bulges between LSB and HSB galaxies.
To unravel the evolutionary history of bulge dominated LSB galaxies we need additional information on H i content and distribution, and chemical abundance information. Our sample has extended the fact that LSB galaxies cover a wide range in color, luminosity, size and morphology. The bulge dominated LSB galaxies fit in with the general trends defined by their HSB counterparts.
Acknowledgements.
We thank Adwin Boogert, Jos de Bruyne and Lodewijk Bonebakker for obtaining the data. We thank Roelof de Jong for making his data of a large sample of spirals available to us. This research has made use of the NASA/IPAC Extragalactic Database (NED) which is operated by the Jet Propulsion Laboratory, California Institute of Technology, under contract with the National Aeronautics and Space Administration.References
- (1) Andredakis, Y.C., 1998, MNRAS, 295, 725
- (2) Andredakis, Y.C., 1997, Ph. D. Thesis, University of Groningen
- (3) Courteau, S., de Jong, R., Broeils, A., 1996, ApJ, 457, L73
- (4) Bothun, G.D, Impey, C., McGaugh, S.S., 1997, PASP, 109, 745
- (5) de Blok, W.J.G., 1997, Ph. D. Thesis, University of Groningen
- (6) de Blok, W.J.G., van der Hulst, J.M., McGaugh, S.S., 1996a, AAS, 189
- (7) de Blok, W.J.G., McGaugh, S.S., van der Hulst, J.M., 1996b, MNRAS, 283, 18
- (8) de Blok, W.J.G., van der Hulst, J.M., Bothun, G.D., 1995, MNRAS 274, 235
- (9) de Jong, R.S., 1995, Ph. D. Thesis, University of Groningen
- (10) de Jong, R.S., van der Kruit, P.C., 1994, A&AS, 106, 451
- (11) de Vaucouleurs, G., 1948, Ann. d’Astrophys., 11, 247
- (12) Freeman, K.C., 1970, ApJ, 160, 811
- (13) Impey, C., Bothun, G.D., 1997, ARA&A, 35, 267
- (14) Kennicutt, R.C., 1989, ApJ, 344, 685
- (15) Lauberts, A., Valentijn, E.A., 1989, The Surface Photometry Catalogue of the ESO-Uppsala Galaxies (ESO-LV). European Southern Observatory
- (16) McGaugh, S.S., Bothun, G.D., 1994, AJ, 107, 530
- (17) Norman, C.A., Sellwood, J.A., Hasan, H., 1996, ApJ, 462, 114
- (18) O’Neil, K., Bothun, G., Cornell, M., 1997, AJ, 113, 1212
- (19) Peletier, R.F., Balcells, M., 1996, AJ, 111, 2238
- (20) Pickering, T.E., Impey, C.D., van Gorkom, J.H., Bothun, G.D., 1997, AJ, 114, 1858
- (21) Sprayberry, D., Impey, C.D., Bothun, G.D., Irwin, M.J., 1995, AJ, 109, 558
- (22) Thuan, T.X., Gunn, J.E., 1976, PASP, 88, 543
- (23) van den Hoek, L.B., de Blok, W.J.G., van der Hulst, J.M., de Jong, T, 1998, A&A, submitted
- (24) van der Hulst, J.M., Terlouw, J.P., Begeman, K.G., Zwitser, W., Roelfsema, P.R., in Astronomical Data Analysis Software and Systems I, eds. Worrall, D.M., Biemesderfer, C., Barnes, J., ASP Conference Series, 1992, vol. 25, 131
- (25) van der Hulst, J.M., Skillman, E.D., Smith, T.R., Bothun, G.D., McGaugh, S.S., de Blok, W.J.G., 1993, AJ, 106, 548
Appendix A R band images of sample galaxies