Density Profiles of Dark Matter Halo are not Universal
Abstract
We perform a series of high – resolution N-body simulations designed to examine the density profiles of dark matter halos. From 12 simulated halos ranging the mass of (represented by million particles within the virial radius), we find a clear systematic correlation between the halo mass and the slope of the density profile at 1% of the virial radius, in addition to the variations of the slope among halos of the similar mass. More specifically, the slope is , , and for galaxy, group, and cluster mass halos, respectively. While we confirm the earlier simulation results that the inner slope is steeper than the universal profile originally proposed by Navarro, Frenk & White, this mass dependence is inconsistent with the several analytical arguments attempting to link the inner slope with the primordial index of the fluctuation spectrum. Thus we conclude that the dark matter density profiles, especially in the inner region, are not universal.
1 Introduction
Can one recover (some aspects of) the initial conditions of the universe from the distribution of galaxies at ? A conventional answer to this question is affirmative, provided that the effect of a spatial bias is well understood and/or if it does not significantly alter the interpretation of the observed distribution. This consensus underlies the tremendous effort in the past and at present to extract the cosmological implications from the existing and future galaxy redshift surveys. The two-point correlation function is a good example supporting this idea; on large scales it is trivially related to the primordial spectrum of mass fluctuations, . Furthermore the effective power-law index of the two-point correlation function on sufficiently small scales is related to the initial power-law index of as (e.g. Peebles (1980); Suginohara et al. (1991); Suto (1993)). In other words, the initial conditions of the universe are imprinted in the behavior of galaxies on small scales (again apart from the effect of bias). This is why the phenomenological fitting formulae for the nonlinear power spectrum (Hamilton et al., 1991; Jain, Mo, & White, 1995; Peacock & Dodds, 1996; Ma, 1998) turn out to be so successful. This fact, however, seems to be in conflict with the universal density profile proposed by Navarro, Frenk & White (1996,1997; hereafter NFW) for virialized dark matter halos. In their study, NFW selected halos which look to be virialized, and found that the density profiles universally obey the NFW form . It is yet unclear to which degree their results are affected by their selection criterion which is not well-defined. In general, different halos should have experienced different merging histories depending on their environment and mass. Thus even if the halos do have a universal density profile statistically (i.e., after averaging over many realizations), it is also natural that individual halo profiles are intrinsically scattered around the universal profile (Jing, 1999). Definitely this is a matter of semantics to a certain extent; the most important finding of NFW is that such halo-to-halo variations are surprisingly small.
A universal density profile was also reported by Moore et al. (1999) on the basis of high – resolution simulations of one cluster-mass halo and four galaxy-mass halos, and they claim that the density profile in the most inner region. In what follows, we will address the following quantitative and specific questions concerning the halo profile, especially its most inner region, using the high-resolution -body simulations; the inner slope of the halo profile is really described by or universally as NFW and Moore et al. (1999) claimed ? If not, does the slope vary among the different halos ? Is there any systematic correlation between the slope and the mass of halos ?
In fact, some of the above questions have been partially addressed previously with different approaches and methodologies (Fukushige & Makino, 1997; Evans & Collet, 1997; Moore et al., 1998; Syer & White, 1998; Nusser & Sheth, 1999; Jing, 1999; Avila-Reese et al., 1999). In order to revisit those in a more systematic and unambiguous manner, we have developed a nested grid P3M N-body code designed to the current problem so as to ensure the required numerical resolution in the available computer resources. This enables us to simulate 12 realizations of halos in a low-density cold dark matter (LCDM) universe with particles in a range of mass .
2 Simulation procedure
As Fukushige & Makino (1997) and later Moore et al. (1998) demonstrated, the inner profile of dark matter halos is substantially affected by the mass resolution of simulations. To ensure the required resolution (at least comparable to theirs), we adopt the following two-step procedure. A detailed description of the implementation and resolution test will be presented elsewhere.
First we select dark matter halos from our previous cosmological P3M N-body simulations with particles in a cube (Jing & Suto, 1998; Jing, 1998). To be specific, we use one simulation of the LCDM model of , , and according to Kitayama & Suto (1997). The mass of the individual particle in this simulation is . The candidate halo catalog is created using the friend-of-friend grouping algorithm with the bonding length of 0.2 times the mean particle separation.
We choose twelve halos in total from the candidate catalog so that they have mass scales of clusters, groups, and galaxies (Table 1). Except for the mass range, the selection is random, but we had to exclude about 40% halos of galactic mass from the original candidates since they have a neighboring halo with a much larger mass. We use the multiple mass method to re-simulate them. To minimize the contamination of the coarse particles on the halo properties within the virial radius at , , we trace back the particles within of each halo to their initial conditions at redshift . This is more conservative than that adopted in previous studies, and in fact turned out to be important for galactic mass halos. Note that we define such that the spherical overdensity inside is times the critical density, .
Then we regenerate the initial distribution in the cubic volume enclosing these halo particles with larger number of particles by adding shorter wavelength perturbation to the identical initial fluctuation of the cosmological simulation. Next we group fine particles into coarse particles (consisting of at most 8 fine particles) within the high-resolution region if they are not expected to enter the central halo region within . As a result, there are typically simulation particles, fine particles and coarse particles for each halo. Finally about particles end up within of each halo. Note that this number is significantly larger than those of NFW, and comparable to those of Fukushige & Makino (1997) and Moore et al. (1998, 1999). The contamination of the coarse particles, measured by the ratio of the mass of the coarse particles within the virial radius to the total virial mass, is small, about , , and for cluster, group, and galactic halos respectively.
We evolve the initial condition for the selected halo generated as above using a new code developed specifically for the present purpose. The code implements the nested-grid refinement feature in the original P3M N-body code of Jing & Fang (1994). Our code implements a constant gravitational softening length in comoving coordinates, and we change its value at , 3, 2, and 1 so that the proper softening length (about 3 times the Plummer softening length) becomes 0.004 . Thus our simulations effectively employ the constant softening length in proper coordinates at . The first refinement is placed to include all fine particles, and the particle-particle (PP) short range force is added to compensate for the larger softening of the particle-mesh (PM) force. When the CPU time of the PP computation exceeds twice the PM calculation as the clustering develops, a second refinement is placed around the center of the halo with the physical size about of that of the first refinement. The mesh size is fixed to for the parent periodic mesh and for the two isolated refinements. The CPU time for each step is about minutes at the beginning and increases to minutes at the final epoch of the simulation on one vector processor of Fujitsu VPP300 (peak CPU speed of 1.6 GFLOPS). A typical run of time steps, which satisfies the stability criteria (Couchman et al. 1995), takes CPU hours to complete.
3 Results
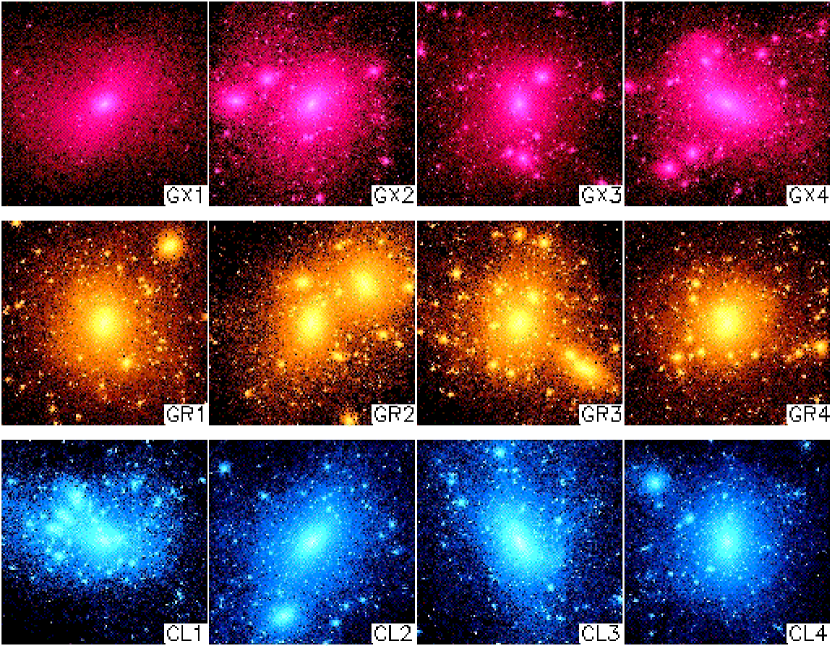
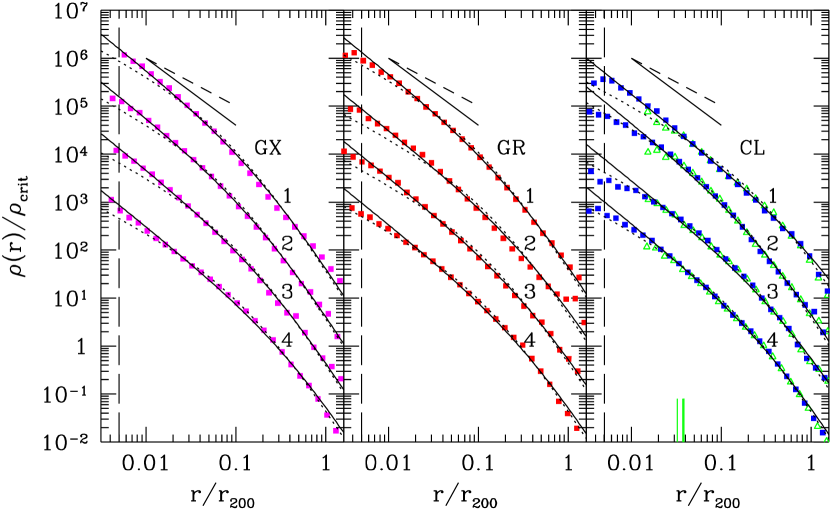
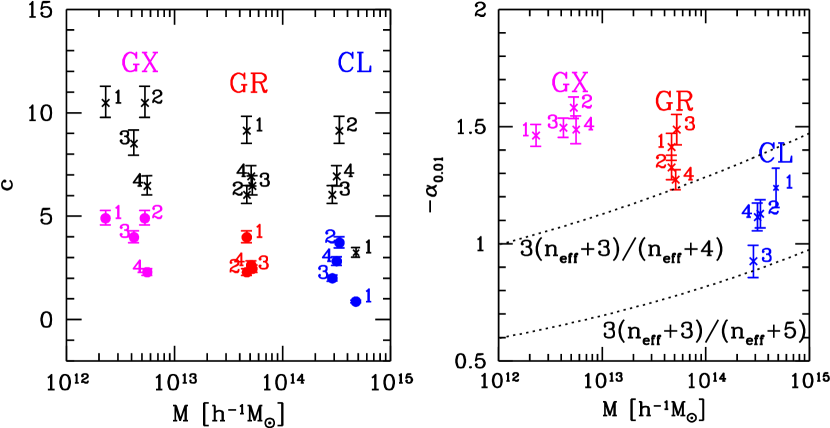
Figure 1 displays the snapshot of the twelve halos at . Clearly all the halos are far from spherically symmetric, and surrounded by many substructures and merging clumps. This is qualitatively similar to that found by Moore et al. (1998, 1999) for their high-resolution halos in the CDM model. The corresponding radial density profiles are plotted in Figure 2. The halo center is defined as the position of the particle which possesses the minimum potential among the particles within the sphere of radius around the center-of-mass of the fine particles. In spite of the existence of apparent sub-clumps (Fig. 1), the spherically averaged profiles are quite smooth and similar to each other as first pointed out by NFW. The inner slope of the profiles, however, is generally steeper than the NFW value, , in agreement with the previous findings of Fukushige & Makino (1997) and Moore et al. (1998). We have fitted the profiles to with (similar to that used by Moore et al.1999; the solid curves) and (NFW form; the dotted curves) for , where is the radius within which the spherical overdensity is . The resulting concentration parameter , defined as the , is plotted in the left panel of Figure 3. This is the most accurate determination of the concentration parameter for the LCDM model. There exists a significant scatter among for similar mass (Jing, 1999), and a clear systematic dependence on halo mass (NFW, Moore et al. (1999)).
The most important result is that the density profiles of the 4 galactic halos are all well fitted by , but those of the cluster halos are better fitted to the NFW form . This is in contrast with Moore et al. (1999) who concluded that both galactic and cluster halos have the inner density profile , despite that they considered one cluster-mass halo alone. In fact, our current samples can address this question in a more statistical manner. CL1 has significant substructures, and the other three are nearly in equilibrium. Interestingly the density profiles of CL2 and CL3 are better fitted to the NFW form, and that of CL4 is in between the two forms. The density profiles of the group halos are in between the galactic and cluster halos, as expected. One is better fitted to the NFW form, whereas the other three follow the form.
To examine this more quantitatively, we plot the inner slope fitted to a power-law for as a function of the halo mass in the right panel of Figure 3. This figure indicates two important features; a significant scatter of the inner slope among the halos with similar masses and a clear systematic trend of the steeper profile for the smaller mass. For reference we plot the predictions for the slope, by Hoffman & Shaham (1985) and by Syer & White (1998), using for the effective power-law index of the linear power spectrum at the corresponding mass scale(Table 1). With a completely different methodology, Nusser & Sheth (1999) argue that the slope of the density profile within is in between the above two values. On the basis of the slope – mass relation that we discovered, we disagree with their interpretation; for the galactic halos, the analytical predictions could be brought into agreement with our simulation only if the effective slope were , which is much larger than the actual value on the scale.
We would like to emphasize that our results are robust against the numerical resolution for the following reasons. Since we have used the same time steps and the same force softening length in terms of , the resolution effect, which is generally expected to make the inner slope of shallower, should influence the result of the galactic halos more than that of cluster halos. In fact this is opposite to what we found in the simulation. Furthermore our high–resolution simulation results agree very well with those of the lower–resolution cosmological simulations (open triangles) for the cluster halos on scales larger than their force softening length (short thin lines at the bottom of Figure 2). We have also repeated the simulations of several halos employing 8 times less particles and 2 times larger softening length, and made sure that the force softening length (the vertical dashed lines of Figure 2) is a good indicator for the resolution limit.
4 Conclusion and Discussion
In this Letter we have presented the results of the largest, systematic study on the dark matter density profiles. This is the first study which simulates a dozen of dark halos with about a million particles in a flat low-density CDM universe. This enables us to address the profile of the halos with unprecedented accuracy and statistical reliability. While qualitative aspects of our results are not inconsistent with those reported by Moore et al. (1999), our larger sample of halos provides convincing evidence that the form of the density profiles is not universal; instead it depends on halo mass. Since mass and formation epoch are linked in hierarchical models, the mass dependence may reflect an underlying link to the age of the halo. Older galactic halos more closely follow the form while younger cluster halos have shallower inner density profiles fitted better by the NFW form. Whether this difference represents secular evolution remains to be investigated in future experiments.
Our results are not fully expected by the existing analytical work. Although the analytical work (Syer & White, 1998; Nusser & Sheth, 1999; Lokas, 1999) concluded that the inner profile should be steeper than , their interpretation and/or predicted mass-dependence are different from our numerical results. This implies that while their arguments may cover some parts of the physical effects, they do not fully account for the intrinsically complicated nonlinear dynamical evolution of non-spherical self-gravitating systems.
We also note that the small-scale power which was missed in the original cosmological simulation has been added to the initial fluctuation of the halos. The fact that each halo has approximately the same number of particles means that more (smaller-scale) power has been added to the low mass halos than to the high mass ones. It is yet unclear how much effect this numerical systematics would have on the mass dependence of the inner slope found in this paper, and we will investigate this question in future work.
In summary, the mass dependence of the inner profile indicates the difficulty in understanding the halo density profile from the cosmological initial conditions in a straightforward manner. Even if the density profiles of dark halos are not universal to the extent which NFW claimed, however, they definitely deserve further investigation from both numerical and analytical points of view.
References
- Avila-Reese et al. (1999) Avila-Reese, V., Firmani, C., Klypin, A., Kravtsov, A.V. 1999, astro-ph/9906260
- Couchman, Thomas, & Pearce (1995) Couchman, H.M.P., Thomas, P.A., & Pearce, F.R. 1995, ApJ, 452, 797
- Eke, Navarro, & Frenk (1998) Eke, V.R, Navarro, J.F., & Frenk, C.S. 1998, ApJ, 503, 569
- Evans & Collet (1997) Evans, N.W. & Collett, J.L. 1997, ApJ, 480, L103
- Fukushige & Makino (1997) Fukushige, T., & Makino, J. 1997, ApJ, 477, L9
- Hamilton et al. (1991) Hamilton, A.J.S., Kumar, P., Lu, E., & Matthews, A. 1991, ApJ, 374, L1
- Hoffman & Shaham (1985) Hoffman, Y., & Shaham, J. 1985, ApJ, 297, 16
- Jain, Mo, & White (1995) Jain, B., Mo, H.J., & White, S.D.M. 1995, MNRAS, 276, 25
- Jing (1998) Jing, Y. P. 1998, ApJ, 503, L9
- Jing (1999) Jing, Y. P. 1999, ApJ, submitted (astro-ph/9901340)
- Jing & Fang (1994) Jing, Y.P. & Fang, L.Z. 1994,ApJ, 432, 438
- Jing & Suto (1998) Jing, Y.P. & Suto, Y. 1998, ApJ, 494, L5
- Kitayama & Suto (1997) Kitayama, T. & Suto, Y. 1997, ApJ, 490, 557
- Lokas (1999) Lokas, E.L. 1999, MNRAS, in press (astro-ph/9901185)
- Ma (1998) Ma, C.-P. 1998, ApJ, 508, L5
- Moore et al. (1998) Moore, B., Governato, F., Quinn, T., Stadel, J., & Lake, G. 1998, ApJ, 499, L5
- Moore et al. (1999) Moore, B., Quinn, T., Governato, F., Stadel, J., & Lake, G. 1999, MNRAS, submitted, astro-ph/9903164
- Navarro, Frenk, & White (1996) Navarro, J.F., Frenk, C.S., & White, S.D.M. 1996, ApJ, 462, 563
- Navarro, Frenk, & White (1997) Navarro, J.F., Frenk, C.S., & White, S.D.M. 1997, ApJ, 490, 493
- Nusser & Sheth (1999) Nusser, A., & Sheth, R.K. 1999, MNRAS, 303, 685
- Peacock & Dodds (1996) Peacock, J.A. & Dodds, S.J. 1996, MNRAS, 280, L19
- Peebles (1980) Peebles, P.J.E. 1980, The Large Scale Structure of the Universe (Princeton University Press: Princeton)
- Suginohara et al. (1991) Suginohara, T., Suto, Y., Bouchet, F.R., & Hernquist, L. 1991, ApJS, 75, 631
- Suto (1993) Suto, Y. 1993, Prog.Theor.Phys., 90, 1173
- Syer & White (1998) Syer, D., & White, S.D.M. 1998, MNRAS, 293, 337
| ID | aaMass of the halo within its virial radius, in units of . | bbNumber of particles within its virial radius. | ccthe virial radius, in units of Mpc. | ddthe effective slope of the linear power spectrum at the halo mass scale. |
|---|---|---|---|---|
| GX 1 | 458,440 | 0.269 | ||
| GX 2 | 840,244 | 0.356 | ||
| GX 3 | 694,211 | 0.330 | ||
| GX 4 | 1,029,895 | 0.363 | ||
| GR 1 | 772,504 | 0.735 | ||
| GR 2 | 907,489 | 0.736 | ||
| GR 3 | 831,429 | 0.764 | ||
| GR 4 | 901,518 | 0.758 | ||
| CL 1 | 522,573 | 1.59 | ||
| CL 2 | 839,901 | 1.42 | ||
| CL 3 | 664,240 | 1.35 | ||
| CL 4 | 898,782 | 1.39 |