Resolving the Stellar Populations in a Lensed Galaxy111Based in large part on observations made at the W. M. Keck Observatory
Abstract
We present deep near-infrared Keck/NIRC imaging of a recently-discovered galaxy (Frye & Broadhurst 1998). This is lensed by the rich foreground cluster Abell 2390 () into highly-magnified arcs 3–5″ in length. Our - and -band NIRC imaging allows us to map the Balmer Å break amplitude. In combination with high-quality archival HST/WFPC 2 data, we can spatially resolve stellar populations along the arcs. The WFPC 2 images clearly reveal several bright knots, which correspond to sites of active star formation. However, there are considerable portions of the arcs are significantly redder, consistent with being observed Myr after star formation has ceased. Keck/LRIS long-slit spectroscopy along the arcs reveals that the Ly- emission is spatially offset by ″ from the rest-UV continuum regions. We show that this line emission is most probably powered by star formation in neighboring H II regions, and that the system is unlikely to be an AGN.
Subject headings:
galaxies: evolution — galaxies: formation — galaxies: stellar content — galaxies: clusters: individual (Abell 2390) — (cosmology:) gravitational lensing1. Introduction
Although galaxies are being found in increasing numbers (e.g., Steidel et al. 1996a,b; Spinrad et al. 1998; Dey et al. 1998), their study has been almost exclusively through rest-ultraviolet (UV) flux redshifted into the optical. As such, we merely know about the near-instantaneous star formation rate – the UV continuum is dominated by massive short-lived OB-stars, and hence is sensitive to star formation on the timescale of only Myr. From imaging of local galaxies, morphologies in the UV can be very different from the appearance in the optical (e.g., O’Connell 1997). A comprehensive study of the underlying stellar populations should also utilize longer rest wavelengths, where the light from older and less massive (but more numerous) stars may dominate.
A useful spectral feature in the study of stellar populations is the 4000 Å break, which arises from metal-line blanketing (predominantly Fe II) in late-type stars. Even if the stellar population is only moderately evolved, there will still be the Balmer break, dominated by an A-star population. At high redshift, these rest-frame optical breaks are redshifted into the near-infrared. Spinrad, Dey & Graham (1995) report a detection of an ‘old’ stellar continuum from infrared imaging of a radio galaxy, and studies of more modest redshift galaxies (e.g., LBDS 53W091 at ) suggest the presence of stars older than Gyr, implying immense formation redshifts (Dunlop et al. 1997; Spinrad et al. 1997).
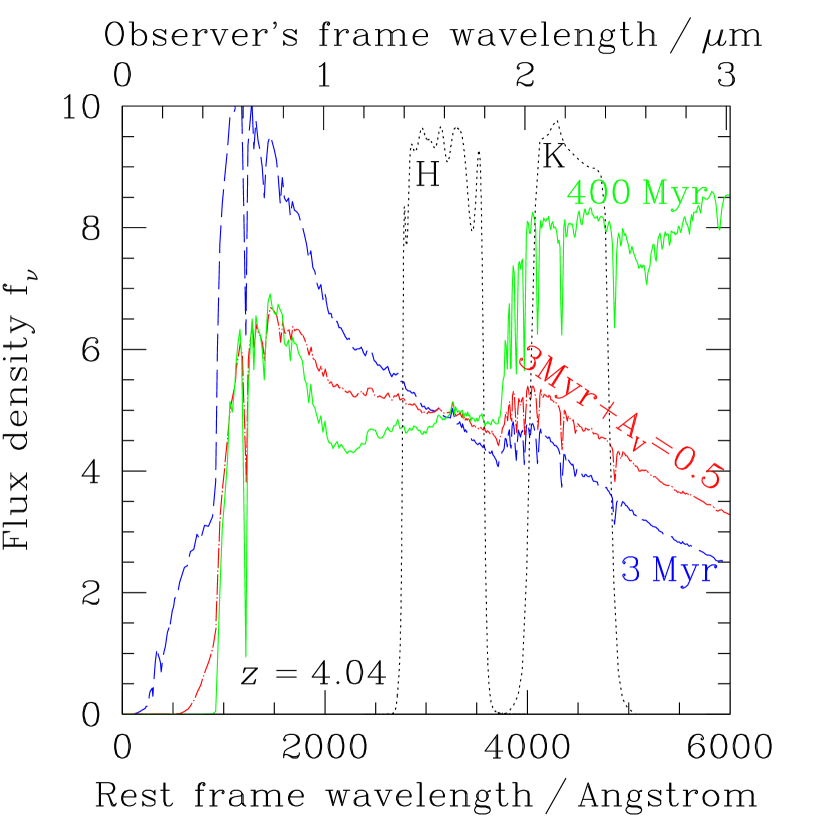
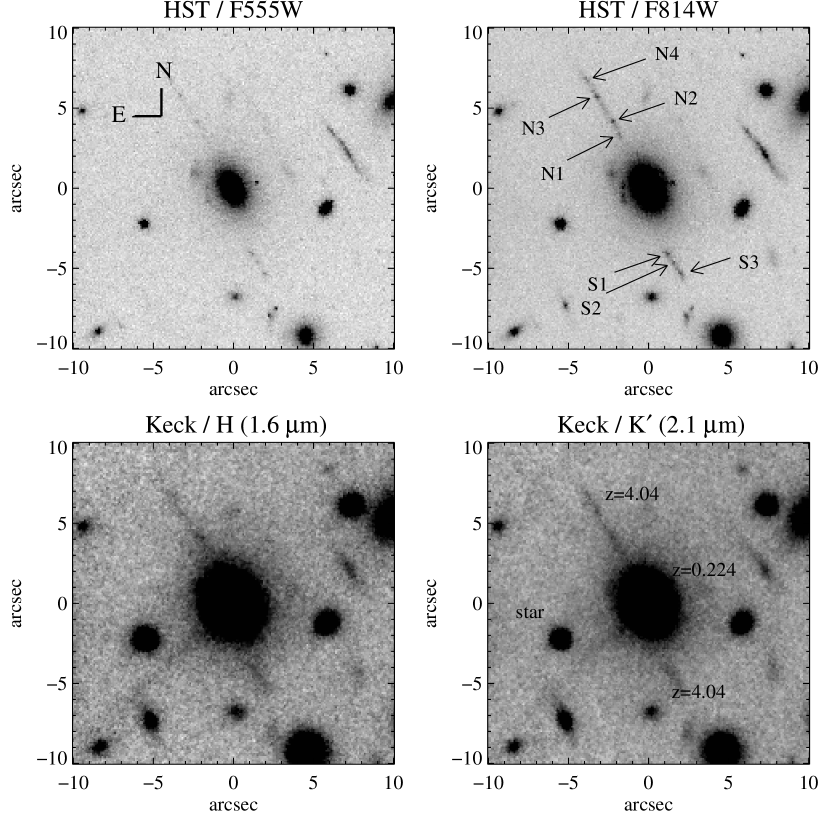
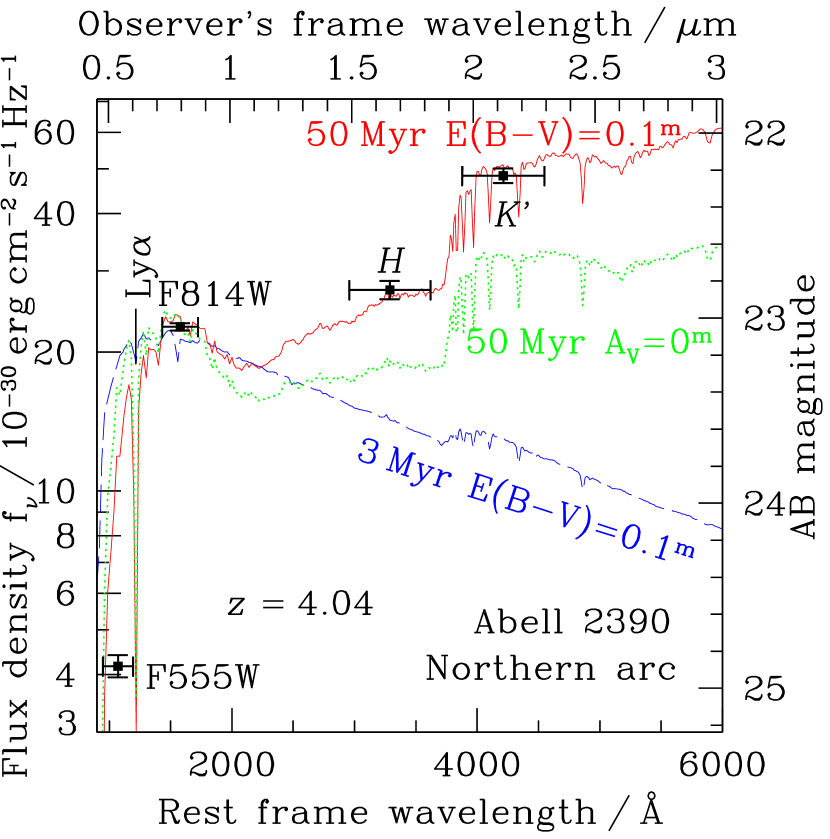
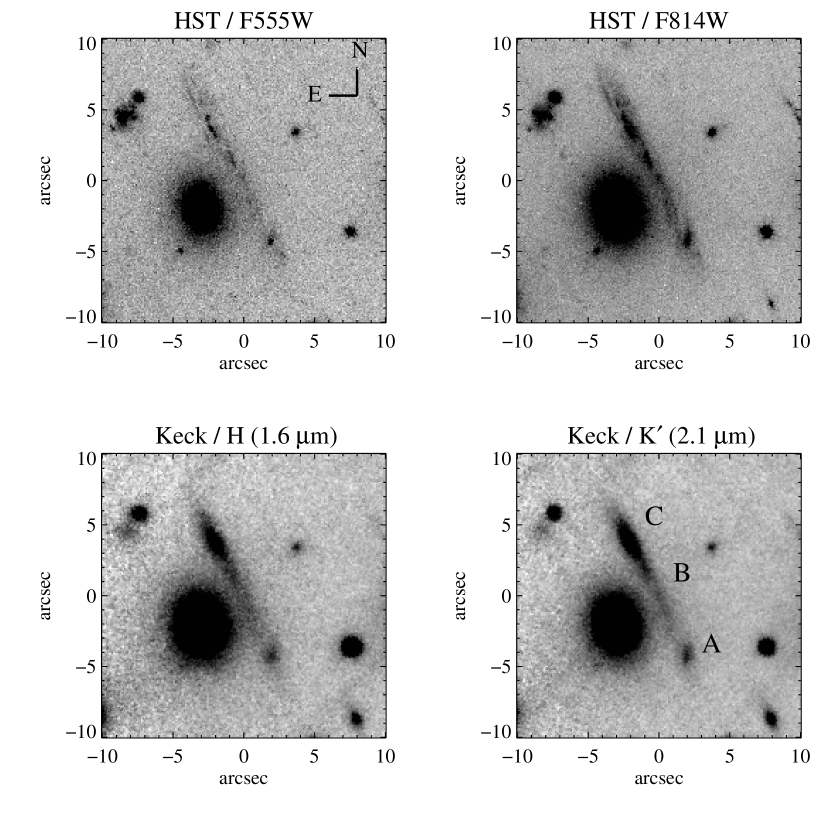
At , the (m) and (m) near-infrared (IR) pass-bands straddle the rest-frame 4000 Å Balmer break (Figs. 1 & 2). For a spatially-resolved source, it is possible to map the underlying stellar populations through these colors, provided this break is not washed-out by a current star-burst. Here we present an infrared study of stellar populations in a recently-discovered lensed galaxy at (Frye & Broadhurst 1998, hereafter FB98). This system of arcs (Fig. 3) is among the highest-redshift gravitationally-magnified galaxies known (see also Trager et al. 1997; Franx et al. 1997). These lensed sources are highly amplified but are not pre-selected for some AGN characteristic or extreme luminosity, nor are they preferentially color-selected for a young stellar population. We will show in § 3.4 & § 5.5 that these arcs are likely to be lensed images of a normal galaxy, affording us the opportunity to study stellar populations in the early Universe. Hence, we can address whether galaxies at the highest known redshifts are genuine ‘proto-galaxies’, observed in the throes of a massive initial starburst, or whether the star formation history is more extended and we are witnessing ‘mature’ systems.
The structure of this paper is as follows: in § 2 we describe the optical imaging with the Hubble Space Telescope (HST), and § 3 presents spatially-resolved optical spectroscopy obtained with the Low Resolution Imaging Spectrograph (LRIS) on the 10-m Keck II telescope. Our near-infrared imaging of these arcs with the Near Infrared Camera (NIRC) on Keck I is detailed in § 4. The broad-band optical/near-infrared colors are used to constrain the dust extinction and stellar populations in § 5, in which we also address the lensing magnification and the intrinsic luminosity of this system. Our conclusions are summarized in § 6, and in Appendix A we present our near-IR/optical photometry of the nearby “straight arc” (Pelló et al. 1991). Throughout, we assume a cosmology with a vanishing cosmological constant (), and () unless otherwise stated. At , the Universe is only Gyr ( Gyr) old, a look-back time of 91% (87%) the age of the Universe. The proper motion distance is Gpc ( Gpc), and in the absence of magnification, 1″ corresponds to a projected physical distance of kpc ( kpc).
2. Lensed Arcs at High Redshift Behind Abell 2390
Deep ground-based imaging (e.g., Pelló et al. 1991; Squires et al. 1996) and more recent HST studies (e.g., Bézecourt & Soucail 1997) of Abell 2390 () have revealed many giant arcs arising from gravitational lensing of background galaxies by this massive cluster, which has a velocity dispersion of (Carlberg et al. 1996). In particular, an elliptical222Unless otherwise stated, we adopt the natural Vega-based magnitude system, where the conversion to flux density for a source of zeroth magnitude is given for the F555W & F814W HST/WFPC 2 bands by Jy & Jy, and for the near-infrared filters by Jy, Jy & Jy. For reference, the traditional -band has a zeropoint of Jy on this system. close to the critical curve bisects an extended pair of thin, near-straight arcs as shown in Fig. 3. The lensing cluster elliptical is at (galaxy #101190 in Yee et al. 1996), and its coordinates are given in Table 1. The arcs are ‘stretched’ approximately along the major axis of the elliptical, and the geometry relative to the critical curve suggests a ‘cusp’ arc (Pelló et al. 1999). The brighter northern arc () is ″ long, with the southern component () ″ in length.
An arclet redshift survey by Bézecourt & Soucail (1997) detected a single emission line at 6137 Å from the northern component (their arclet #20). Subsequent Keck/LRIS spectroscopy by FB98 determined the redshift of this arc to be on the basis of several rest-frame UV interstellar absorption features (e.g., C II 1335 Å, Si IV 1394, 1403 Å – see also § 3.2), consistent with the emission line of Bézecourt & Soucail being Ly-. In fact, Ly- was seen in absorption rather than emission in the northern arc by FB98 in their discovery spectrum; the spectroscopic slit ran perpendicular to the axis of the arcs, intercepting only % of the northern one. As we show in § 3.3, the Ly- emission is concentrated over a small portion of the arcs. The southern arc and one counter-arc have also been confirmed to be at this redshift, with Ly- in emission (FB98). Our own spatially-resolved Keck/LRIS spectroscopy (§ 3) reproduces the line emission from both the northern and southern arcs. The similarity in colors (, objects 4 & 5 in Pelló et al. 1991) and their positions relative to the caustic suggest that these arcs are lensed images of the same source (see § 3.5).
To undertake a comprehensive spatially-resolved study of this system of arcs, we have used archival HST imaging in the optical (§ 2.1) and long-slit spectroscopy with Keck/LRIS (§ 3) to supplement our near-infrared Keck/NIRC images, which will be described in § 4. Throughout, we have corrected for foreground Galactic extinction using the recent COBE/DIRBE & IRAS/ISSA dust maps of Schlegel, Finkbeiner & Davis (1998) which have an optical reddening of , equivalent to extinctions of , , & .
2.1. WFPC2 Observations
We have re-reduced archival HST imaging of the Abell 2390 cluster from the program of Fort et al. (GO-5352) taken with the Wide Field/Planetary Camera #2 (WFPC 2; Trauger et al. 1994). The imaging was undertaken on 1994 December 10 UT in the F555W and F814W filters, approximating the ground-based and bandpasses. The data comprised four orbits in F555W and five in F814W, with each orbit consisting of a single integration of s, taken at a telescope PA of . The telescope was offset by an integer number of pixels between orbits – which unfortunately meant that ‘drizzling’ (Hook & Fruchter 1997) or other methods for recovering some of the WF undersampling were ineffective for this dataset. The data-quality files were used to create masks of unreliable pixels. When the frames were registered, these pixels were excluded from the average. The offsets were determined from the centroid of the star 7″ from the lensing elliptical (Table 1). Cosmic rays were rejected using the crreject algorithm in IRAF.IMCOMBINE; a clipping at the level was found to be satisfactory.
For the image in each WFPC 2 filter we generated isophotal models of the elliptical using the STSDAS.ISOPHOTE package, returning parameters PA , and – equivalent to kpc at . We then subtracted this model from each image (Fig. 6). As noted by FB98, two smaller arclets close to the elliptical center are revealed, located on the radial line from the elliptical to the cluster center. One of these smaller arcs has been spectroscopically confirmed to be at the redshift of the two main arcs (Frye et al. 1997).
For the combined F555W image (8400 s), the limiting magnitude reached in 1 □″ was mag arcsec-2, and for the composite F814W frame ( s), it was mag arcsec-2. This is consistent with the predicted sensitivity based on the Poissonian counting statistics and the WF readout noise (). The arcs appear in the WF3 chip, and are clearly resolved along their length. Careful comparison of transverse cross-cuts of these arcs with the star 7″ from the elliptical reveals that the arcs are marginally resolved in their width (Fig. 4). The transverse extent of the arcs is (FWHM), and the WF point spread function (PSF) has FWHM , so the width (in the absence of any tangential shear) would be kpc ( kpc) after deconvolution with the PSF. For this WFPC 2 imaging, the limiting magnitudes are and using a circular aperture of diameter to maximize the signal-to-noise ratio for the characteristic width of the arcs.
Given that the arcs are marginally resolved in the transverse direction with HST, a naïve model of a spherical source of diameter 03, linearly stretched into the observed arcs 3–5″ in length implies an average magnification of 10–17, where is the integrated flux amplification (in this instance equal to the linear stretch); to first order, the radial (de)magnification with respect to the cluster center will be small compared to the tangential stretching, although the shear stretching produced by the elliptical galaxy is a significant second-order effect. Although the magnification may not be constant along the length of the arcs (as we assume in this simple model), we expect the magnification to be smoothly varying as the images are some way from the caustic. This estimate of the magnification is comparable to the value of obtained from the lens model of FB98, who also show that the cluster potential is softer than isothermal333In a recent paper, Pelló et al. (1999) use a different lens model, yielding lower magnifications equivalent to and for the northern and southern arcs (H3a & H3b in their notation). This lower magnification is compatible with the observed morphology if the source is significantly elongated and its major axis is serendipitously near-coincident with the direction of linear stretch. In addition to these ‘cusp’ arcs, Pelló et al. also report the discovery of a ‘fold’ arc (H5) which is located 30″ away on the critical curve, but lies outside the region surveyed in our infrared imaging.. However, the existence of sub-structure (the prominent knots N1–N4 and S1–S3 in the northern and southern arcs, Fig. 3) indicates that the source object has greater complexity. As both main arcs are significantly extended in the tangential direction, spatially-resolved spectroscopy along the arcs is possible even with ground-based seeing, and in the next section we describe our follow-up spectroscopy using Keck/LRIS with a long-slit aligned along the axis of the northern and southern arcs.
3. Keck/LRIS Spatially-Resolved Spectroscopy
3.1. LRIS Observations and Data Reduction
We obtained the long-slit spectroscopy on the night of 1997 July 01 UT using the Low Resolution Imaging Spectrograph (LRIS; Oke et al. 1995) at the f/15 Cassegrain focus of the 10-m Keck II Telescope. The LRIS detector is a Tek 20482 CCD with 24 µm pixels, although the CCD was windowed-down spatially to just the 900 pixels illuminated by the 3′ by 1″ long-slit. The angular scale is 0212 pixel-1, and we read out the CCD in two-amplifier mode. The observations were obtained using the 600 line mm-1 grating in first order blazed at 7500 Å, producing a dispersion of 1.256 Å pixel-1. The reference arc lamps and sky-lines have FWHM 3.5–5 pixels (the spectral focus being best at the central wavelength), so for objects that fill the 1″-wide slit, the velocity width of a spectrally unresolved line is FWHM km s-1. The grating was tilted to sample the wavelength range Å, corresponding to Å at . The long-slit observations were taken with a PA of east of north, to cover as much of both arcs as possible (Fig. 6). An offset of , from a nearby star (Fig. 3, with coordinates in Table 1) was performed to center the arcs in the slit. A total of 3600 s of on-source integration was obtained, and this was broken into two individual exposures each of duration 1800 s to enable more effective cosmic ray rejection. The telescope was dithered by 216 along the slit between integrations to aid in the removal of fringing in the red and the elimination of bad pixels. The observations spanned an airmass range of 1.00–1.02. The seeing had a FWHM = 06–11 over the course of the night. Spectrophotometric standard stars HZ 44 & Feige 110 (Massey et al. 1988; Massey & Gronwall 1990) were observed at similar airmass to determine the sensitivity function, although the night was rendered intermittently non-photometric by thin cirrus.
Each frame first had the bias subtracted (determined from the overscan region appropriate to that amplifier), and was converted to electrons through multiplication by the gain (1.97 for the left amplifier, 2.1 for the right). A high signal-to-noise dark current frame (formed by averaging many dark current exposures) was then subtracted. Contemporaneous flat fields were obtained with a halogen lamp immediately after the science exposures, and these internal flats were normalized through division by the extracted lamp spectrum. Wavelength calibration was obtained from NeAr reference arc lamps, and a fourth-order polynomial fit to the centroids of 40 arc lines created a wavelength solution with rms residuals of 0.07 Å. A small ( Å) wavelength zeropoint correction was applied to the dispersion scale to compensate for drift in the grating angle between the arc spectra and the data frames; this was determined by measurement of the centroids of prominent sky lines. Sky subtraction was performed by fitting a fifth-order polynomial to each detector column (parallel to the slit), excluding from the fit those regions occupied by sources.
3.2. Spectral Continuum Features and Redshift of the Lensed Arcs
The two-dimensional spectrum shows continuum, spatially distinct from the light profile of the lensing elliptical. This extended continuum coincides with the areas occupied by the arcs in the WFPC 2 imaging (Fig. 3). The continua from the arcs have several absorption features, and a spectral slope fairly flat in longward of Å at – Fig. 5 shows the one-dimensional spectral extractions. Both the northern and southern arcs exhibit the same absorption features (see Table 2), which are consistent with O I 1302.2 Å / Si II 1304.4 Å, Si IV 1393.8,1402.8 Å, Si II 1526.7 Å and Fe II 1611.2 Å at . Other rest-UV absorption lines commonly observed in starbursts (such as C IV 1548.2,1550.8 Å) lie close to prominent sky lines in the OH forest. We note that most of these absorption line wavelengths do not match any common spectral feature at the redshift of the lensing galaxy (), and so the continuum detection from the region of the arcs cannot be extended light from the foreground elliptical. In the continuum of the arcs, there are also two prominent absorption features at 6450 Å (as noted in FB98) and at 6210 Å, which are attributable to foreground absorbers. The absorption profiles appear to be more consistent with the C IV 1548.2,1550.8 Å absorption doublet at & than with lower- Mg II 2795.5,2802.7 Å systems.
3.3. Spatially-Offset Line Emission Associated with the Arcs
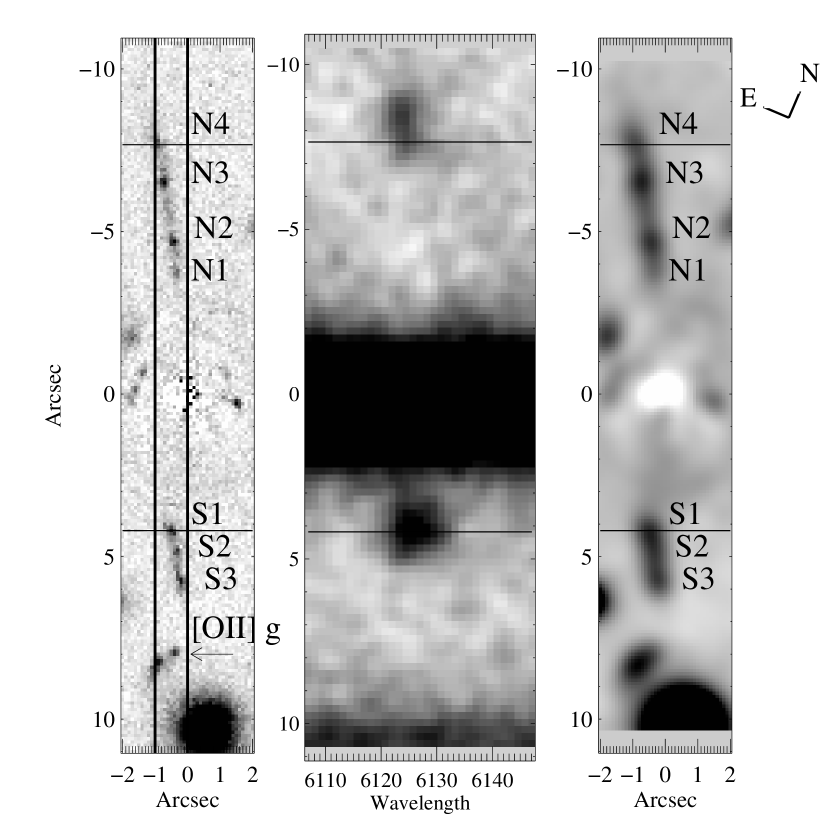
Fig. 6 shows the area of the WFPC 2 image intercepted by the long-slit, displayed alongside the two-dimensional spectrogram (trimmed to the spectral region around Ly- at ). Our optical spectroscopy reveals two sites of prominent line emission, detected at high signal-to-noise (). However, as is readily apparent from Fig. 6, only one of the four bright knots of the northern arc (labeled N4 in Fig. 3) has a prominent nearby emission line, and similarly only S1 in the southern component is close to a region of line emission. However, neither of these knots detected in continuum in the WFPC 2 images is coincident with the centroids of the emission lines seen in the long-slit spectroscopy, which lie to the north of the continuum in both cases (Table 1). The centroid of the northern line emission is from the center of the elliptical (resolved along the spectroscopic slit axis of PA ), but the centroid of the nearest continuum knot, N4, is from the elliptical in the WFPC 2 images, with the northern extreme of the continuum extending beyond. Hence the spatial offset between the continuum and the center of the northern line emission is larger than the size of the PSFs and much greater than the uncertainty in centroiding. With its smaller magnification, this spatial incoherence is less pronounced in the southern arc: the Ly- emission is from the center of the elliptical, but the centroid of the nearest continuum knot (S1) is further from the elliptical ().
The spatially-offset line emission near S1 has a central wavelength of Å, with the error dominated by the pixel (1.256 Å) uncertainty in centering the emission line in the slit. The wavelength is consistent with Ly- 1215.7 Å at , within 400 km s-1 of the absorption-line redshift for the continuum. We first consider and reject the unlikely scenario where the line emission is not Ly- arising from the object responsible for the continuum of the arcs, but instead is a physically distinct source. Not only would this have to be a chance projected alignment (to within in the source plane), but also by coincidence the physically-distinct source would have to have a redshift such that its solitary emission line had a wavelength mimicking Ly- at the redshift of the arcs to within . As any line at a shorter rest-frame wavelength than 1216 Å would be effectively extinguished by the Ly- forest absorption, an object at would be required. This source would have to be extremely unusual in being capable of producing an isolated emission line with huge equivalent width: no continuum is detected at the location of the line emission. The 3 lower limit on the equivalent width is Å in the observer’s frame, derived from the noise in the F555W image within a aperture centered at the location of the line emission. This line emission is extremely unlikely to be H 4861.3 Å at as we do not detect H 6562.8 Å which would be times as strong (assuming case B recombination). Similarly, [O III] 5006.8 Å at is ruled out: coincidentally, this redshift is close to that of the lensing elliptical, but the absence of the second line in the [O III] doublet makes this interpretation untenable – [O III] 4958.9 Å is one third as strong (Osterbrock 1989), well above our detection threshold. The only other remotely plausible interpretation for the line emission is [O II] 3726.1,3728.9 Å at ; however, our spectrogram extends out to H & [O III] for this redshift, which are not observed. Even if the absence of these lines was on account of anomalous line ratios, we would still expect to marginally resolve the [O II] doublet (although any velocity smoothing greater than about 250 km s-1 will wash out the splitting). Indeed, our spectroscopic long-slit did serendipitously intercept a line-emission galaxy at (indicated in Fig. 6) 3″ below the southern arc (Table 1), which clearly exhibits the characteristic doublet profile of [O II], with the redshift confirmed by [Ne III] 3868.7 Å (Fig. 7). We do not see this doublet profile in the line emission adjacent to the arcs. Hence we conclude that Ly- emission, associated with the continuum from the arcs, is by far the most probable identification of the line. This interpretation also has the advantage that there exists a nearby source of UV photons (in the adjacent star-forming knots, N4 & S1) with which to generate the Ly- recombination line; in § 5.5 we describe a model for the transport of these photons from the star-forming regions to the areas observed in line emission.
3.4. Spectral Profile of the Ly- Emission
The Ly- line is clearly resolved, with a measured spectral width of 7.8 pixels FWHM for the S1 knot, which was centered on the slit. This is equivalent to a velocity width of after deconvolution with the instrumental width – really a lower limit as the source did not quite fill the 1″-wide slit in the sub-arcsec seeing. The profile is asymmetric, with a pronounced red wing but a sharper decline in flux density on the blue side (Fig. 8). This appears to be a common feature in high- starbursts with Ly- in emission (e.g., Dey et al. 1998; Lowenthal et al. 1997), and is most likely due to an outflow of neutral hydrogen, where we only see the back-scattered Ly- from the far side of the expanding nebula – only the photons on the red side of the resonant Ly- emission-line profile can escape, with the blue wing being absorbed by neutral gas (mainly within the galaxy). This also accounts for the difference in redshift between that determined from the Ly- emission (the profile of which has been skewed to the red) and the redshift measurement from the absorption features (which may be more representative of the systemic redshift, although large-scale outflows in the ISM may result in a relative blueshift of these absorption lines). A spectral extraction encompassing the continuum and line emission regions shows that there is Ly- absorption blueward of the emission line (Fig. 8). The P Cygni-like profile is consistent with this outflow model. Recent near-IR spectroscopy by Pettini et al. (1998) of the rest-frame optical forbidden lines and Balmer lines in galaxies also shows a redshifting of the Ly- relative to the nebular emission lines.
The velocity dispersion of inferred from the line-width of Ly- is likely to be a lower limit, as the line profile is truncated. However, the velocity width of Ly- is unlikely to be representative of the velocity dispersion of the galaxy, as resonant scattering will broaden the spectral profile of the escaping photons (e.g., Binette et al. 1993). Spatially, the two regions of Ly- emission are resolved along the slit (the major axis of the arcs) and extend over 1–2″ FWHM. The flux in the line from S1 is (N4 falls on the edge of the slit and is presumably subject to significant slit losses). This is equivalent to a line luminosity of ergs s-1 ( ergs s-1), which in the absence of extinction of this line corresponds to a star formation rate444We convert the line flux to a star formation rate using the Bruzual & Charlot (1993) spectral evolutionary models, as updated in GISSEL 1996 (Charlot, Worthey & Bressan, 1996) with a Salpeter (1955) IMF of mass range . From this, a constant star formation rate of will produce of Lyman continuum photons ( Å). Assuming case B recombination, 69% of these Lyman continuum photons will be reprocessed as Ly- (Spitzer 1978, table 1). The number of Lyman continuum photons per unit star formation rate is a factor of higher (so the inferred SFR a factor of lower) than that obtained from the Kennicutt (1983) IMF. of (). This recombination line emission could be generated by the unobscured UV flux of about () O7-stars.
Careful inspection of the spectrum did not reveal any emission lines at other wavelengths, either in the region of the continuum or in the areas occupied by the offset Ly- emission. Table 3 gives the upper limits on the flux in high-ionization rest-UV lines falling within our spectral coverage, comparing with the typical line ratios from composite AGN spectra of QSOs (Osterbrock 1989), radio galaxies (Stern et al. 1999) and Seyfert IIs (Ferland & Osterbrock 1986). The non-detections of N V 1240 Å, C IV 1549 Å & He II 1640 Å strongly favor the interpretation that the Ly- arises from the Lyman continuum flux produced by OB stars, rather than the harder UV spectrum of an AGN.
3.5. Lens Geometry
It is likely that the northern and southern arcs are images of the same source, and the lens geometry suggests these have even parity (FB98). The locations where there is distinct Ly- emission (at the northern-most tip of each arc) corroborate this. A further test comes from the Ly- line centroids measured in our high-dispersion optical spectroscopy; if the interpretation of these arcs as lensed images of the same source is correct then we would expect the central wavelength of Ly- to be identical; alternatively, two associated galaxies at the same redshift would presumably exhibit a velocity difference of if gravitationally bound. In fact, our slit PA was such that although S1 was centered on the slit, N4 was off-center by 2 pixels (Fig. 6) – the arcs are not exactly co-linear, so a compromise slit position was used to encompass as much of both arcs as possible. Allowing for this spatial offset of 04, the line centroids of the Ly- from N4 & S1 are identical to within our measurement error () as illustrated in Fig. 9. The relative photometry of both arcs from the deepest WFPC 2 F814W image (Table 4) suggests that the ratio of the magnification of the northern arc to the southern is 1.6:1 (). This is consistent with the relative lengths of the arcs (5″ : 3″). Unfortunately, the proximity of the northern-most portion of the northern arc to the edge of the spectroscopic long-slit (Fig. 6) implies that the northern Ly- emission-line region is probably subject to large slit losses, so we cannot use the measured line flux ratio between north and south as a further independent check on the relative magnification.
4. A Near-Infrared Study
4.1. Observations with Keck/NIRC
For our near-infrared imaging, we used the Near-Infrared Camera (NIRC; Matthews & Soifer 1994) at the f/25 forward Cassegrain port of the 10-m W.M. Keck I Telescope. NIRC is a 2562 InSb array with an angular scale of pixel-1. The observations were undertaken on 1997 August 25 UT in photometric conditions. Although the seeing in the near-infrared was throughout the night, an intermittent drift in the telescope focus rendered the PSF of some frames significantly worse.
A concern with using broad-band magnitudes to infer the continuum levels is possible contamination by emission lines (e.g., Eales & Rawlings 1993). We used the filter (m), which at the redshift of the target galaxy lies red-ward of the 4000 Å break, but avoids any possible contamination from the H 4861.3 Å recombination line at m, unlike the usual -band which has a longer-wavelength cut-off. The -band is also a good approximation to the rest-frame -band.
We observed Abell 2390 in both ( s) and ( s), centering the field on the elliptical galaxy lensing the arcs. The sky background was mag arcsec-2 and mag arcsec-2. The high background in any near-infrared observations necessitates short individual exposures to avoid saturation of the detector wells. We adopted exposure times of s () and s (), co-adding such reads before writing out each data frame. Hence, for each frame we have an integration of s () and s (). Between frames we offset the telescope, dithering in a pattern of step size 8″. This produces an incoherent sequence of disregistered frames, ensuring that each pixel samples genuine sky frequently. There were 38 independent pointings in and 24 in . The NIRC field of view was oriented at position angle east of north in order to avoid dithering the arcs onto brighter objects while retaining a suitable star in the fixed offset guider.
Photometric calibration was achieved through observations of the UKIRT Faint Standards FS3, FS27, FS29 & FS32 (Casali & Hawarden 1992) over a range of airmasses, from which we determined the extinction coefficients ( mag airmass-1 and mag airmass-1 for the - and -bands, respectively). The magnitudes can be transformed to the standard filter by using a color term derived from the standard star photometry:
4.2. Data Reduction
The near-infrared data reduction involved the removal of two principal components: an additive term and a multiplicative term. The additive term is comprised of the bias level and dark current of the detector, the background contributed by the sky, and the thermal signature of the telescope. The multiplicative term is the flat-field, dependent on the intrinsic gain variations of the detector pixels modulated by the illumination of the array.
As NIRC does not offer a correlated double-sampling readout mode, we formed our own ‘super-bias’ frames with the same readout pattern as the science data, medianing many bias frames to reduce the readout noise. However, as the bias frames were taken some time away from our observations of the arcs, they were not appropriate for all pixels, particularly ‘warm’ pixels with variable dark current. Those pixels exhibiting large variability from frame-to-frame were subsequently identified and masked. However, other pixels had a time-dependent dark current which varied on much longer timescales, and could still be used with a background subtraction determined from the adjacent frames taken closest in time.
Following dark/bias subtraction, the frames were flat-fielded to remove the pixel-to-pixel variation in detector gain. We experimented with several flat-fielding techniques. Use of the median of the disregistered data stack to remove objects in the field, although producing frames which are cosmetically flat, does not provide a good representation of the true flat field. This is because it contains both the sky background (which is likely to be flat on the ′ field of the detector), and the thermal emission of the telescope and instrument, which will not be constant across the field of view and is very significant in the thermal-infrared -band. Hence, this approach cannot yield a frame that is photometrically flat (i.e., adopting this technique to flat-field, the photometry of an object will be a function of the position on the array). We also obtained dome-flats, formed by differencing lamp-on and lamp-off images of an illuminated dome spot. By taking the difference, the thermal signature of the telescope and dome spot should be removed, and all that remains is illumination of the array multiplied by the detector flat-field. However, there may be non-uniform illumination of the dome spot, although this will vary smoothly with position on the array as the dome spot is very out of focus. Our third method of flat-fielding involved taking a sequence of dithered twilight sky-flats of equal integration times as the sky intensity varied. We performed regression fits for the intensity of each pixel against the median counts in each frame (the sky level to a first approximation). Outliers more than 3- from the fit were excluded, to eliminate stars and cosmic rays. The slope of the regression line yields the normalized gain for each pixel, and the intercept is the non-flat thermal contribution (more details are given in Bunker 1996). This technique will yield the true flat-field provided the thermal signature is stable on a timescale of minutes – the duration of the twilight sky-flat sequence. These twilight sky-flats, which were ultimately used in the calibration, differed from the dome-flats by a smooth gradient of across the field-of-view of the detector. The robustness of our flat-field was confirmed by standard star photometry at different locations on the array. The dispersion in the recorded calibrated counts was less for the twilight sky flat than either the dome-flat or the median data-flat.
After removing the bias/dark-current and flat-fielding, the images were then background-subtracted. As the background level varied on the timescale of a few tens of minutes, the background for each frame was determined by several of the temporally adjacent images. The DIMSUM package555DIMSUM is the Deep Infrared Mosaicing Software package developed by P. Eisenhardt, M. Dickinson, A. Stanford & J. Ward. was used to create object masks for each individual frame. The ten frames closest in time were then combined, excluding the masked objects, to create a background image appropriate for that particular frame. Each frame had cosmic rays identified through unsharpened masking, which differentiated the hard edges of these events from the softer profile of real objects.
We combined all the background-subtracted, flat-fielded frames, registering them using offsets determined from the centroid of a bright star close to the arcs of interest. Each pixel was rebinned onto a grid, and the data registered at the half-pixel level. All frames were scaled to zero airmass using the extinction term determined from the standard star photometry. Optimal inverse-variance weighting was employed, to maximize the signal-to-noise ratio. Known bad pixels and previously-identified cosmic rays were flagged for each individual frame and excluded from the co-addition. To eliminate other cosmic rays and artifacts which had escaped previous cuts, the two highest and two lowest intensities measured for each registered pixel were ignored, and the inverse-variance weighted average of the other 34 frames (in ) or 20 frames (in ) was taken. In the final mosaics, our sensitivity in a 1□″ aperture is mag arcsec-2 and mag arcsec-2 for the central region where all the images overlap and our noise is lowest. These limits are entirely consistent with Poisson statistics based on the sky background and the readnoise of the detector (). Hence, our detection limit for a point source is and . The PSF in our final combined & images had a FWHM of 05.
4.3. Analysis
As with the WFPC 2 imaging, the surface brightness profile of the lensing galaxy was determined by fitting elliptical isophotes of increasing radii, and this model was subtracted from the final NIRC image in each waveband.
The goal of this work is to map out the spatially-resolved color gradients along the arcs. The coordinate transform from the sub-pixelated ( pixel-1) NIRC mosaics onto the intrinsically higher-resolution WFPC2 images was determined using approximately 40 compact sources common to all frames. The resultant pixel scale is pixel-1. This process, as well as matching the different orientations and pixel scales, also corrects for spatial distortions between the two detectors.
The arcs are essentially linear. We collapse the flux along the short axis of the arcs in the elliptical-subtracted images, summing over a fixed aperture width chosen to maximize the signal-to-noise ratio (S/N). The extracted one-dimensional light profile gives the integrated flux at each point along the major axis of the arcs. This is somewhat akin to the one-dimensional extraction of a two-dimensional spectrum, with the ‘dispersion’ dimension corresponding to the linear distance along the arcs.
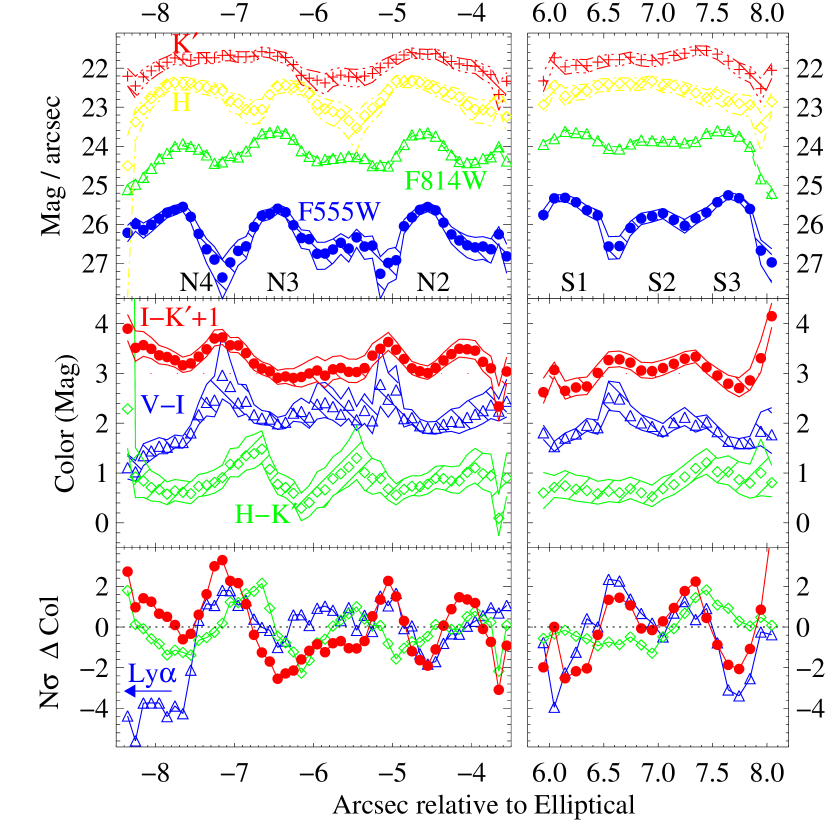
We trained the aperture traces on the F814W image, in which the arcs had the highest S/N. We repeated the photometry on corresponding aperture centers in the other wavebands. For the HST imaging, where the arcs are marginally resolved in the transverse direction (FWHM), our extraction width was 5 pixels (), FWHM, which for a Gaussian profile maximizes the S/N. For the ground-based near-infrared images, the seeing in the final mosaics was and the arcs are unresolved in the transverse direction, so we set our extraction width to be . Fig. 10 shows the intensity of the arcs in each waveband in terms of linear magnitudes, the flux per unit length along the arc. A surface brightness ‘measurement’ would be inappropriate for these linear, unresolved (or barely-resolved) systems.
For each image, our aperture width for the photometry is fixed, with the trace following the centroid of the arcs. We convert our fixed-width aperture magnitudes to total linear magnitudes using aperture corrections for the fraction of the flux estimated to fall beyond our extraction widths. The cross-section of a bright star in our field was block-replicated to emulate the linear nature of the arcs. Analysis of the curve-of-growth of the profile perpendicular to the major axis led us to estimate the aperture corrections to be in the HST images and in the NIRC images for the extraction widths adopted.
To allow a valid comparison between the optical and near-infrared data with their different intrinsic spatial resolutions, we boxcar-smooth the intensity maps by summing the flux in the one-dimensional extraction over the width of the resolution element determined from the lower-resolution ground-based seeing (). Hence, the derived colors (from our linear magnitudes, using fixed-width apertures) are now unaffected by differences in the resolution of the optical and near-infrared imaging. The maps of intensity as a function of distance along the arcs are plotted in Fig. 10.
5. Discussion
5.1. Age and Reddening from Broad-Band Colors
We wish to compare our spatially-resolved optical/near-infrared photometry with stellar spectral synthesis models of various metallicities. We also consider the effects of extinction by dust intrinsic to the source and the absorption by foreground neutral gas (the line and continuum opacity of intervening absorbers). Lensing is achromatic, so the colors are not influenced by the fact that the system is magnified (once the different resolutions of the various images have been accounted for).
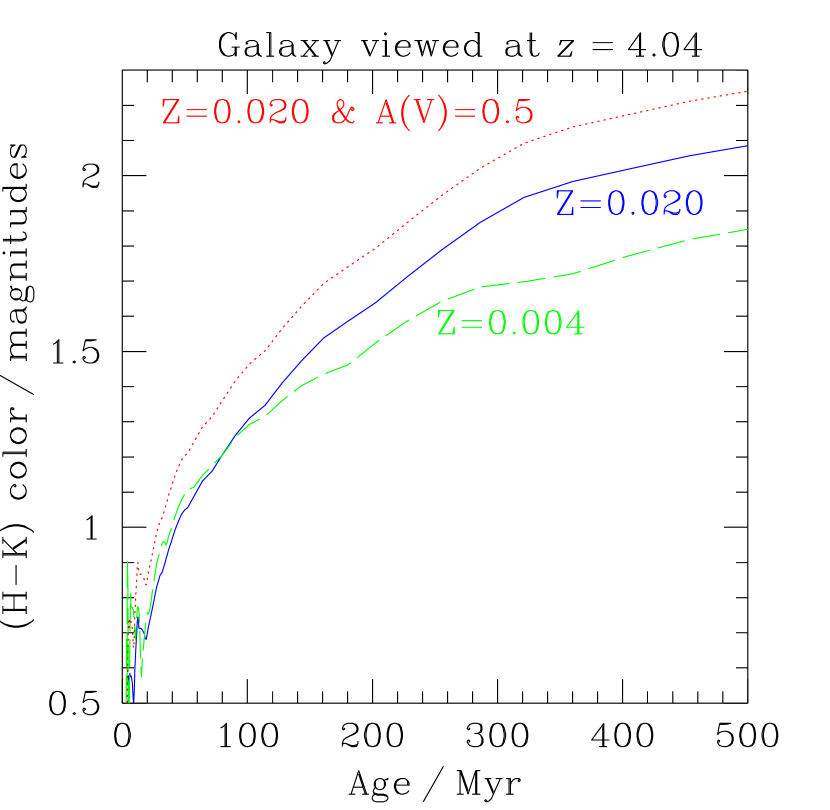
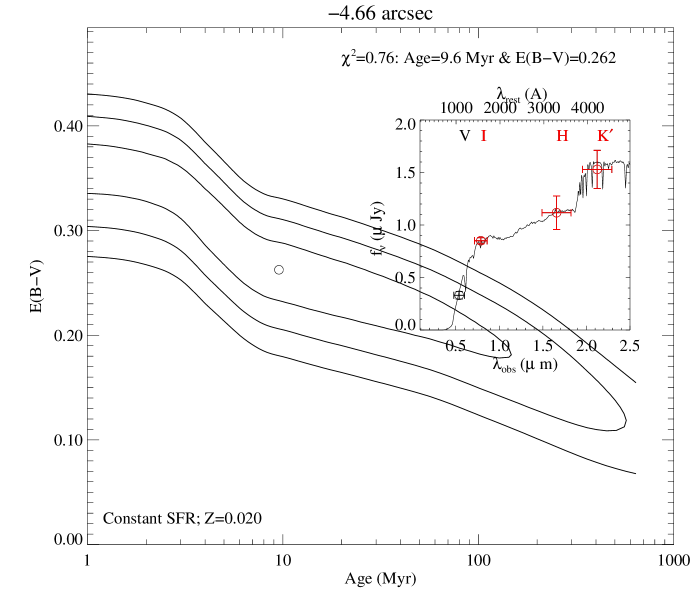
At , the color straddles the 4000 Å Balmer break. The amplitude of the break is affected by the age, the initial mass function, the dust reddening, and the metallicity. It is most sensitive to age (Fig. 2) and relatively insensitive to dust, because of the small rest-wavelength baseline. We can break the age/dust degeneracy to some extent through use of all colors, which span a significant range of wavelengths. However, the age/metallicity degeneracy persists.
Using ages derived from , we can then use the optical/near-infrared colors as an excellent diagnostic of dust absorption. The F814W filter is centered at a rest wavelength of Å, and the pass-band lies longward of Ly-. Hence it is very susceptible to intrinsic reddening by dust, but is immune to the effects of line blanketing by the intervening Ly- forest.
The interpretation of the rest-ultraviolet color is more complicated since the intrinsic stellar SED is extremely sensitive to dust extinction at these short rest-wavelengths. In addition, most of the F555W filter lies shortward of Ly- from the arcs. Hence, the F555W flux may have a line contribution from Ly- (in emission or absorption), and the continuum will be severely depressed by intervening Ly- clouds (Madau 1995).
5.2. Color Gradients Along the Arcs
We detect the arcs in our near-infrared imaging over the entire spatial range observed in the WFPC 2 data. Fig. 10 shows spatially-resolved colors along the tangential extent of both major arcs. There are statistically significant color gradients at the 3–5 level (the lower panels of Fig. 10). For the cases of the prominent knots seen in the WFPC 2 imaging of the rest-ultraviolet, the colors are comparatively blue (relatively flat in below Å), with in the knots. From Fig. 2, this is entirely consistent with an extremely young OB stellar population ( Myr). However, there are significant portions of the interknot regions that are much redder, with colors of between N3 and N4 and between N2 and N3, with a firm lower bound of . From Fig. 2, where ages are plotted against colors for different metallicities, the time elapsed since the last major episode of star formation in the absence of dust is Myr for metallicites of , and Myr for solar metallicity (). This is completely insensitive to upper mass cutoffs greater than , as these massive stars will have left the main sequence.
A color comparison of the two highest S/N bands, the F814W and , shows that the color is anti-correlated with the trace of the F814W flux (Fig. 10). This is to be expected since the F814W ( Å) traces ultraviolet-bright sites of recent star formation, whereas is reddest in the older regions, and/or those with the most extreme dust reddening.
In the northern arc, knots N1–N3 are not adjacent to the sites of Ly- emission. However, the uncontaminated continuum slope of the knots (e.g., between F814W and -band) is relatively flat in (Fig. 10), implying a young stellar population and suggestive of ongoing star formation. Extrapolating this to shortward of Ly-, the continuum depression as inferred from the color may be used to make a direct estimate of , the absorption due to intervening cosmological H I clouds. Outflowing neutral hydrogen intrinsic to the source may also play a significant rôle in absorbing the blue-wing of Ly- (§ 3.4). Formally, the continuum break (Oke & Korycansky 1982) is defined as
| (1) |
(e.g., Schneider, Schmidt & Gunn 1991; Madau 1995); we use our best-fit SEDs (including dust reddening) to predict the F555W flux in the absence of H I absorption. Comparison with the actual F555W flux yields a determination of , after correcting for the fraction of this filter which lies above the redshifted 1216 Å break.
The colors in the vicinity of knot N4, from which there is substantial nearby Ly- emission, are significantly bluer than for knots N1–N3. This difference is consistent with the emission contributing to the F555W flux. With this assumption, we estimate the equivalent width of the Ly- emission at N4 to be Å. However, as noted in § 3.3, the Ly- emission extends further than N4, with much larger equivalent width over these regions ( Å). The globally-averaged equivalent width is only Å (§ 5.5) typical of the Lyman break galaxies.
5.3. Stellar Spectral Synthesis Models
We adopt the spectral evolutionary models of Bruzual & Charlot (1993; hereafter, BC) as updated in GISSEL96 (Charlot, Worthey & Bressan 1996). As noted by many authors (e.g., Spinrad et al. 1997) there are often disparities between different population synthesis models (e.g., Worthey 1994; BC; Guiderdoni & Rocca-Volmerange 1987). However, we are interested in a wavelength régime where such differences between spectral synthesis models are least significant – the rest-optical.
In fitting stellar populations there is a large number of free parameters (age, metallicity, reddening, star formation history, IMF, etc.). As we have only a limited number of independent color indices, we begin by fixing all but the age and the reddening, and explore three variations in metallicity and star formation history.
As with the treatment of Sawicki & Yee (1998) for the HDF star-forming galaxies (Steidel et al. 1996b; Lowenthal et al. 1997), we have constructed grids of BC models with which to fit the observed broad-band colors. We have conservatively adopted the Salpeter (1955) IMF with a large mass range (), compatible with that inferred for local starbursts (Stasinska & Leitherer 1996.)
We consider two metallicities, both solar metal abundance (for comparison with the older BC models; ) and lower metal enrichment (), compatible with the values derived for high-column-density absorption systems at (20% solar; c.f., Pettini et al. 1997a), which are probably sight-lines through galaxies.
The final ingredient in the matrix of models is dust extinction. Longward of Ly- we only consider dust intrinsic to the source (once Galactic extinction has been removed). There has been much debate about what is the most appropriate reddening law for high-redshift galaxies (e.g., Meurer et al. 1997; Dickinson 1998; Pettini et al. 1997b, 1998). We adopt the extinction law of Calzetti (1997a,b), empirically derived from local starburst galaxies, which may therefore be more appropriate to the integrated light of dusty star-forming regions666The empirical reddening law for star-forming regions as determined by Calzetti (1997a,b) is parameterized in terms of the color excess for the stellar continuum of the OB stars. This is related to the color excess of the ionized gas (which would be inferred from nebular line emission observations) by . The differential reddening between gas and stars is due to the fact that the youngest stars (which provide the ionizing flux) are generally dustier than later stars (which contribute to the continuum, but no longer to the ionization of the gas). The wavelength dependence of the reddening is where the flux attenuation for the stellar continuum is given by . Note that the reddening relation, , differs from that for the Galactic law, . than those derived from individual stars, such as the standard LMC, SMC, and Galactic reddening laws. In particular, the foreground dust screen models employed with these extinction laws are likely to be inaccurate as the geometry of the dust and gas in a star forming region will be more complex.
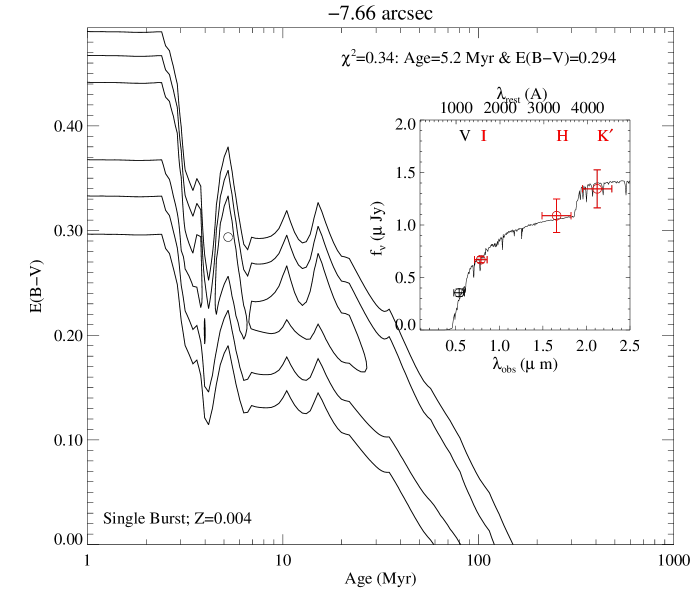
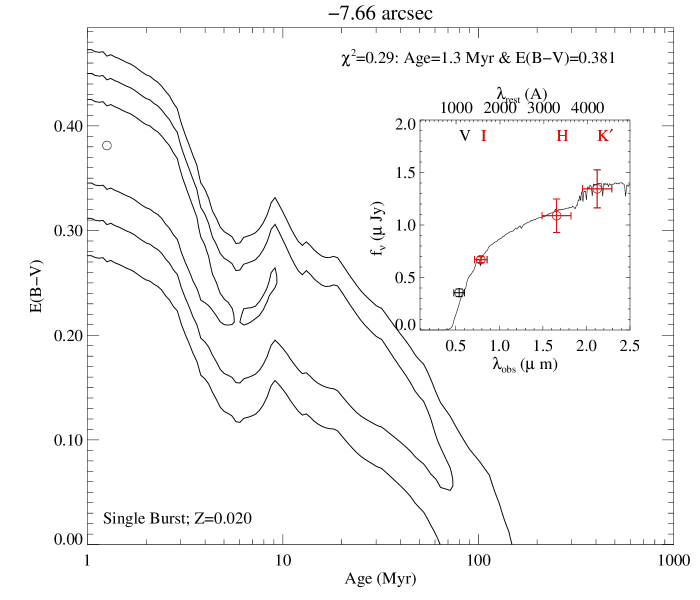
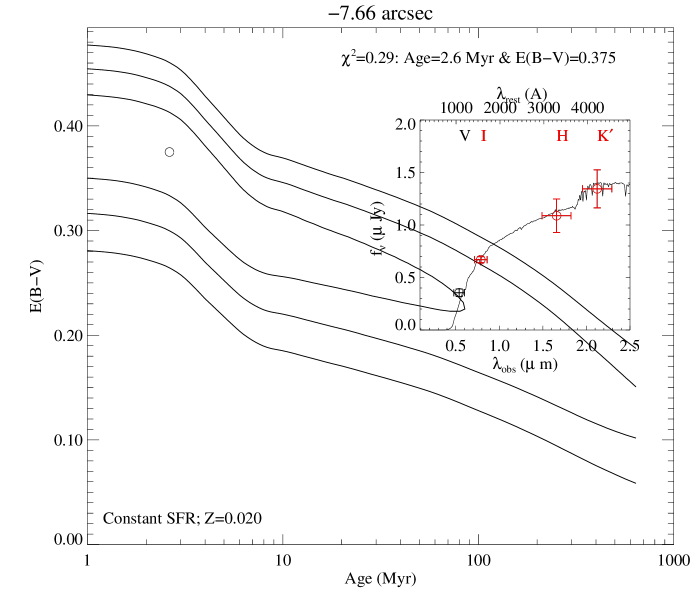
We have assembled a grid of SEDs, varying dust extinction between and in increments of , and using 144 age steps from the BC models (from zero age to 2 Gyr, the upper-limit on the age of the Universe at for ). We then use our photometry for each location along the arcs to perform a maximum-likelihood fit to the SED at that point. In our fit, we exclude the F555W flux as it is prone to both line contamination from Ly- and continuum-suppression below Å. Using the magnitudes measured in the other three wavebands, weighted by the photometric uncertainty, we minimize the absolute to compute the age and reddening for the best-fit model. We have degrees of freedom for fitting a particular model, where is the number of pass-bands used in the fit (). Using our subsequent determination of (§ 5.2), we repeated the analysis using in addition a F555W flux corrected for intervening absorption, but found this did not substantively affect the best-fit SEDs.
We have undertaken this analysis using different star formation histories, and place constraints based on extremes of the Bruzual & Charlot models, from single-event (instantaneous) starburst to a continuous star-formation rate. Although undoubtedly simplified, these models bracket all reasonable star formation histories. Specifically, we focus on three scenarios:
-
•
a metallicity of 20% solar () and an instantaneous burst model;
-
•
solar metallicity () with the burst model;
-
•
and solar metallicity with a constant star formation rate.
5.4. SEDs of Spatially Resolved Stellar Populations
In this sub-section we discuss the fits of model SEDs to the broad-band photometry of several specific locations with extreme colors. We use this to show that non-coeval star formation histories are suggested for this object, and we also place limits on the degree of dust obscuration.
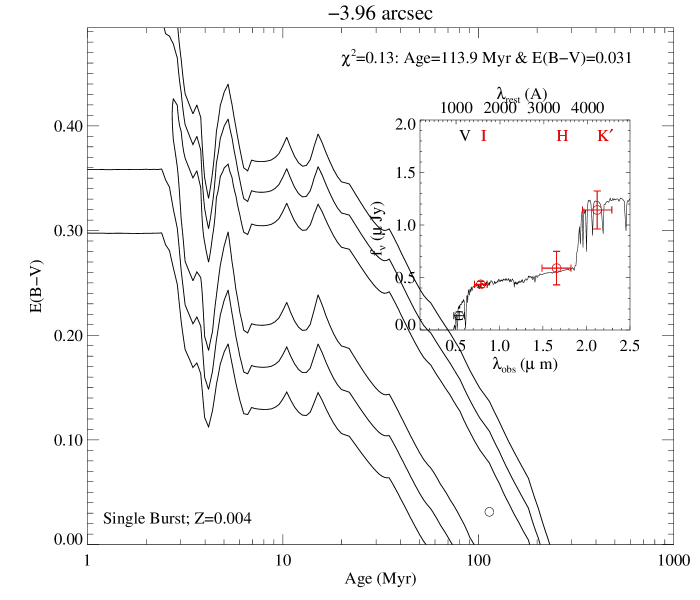
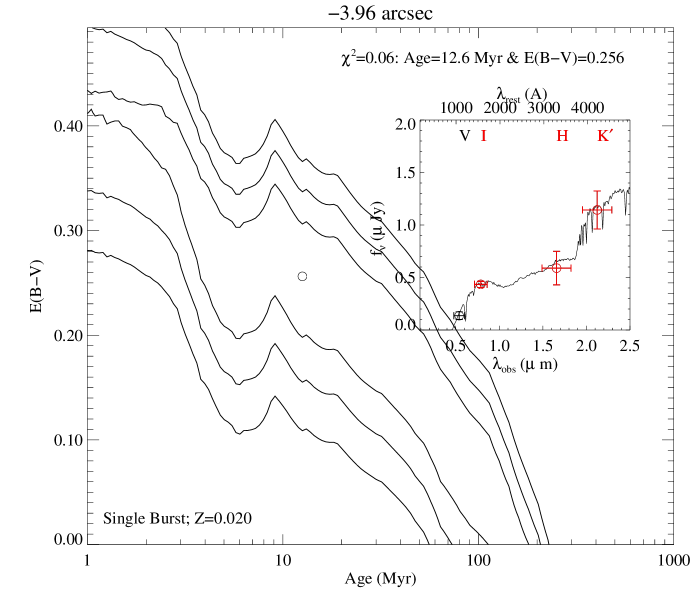
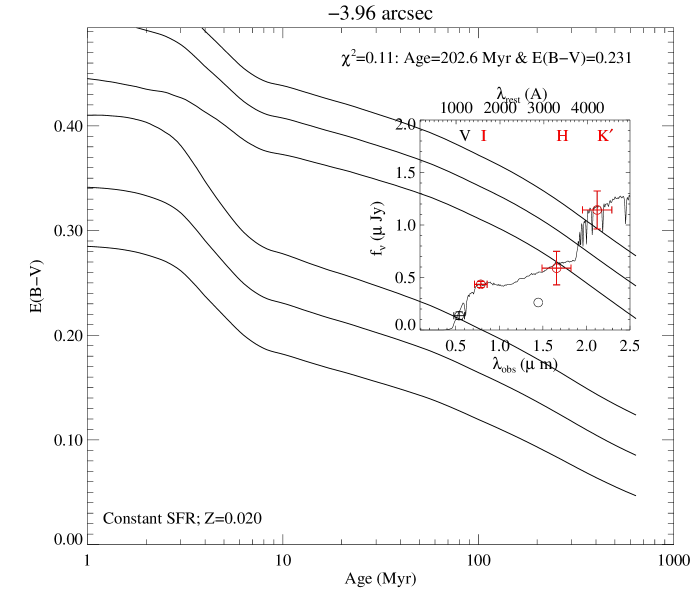
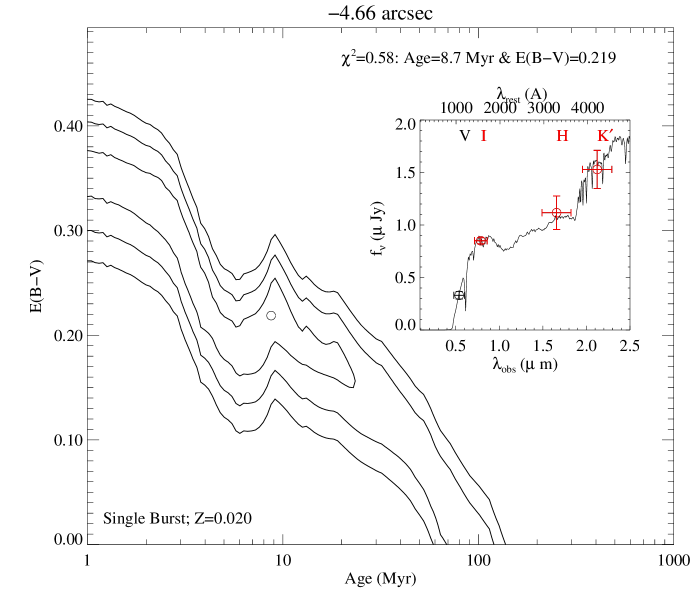
First we consider the reddest interknot regions (e.g., Fig. 11, the interknot region between N1 & N2 at ). Formally, a huge range of parameter space is allowed within the confidence interval for all three models we have considered. The best fit of the single-burst models suggests that the SEDs are dominated by a Myr population, with an extinction of . A constant star formation rate model allows for an enormous range of ages with large extinction due to dust (as much as ). Although this model is statistically as viable as the single-burst ones, a constant star formation rate over more than Myr would yield a detectable far-IR flux, which is not seen by recent ISOCAM observations – the limit at m of Jy per 5″ beam (Altieri et al. 1999; Lémonon et al. 1998) constrains the reddening to be . An even better upper limit on the dust obscuration comes from the SCUBA sub-mm cluster lens survey of Blain et al. (1999). Comparing the star formation rate inferred from the rest-UV continuum (§ 5.6) to the upper-limit on the SFR from the SCUBA non-detection777The flux limit in the 15″ SCUBA beam (encompassing both arcs) at 850 m of mJy constrains the luminosity to be (), following the methodology of Hughes et al. (1998). The total star formation rate must be () and the dust mass () for , K. indicates that the total obscuration of the galaxy at 1600Å (the observed -band) cannot exceed a factor of , so for the Calzetti reddening law.
Independently, Pelló et al. (1999) have performed SED fits to the integrated flux of the arcs, and also conclude that for this system, continuous star formation models are less satisfactory than a burst scenario. For our more favored model (passive evolution after an episode of star formation), the lower limit on the age is Myr at confidence if we assume (for both metallicities), and Myr in the absence of reddening (Fig. 14). There is significant degeneracy in the models between age and dust, but general conclusions can be drawn by the direct comparison of the results for knots and interknot regions within the context of each model grid.
Comparing our grid of models with the highest surface brightness (knot) regions yields systematically younger ages than for the interknots. Clearly, the amplitude of the break between the - and -bands is much smaller in the knots (compare the SEDs of Fig. 12 with Fig. 11), indicating an intrinsically younger dominant stellar population – indeed, the presence of Ly- in the vicinity of knot N4 demands this. As we see Ly- in emission nearby, we know the upper mass cutoff must exceed for there to be sufficient ionizing Lyman-continuum flux, which requires that star formation has occurred within the last 10 Myr. However, in order to fit the rest-UV optical colors with the Calzetti reddening model, a higher extinction is preferred in the star-forming knots than in the older interknot regions. One could attribute this either to uncertainties in the true extinction law or, perhaps more physically, to a dusty environment in these star-forming regions. In the local Universe we know that star formation activity is predominantly confined to molecular clouds with high dust content. Recent sub-mm work on high-redshift star-forming galaxies (Hughes et al. 1998) also suggests a large extinction in the rest-UV, with re-radiation at thermal wavelengths by dust perhaps contributing significantly to the diffuse far-IR background (Schlegel et al. 1998; Hauser et al. 1998). Indeed, just of optical extinction will shift 25% of the rest-frame UV flux into the far-IR888An absolute limit on dust obscuration in the high- Universe is provided by the COBE spectrum of the microwave background, which is a perfect 2.73 K black-body to within 0.3% (Mather et al. 1994). Significant thermal dust emission from high- galaxies would render the spectrum non-Planckian (e.g., Blain & Longair 1993), and Mannucci & Beckwith (1995) show that an average extinction of only would be in conflict with the COBE measurements (for star formation at and a dust temperature of K)..
Study of a prominent knot without Ly- emission (N2) shows that it is still well-fit by a relatively young stellar population (Fig. 13), comparable to that of N4. Indeed, the absence of Ly- emission is not incompatible with an actively star-forming region; based on local starburst work (Kunth et al. 1998) and studies of the Lyman-break population (Steidel et al. 1996a,1999), we know that Ly- emission is absent in about half the sample of ‘normal’ galaxies. This is probably attributable to selective extinction of this resonant line after multiple scatterings (§ 5.5), with the large dispersion in the equivalent widths of Ly- arising from the complex dependence on the geometry of the ISM and the internal kinematics.
As originally demonstrated by Bunker et al. (1998), and recently confirmed by the work of Pelló et al. (1999), the broad-band colors (Table 4) integrated along the entire northern arc (Fig. 14) show that the overall spectrum is best fit by a more evolved ( Myr) population with extinction intrinsic to the source of . This implies that there are older stars outside the actively star-forming H II regions. In some areas, (Fig. 10), indicating that Myr has elapsed since the major episode of star formation (Fig. 2).
It is interesting to note that without the luxury of the spatially-resolved colors, the integrated flux would be most heavily dominated by the luminosity and the colors of the recent starburst regions. This would lead to the erroneous interpretation that the object is a primæval galaxy, observed during its first episode of star formation. This paper shows that this is demonstrably incorrect.
5.5. The Origin of the Line Emission
An unusual aspect is that the Ly- line emission is not coincident with the UV-continuum seen in the HST imaging (§ 3.3). The line emission regions only overlap partially with the northern-most edges of the two arcs, and extend ″ beyond. Therefore, the localized equivalent width for much of the Ly-–bright region is huge, as the continuum is undetected. The local lower-limit on the equivalent width is Å in the observed frame. This corresponds to Å () in the rest-frame at . This lower bound is still consistent with the uppermost-end of the theoretical Ly- equivalent widths from stellar synthesis models of star-forming regions (e.g., Charlot & Fall 1993) for an extremely young stellar population ( Myr) whose UV flux is dominated by O-stars. However, the observed Ly- emission from star-forming galaxies is invariably much weaker when spatially averaged over the entire rest-UV extent of the galaxy. The Ly- emission is typically Å at (e.g., Steidel et al. 1996a; Warren & Møller 1996), or even in absorption. Such large equivalent widths as we see from the emission-line regions of these lensed arcs are observed in AGN, although the absence of strong N V 1240 Å & C IV 1549 Å emission from our spectroscopy (§ 3.4) and the lack of X-ray emission999The arcs lie outside the minimum X-ray contour in the 28 ks ROSAT/HRI image of Pierre et al. (1996). The detection threshold within a 5″ aperture (matched to the ROSAT PSF) is , adopting the conversion of for keV, (H I) and a spectral shape (where ). For a magnification of , the X-ray limit constrains the source as being on the QSO luminosity function of Boyle et al. (1993), where for , determined from QSOs out to . argue against the hard UV spectrum of an active nucleus. The velocity width of Ly- is also significantly narrower than seen in the broad-line regions of AGN, even after correcting for the self-absorbed blue wing (§ 3.4).
We hypothesize that the observed line emission is actually powered by the neighboring H II regions. Lyman continuum photons are generated in the star-forming knot, N4 (and its corresponding southern image, S1), consistent with the spectral energy distribution (SED) fits detailed in § 5.4. Either these Lyman continuum photons escape along sight-lines relatively free of gas and dust, or (perhaps more likely) these ionizing photons would be reprocessed by H I as Ly-, with their escape paths greatly lengthened through resonant scattering. Only those Ly- photons which random-walk to chemically unenriched regions (i.e., areas where star formation has yet to occur) will escape quenching by dust. This may favor the diffusion of Ly- photons northward of N4 & S1, away from the body of the galaxy. Clouds of neutral hydrogen surrounding the galaxy could then act as external ‘mirrors’ for the Ly- and any Lyman continuum photons leaking from the galaxy, and it is from these regions that we observe the line emission; if the scattering mechanism is primarily H I, then the cross-section of the Ly- photons is times greater than for the UV continuum, explaining why scattered continuum is not detected. Similar effects have been reported in radio galaxies (e.g., Villar-Martín, Binette & Fosbury 1996) and damped Ly- systems (Møller & Warren 1998).
To be more quantitative about this model, we consider the efficiency of creation and transport of the Lyman continuum photons necessary to power the observed Ly- recombination line. We consider the southern Ly- emission, as its measured flux is less likely to be subject to spectroscopic slit losses than the northern region. The adjacent star-forming continuum knot, S1, has a magnitude of , which is a luminosity density of (). In the absence of extinction of the line, This would correspond to a star formation rate101010The relation between the flux density in the rest-UV around Å and the star formation rate ( in ) is given by from Madau, Pozzetti & Dickinson (1998) for our adopted Salpeter (1955) IMF with (§ 5.3). This is comparable to the relation derived from the models of Leitherer & Heckman (1995). However, if the Scalo (1986) IMF is used, the inferred star formation rates are a factor of three higher for a similar mass-range. of (), and a production rate of Lyman-continuum photons of (). However, assuming case B recombination, the observed Ly- line flux (§ 3.4) requires only 40% of these Lyman continuum photons from S1. This could be provided by an unobscured light cone centered at S1, directed towards the Ly- H I cloud, with an opening angle in the source plane, which is only in the image plane. This light cone would not be directed towards us, otherwise we would see Ly- emission coincident with the UV continuum. Of course, if ionizing photons or resonantly-scattered Ly- from the other (further) regions of continuum emission also reach the H I cloud where the Ly- emission is observed, then the efficiency can be even lower – the total efficiency in the generation of Ly- from the UV continuum of the entire southern arc (, Table 4) need only be 9%. This is comparable to a recent estimates by Bland-Hawthorn & Maloney (1999) and Dove, Shull & Ferrara (1999) of the fraction of Lyman-continuum photons from OB associations escaping the H I disk of the Milky Way. Dove et al. argue that the H II regions are density bounded in the vertical direction (perpendicular to the disk), and it is the escape of these photons through dynamic chimneys and superbubbles which keeps the diffuse, ionized medium (the Reynolds layer) ionized to scale heights of kpc. It is conceivable that similar mechanisms are at work in the galaxy.
Using the spatially-integrated flux in the F814W filter extrapolated to the continuum just above Ly- (the F555W filter is subject to Ly- forest blanketing over much of its bandpass, § 5.1) implies that the globally-averaged equivalent width of the Ly- emission is only 50 Å in the observed frame. This value of Å is typical of the Lyman break galaxy population at high redshift (e.g., Steidel et al. 1996a).
We now consider the transport of the photons. The radiation must travel ″ beyond the continuum-emission regions of the galaxy before being scattered by H I as Ly- into our line-of-sight. However, this distance is along the direction of magnification for these linearly-stretched arcs, so the physical separation is not large on account of this amplification – kpc ( kpc). We note that without the luxury of this magnification, with ground-based resolution we would not be able to resolve the spatially-distinct continuum and line-emission regions – it would look like a normal Lyman-break star forming galaxy, with a typical Ly- emission line equivalent width (integrated over the entire galaxy). Even with HST, the sub-kpc spatial separation between the line- and continuum-emission would be at the very limit of the WF resolution (01) if the galaxy were not lensed.
5.6. Intrinsic Properties of the Lensed Galaxy
It has been suggested that there is a limiting surface brightness of star-forming regions, equivalent to a luminosity surface density of (Meurer et al. 1997). We consider the knot N4 in the northern lensed arc, which is mostly likely the site of star formation responsible for the Ly- emission. We measure the area occupied by the UV continuum of this young knot, rather than the area of the Ly- emission, which is probably scattered significantly (§ 5.5). After deconvolution with the WFPC 2 point spread function, the solid angle subtended by the star-forming knot N4 is 0.05 arcsec2 (out to the half-light radius), corresponding to () for (), and its magnitude is , equivalent to () or (), where (Allen 1973). The mean surface brightness is therefore , within the limiting value suggested by Meurer et al. (1997) but significantly less than that derived for the star-forming knot in the lensed arc G1 () behind CL1358+62 (; Franx et al. 1997). Our result is independent of the actual magnification, as the sources are resolved and surface brightness is conserved, and is also independent of cosmology – surface brightness is subject only to dimming.
Although undoubtedly simplified, lens models (§ 2.1; FB98; Pelló et al. 1999) can be used to recover the intrinsic properties of the source galaxy. The inaccuracies in such models are likely to be factors no more than a few, comparable to the uncertainties due to the cosmology. With the estimated linear magnification of , the physical scale-length of the lensed galaxy is kpc ( kpc), a fairly compact half-light radius similar to that seen in high-resolution HST imaging of the Lyman break population (Giavalisco, Steidel & Macchetto 1996). The knots N4 & S1 associated with the Ly- emission occupies 10% of the arcs, hence we infer a size for the H II regions of pc ( pc), comparable to that observed for star-forming H II regions in the local Universe such as the starburst knots A & B in NGC 1741 (Conti, Leitherer & Vacca 1995). The dynamical crossing time for such regions is likely to be less than Myr, so an episode of star formation with comparable duration (cohesive over these timescales) is not unphysical. The total luminosity density of the star-forming knots N1–N4 is about (). This is equivalent to about () O7-stars. The total star formation rate inferred from the continuum around Å is yr-1 ( yr-1), adopting the conversion from Madau, Pozzetti & Dickinson (1998). This SFR estimate from the continuum is more reliable and significantly higher than the value derived from the total Ly- line flux (§ 3.4), implying that globally this line is selectively extinguished through resonant scattering by a factor of relative to the UV continuum (§ 5.5).
Introducing a dust correction to the rest-ultraviolet luminosity significantly increases the estimated star-formation rate. From § 5.4 we infer an intrinsic extinction of () which corresponds to an attenuation in the rest-ultraviolet of a factor of three at 1600 Å. Hence, we estimate the true star formation rate of this stellar system to be yr-1 ( yr-1), which will take Gyr ( Gyr) to assemble an galaxy with a mass of in stars, a timescale equivalent to the Hubble time at and a significant fraction of the Hubble time at . Alternatively, it is likely that we are witnessing the formation of a sub- unit, which will in time merge with other such units to gradually assemble a more massive galaxy – the four bright knots may even be a multiple nucleus arising from a merger event. Indeed, Pelló et al. (1999) report the discovery of the lensed image of another galaxy in this field at the same redshift (but physically distinct) 30″ away. This is a projected distance of only kpc ( kpc) in the source plane, which would be crossed in Gyr at 100 km s-1. Hence, these two galaxies may have merged by the current epoch.
The absolute magnitude in the rest-ultraviolet (based on the -band) is (), which places it at around on the luminosity function determined by Dickinson (1998) for the population of -band drop-out galaxies, which have a characteristic absolute rest-UV magnitude of (, with no dust correction). Recent results from Lyman break galaxies show an minimal evolution in the luminosity function from to (Steidel et al. 1999). From the rest -band (our image), the absolute magnitude is (), which translates to a luminosity of (). For , this comparable to from surveys of the local Universe (e.g., from the APM; Loveday et al. 1992). For , the -band luminosity of the lensed galaxy would be slightly above the local , perhaps . This almost certainly reflects the young age of this galaxy, rather than a massive system with a mass in stars exceeding that of an galaxy at .
6. Conclusions
This paper has described a multi-waveband study of a galaxy. Combining archival HST/WFPC 2 imaging with deep near-infrared data taken with Keck/NIRC in good seeing, we have measured the spatially-resolved colors along a pair of arcs, gravitationally lensed by the rich cluster Abell 2390. Comparison of the optical and near-IR photometry with a suite of spectral evolutionary models has enabled us to map spatially the underlying stellar populations and differential dust extinction. Optical spectroscopy has shown that there are regions with Ly- in emission, and that these are adjacent to some of the bright knots seen in the optical HST images which sample the rest-frame UV. We have shown that the line emission is likely to be powered by star formation in these knots, rather than by an active nucleus. We see the Ly- line morphology extending significantly beyond the UV continuum, which we attribute to resonant scattering from H I. In the bright knots, the SEDs are consistent with a very young stellar population ( Myr) or ongoing star formation. However, our near-IR imaging reveals significantly redder portions between the prominent knots, and we have shown that for these locations along the arcs, the most probable SEDs are those viewed Myr after an episode of star formation, with modest dust extinction of . There is degeneracy in the models between dust reddening and age for the optical/near-infrared colors, but the most extreme scenario where the color gradients are solely due to heavy dust reddening of an extremely young stellar population are strongly ruled out by upper limits in the far-infrared/sub-mm from ISO/SCUBA. It is therefore unlikely that this system in a true ‘primæval’ galaxy, viewed during its first major burst of star formation. Rather, our results suggest that the star formation history of this system has not been coeval, with current activity concentrated into small pockets within a larger, older structure. The evidence suggests at least two stages of star formation events are underway. This is not a monolithic collapse at – the galaxy must have begun forming at . Taken in the context of the recent renaissance in the study of normal galaxies at high redshift, our results further erode the paradigm of a single “formation epoch” (see also Zepf 1997).
Using the amplification estimated from lens models, we have shown that the intrinsic properties of the galaxy are comparable to the Lyman-break selected population of Steidel et al. (1996a,1999). The current extinction-corrected star formation rate may be adequate to ‘build’ an galaxy over a Hubble time, but a more likely scenario may be the creation of a sub-unit which will undergo subsequent merging with nearby systems (such as the other galaxy identified by Pelló et al. 1999) to assemble hierarchically the massive galaxies of today.
References
- (1) Allen, C. W. 1973, “Astrophysical Quantities”, 3rd ed. (Athlone, London)
- (2) Altieri, B., Metcalf, L., Kneib, J.-P., et al. 1999, A&A, L343, 65
- (3) Bézecourt, J., & Soucail, G. 1997, A&A, 317, 661
- (4) Binette, L., Wang, J. C. L., Zuo, L., & Magris C., G. 1993, AJ, 105, 797
- (5) Blain, A. W., & Longair, M. S. 1993, MNRAS, 265, 21P
- (6) Blain, A. W., Kneib, J.-P., Ivison, R. I., & Smail, I. 1999, ApJ, 512, 87
- (7) Bland-Hawthorn, J., & Maloney, P. R. 1999, ApJ, 510, 33
- (8) Boyle, B., Griffiths, R. E., Shanks, T., Stewart, G. C., & Georgantopoulos, I. 1993, MNRAS, 260, 49
- (9) Bruzual A., G., & Charlot, S. 1993, ApJ, 405, 538 (BC)
- (10) Bunker, A. J. 1996, D. Phil. Thesis, University of Oxford, http://astro.berkeley.edu/~bunker/thesis.html
- (11) Bunker, A. J., Moustakas, L. A., Davis, M., Frye, B. L., Broadhurst, T. J., & Spinrad, H. 1998, in “The Young Universe: Galaxy Formation and Evolution at Intermediate and High Redshift”, eds. D’Odorico, S., Fontana, A., & Giallongo, E., ASP Conf. Ser. Vol. 146, p182, astro-ph/9802150
- (12) Carlberg, R. G., Yee, H. C., Ellingson, E., Abraham, R., Gravel, P., Morris, S., & Pritchet, C. J. 1996, ApJ, 462, 32
- (13) Calzetti, D. 1997a, AJ, 113, 162
- (14) Calzetti, D. 1997b, in “The Ultraviolet Universe at Low and High Redshift”, eds. Waller, W. H., Faneli, M. N., Hollis, J. E., & Danks, A. C. AIP Press, Vol. 408, p403, astro-ph/9706121
- (15) Casali, M. M., & Hawarden, T. G. JCMT-UKIRT Newsletter, No. 3, August 1992, p33
- (16) Charlot, S., & Fall, S. M. 1993, ApJ, 415, 580
- (17) Charlot, S., Worthey, G., & Bressan, A. 1996, ApJ, 457, 625 (GISSEL96)
- (18) Conti, P. S., Leitherer, C., & Vacca, W. D. 1995, ApJ, 461, 87
- (19) Dey, A., Spinrad, H., Stern, D., Graham, J. R., & Chaffee, F. H. 1998, ApJ, 498, 93
- (20) Dickinson, M. E. 1998, in “The Hubble Deep Field”, eds. Livio, M., Fall, S. M., Madau, P. STScI Symposium Series, p219, astro-ph/9802064
- (21) Dove, J. B., Shull, M., & Ferrara, A. 1999, ApJ, in press, astro-ph/9903331
- (22) Dunlop, J., Peacock, J., Spinrad, H., Dey, A., Jimenez, R., Stern, D., & Windhorst, R. 1996, Nature, 381, 581
- (23) Eales, S. A., & Rawlings, S. 1993, ApJ, 411, 67
- (24) Ferland, G. J., & Osterbrock, D. E. 1986, ApJ, 300, 658
- (25) Franx, M., Illingworth, G. D., Kelson, D. D., Van Dokkum, P. G., & Tran, K.-V. 1997, ApJ, 486, 75
- (26) Frye, B. L., & Broadhurst, T. J. 1998, ApJ, 499, 115 (FB98)
- (27) Frye, B. L., & Broadhurst, T. J., Spinrad, H., & Bunker, A. 1998, in “The Young Universe: Galaxy Formation and Evolution at Intermediate and High Redshift”, eds. D’Odorico, S., Fontana, A., & Giallongo, E., ASP Conf. Ser. Vol. 146, p505, astro-ph/9803066
- (28) Giavalisco, M., Steidel, C. C., & Macchetto, F. D. 1996, ApJ, 470, 189
- (29) Guiderdoni, B., & Rocca-Volmerange, B. 1987, A&A, 186, 1
- (30) Hauser, M. G., Arendt, R.G., Kelsall, T., et al. 1998, ApJ, 508, 25
- (31) Hook, R. N., & Fruchter, A. S. 1997, in “Astronomical Data Analysis Software and Systems VI”, eds. Hunt, G., & Payne, H. E., ASP Conf. Ser. Vol. 125, p147
- (32) Hughes, D., Serjeant, S., Dunlop, J., et al. 1998, Nature, 394, 241
- (33) Kassiola, A., Kovner, I., & Blandford, R. D. 1992, ApJ. 396, 10
- (34) Kennicutt, R. C. 1983, ApJ, 272, 54
- (35) Kunth, D., Mas-Hesse. J. M., Terlevich, E., Terlevich, R., Lequeux, J., & Fall, S. M. 1998, A&A, 334, 11
- (36) Leitherer, C., & Heckman, T. M. 1995, ApJS, 96, 9
- (37) Lémonon, L., Pierre, M., Cesarsky, C. J., Elbaz, D., Pelló, R., Soucail, G., & Vigroux, L. 1998, A&A, 334, 21L
- (38) Loveday, J., Peterson, B. A., Efstathiou, G., & Maddox, S. J. 1992, MNRAS, 390, 338
- (39) Lowenthal, J. D., Koo, D. C., Guzmán, R., Gallego, J., Phillips, A. C., Faber, S. M., Vogt, N. P., Illingworth, G. D., & Gronwall, C. 1997, ApJ, 481, 673
- (40) Madau, P. 1995, ApJ, 441, 18
- (41) Madau, P., Pozzetti, L., & Dickinson, M. 1998, ApJ, 498, 106
- (42) Mannucci, F., & Beckwith, S. V. W. 1995, ApJ, 442, 569
- (43) Massey, P., Strobel, K., Barnes, J. V. & Anderson, E. 1988, ApJ, 328, 315
- (44) Massey, P., & Gronwall, C. 1990, ApJ, 358, 344
- (45) Mather, J. C., Cheng, E. S., Cottingham, R. E., et al. 1994, ApJ, 420, 439
- (46) Matthews, K., & Soifer, B. T. 1994, in “Infrared Astronomy with Arrays: the Next Generation”, ed. McLean, I., Dordrecht: Kluwer Academic Publishers, p239
- (47) Meurer, G. R., Heckman, T. M., Lehnert, M. D., Leitherer, C., & Lowenthal, J. 1997, AJ, 114, 54
- (48) Møller, P., & Warren, S. J. 1998, MNRAS, 299, 661
- (49) O’Connell, R. W. 1997, in “The Ultraviolet Universe at Low and High Redshift”, eds. Waller, W. H., Faneli, M. N., Hollis, J. E., & Danks, A. C. AIP Press, Vol. 408, p11
- (50) Oke, J. B., & Korycansky, D. G. 1982, ApJ, 255, 11
- (51) Oke, J.B. & Gunn, J. 1983, ApJ, 266, 713
- (52) Oke, J.B., Cohen, J.G., Carr, M., Cromer, J., Dingizian, A., Harris, F. H., Labrecque, S., Lucinio, R., Schall, W., Epps H., & Miller, J. 1995, PASP, 107, 375
- (53) Osterbrock, D. E. 1989, “Astrophysics of Gaseous Nebulæ and Active Galactic Nuclei”, University Science Books
- (54) Pelló, R., Kneib, J.-P., Le Borgne, J.-F., et al. 1999, A&A, 346, 359
- (55) Pelló, R., Le Borgne, J.-F., Soucail, G., Mellier, Y., & Sanahuja, B. 1991, ApJ, 366, 405
- (56) Pettini, M., Smith, L. J., King, D. L., & Hunstead, R. W. 1997a, ApJ, 486, 665
- (57) Pettini, M., Steidel, C. C., Dickinson, M., Kellogg, M., Giavalisco, M., & Adelberger, K. L. 1997b, in “The Ultraviolet Universe at Low and High Redshift”, eds. Waller, W. H., Faneli, M. N., Hollis, J. E., & Danks, A. C. AIP Press, Vol. 408, p279, astro-ph/9707200
- (58) Pettini, M., Kellogg, M., Steidel, C. C., Dickinson, M., Adelberger, K. L., & Giavalisco, M. 1998, ApJ, 508, 539
- (59) Pierre, M., Le Borgne, J.-F., Soucail, G., & Kneib, J.-P. 1996, A&A, 311, 413
- (60) Salpeter, E. E. 1955, ApJ, 121, 161
- (61) Scalo, J. M. 1986, Fund. Cosmic Phys., 11, 1
- (62) Sawicki, M., & Yee, H. K. C. 1998, AJ, 115, 1329
- (63) Schlegel, D. J., Finkbeiner, D. P., & Davis, M. 1998, ApJ, 500, 525
- (64) Schneider, D. P., Schmidt, M., & Gunn, J. E. 1991, AJ, 101, 2004
- (65) Squires, G., Kaiser, N., Fahlman, G., Babul, A., & Woods, D. 1996, ApJ, 469, 73
- (66) Spinrad, H., Dey, A., & Graham, J. R. 1995, ApJ, 438, 51
- (67) Spinrad, H., Dey, A., Stern, D., Dunlop, J., Peacock, J., Jimenez, R., & Windhorst, R. 1997, ApJ, 484, 581
- (68) Spinrad, H., Stern, D., Bunker, A., et al. 1998, AJ, 116, 2617
- (69) Spitzer, L. 1978, “Physical Processes in the Interstellar Medium”, Wiley
- (70) Stasinska, G., & Leitherer, C. 1996, ApJS, 107, 661
- (71) Steidel, C. C., Giavalisco, M., Pettini, M., Dickinson, M. E., & Adelberger, K. L. 1996a, ApJ, 462, 17
- (72) Steidel, C. C., Giavalisco, M., Dickinson, M. E., & Adelberger, K. L. 1996b, AJ, 112, 352
- (73) Steidel, C. C., Adelberger, K. L., Giavalisco, M., Dickinson, M. E., & Pettini, M. 1999, ApJ, 519, 1
- (74) Stern, D., Dey, A., Spinrad, H., Maxfield, L., Dickinson, M., Schlegel, D., & González, R. A. 1999, AJ, 117, 1122
- (75) Trager, S. C., Faber, S. M., Dressler, A., Oemler, A., Jr. 1997, ApJ, 485, 92
- (76) Trauger, J. T., Ballester, G. E., Burrows, C. J., et al. 1994, ApJ, 435, 3
- (77) Villar-Martín, M., Binette, L., & Fosbury, R. A. E. 1996, A&A, 312, 751
- (78) Warren, S. J., & Møller, P. 1996, A&A, 311, 25
- (79) Worthey, G. 1994, ApJS, 95, 107
- (80) Yee, H. K. C., Ellingson, E., Abraham, R. G., Gravel, P., Carlberg, R. G., Smecker-Hane, T. A., Schade, D., & Rigler, M. 1996, ApJS, 102, 289
- (81) Zepf, S. E. 1997, Nature, 390, 377
- (82)
| object | ||
|---|---|---|
| lensing elliptical | ||
| offset star | ||
| N1 | ||
| N2 | ||
| N3 | ||
| N4 | ||
| Ly- (N)11Affected by a nearby sky emission features. | ||
| Ly- (S)22From the composite broad-line region AGN spectrum in Osterbrock (1989). | ||
| S1 | ||
| S2 | ||
| S3 | ||
| O II 3727 Å emission galaxy33This galaxy has two components visible in the WFPC 2 imaging; the component closest to the slit center is given; the other lies 04 east, 05 south. | ||
| straight arc A | ||
| straight arc B | ||
| straight arc C |
| / Å | ID, / Å | redshift / |
|---|---|---|
| 6133.9 | Ly-(em) 1215.67 | 4.0457 |
| 6122.1 | Ly-(abs) 1215.67 | 4.0360 |
| 6352.6 | Si II 1260.4 | 4.0417 |
| 6551.9 | O I 1302.2 | 4.0314 |
| 6563.4 | Si II 1304.4 | 4.0317 |
| 6721.011Affected by a nearby sky emission features. | C II 1334.5 | 4.0363 |
| 6730.611Affected by a nearby sky emission features. | C II 1335.7 | 4.0390 |
| 7024.7 | Si IV 1393.8 | 4.0400 |
| 7069.2 | Si IV 1402.8 | 4.0393 |
| 7694.0 | Si II 1526.7 | 4.0396 |
| 7805.611Affected by a nearby sky emission features. | C IV 1548.2 | 4.0417 |
| 7819.211Affected by a nearby sky emission features. | C IV 1550.8 | 4.0420 |
| 8109.611Affected by a nearby sky emission features. | Fe II 1608.5 | 4.0417 |
| 8126.4 | Fe II 1611.2 | 4.0437 |
| Emission line | Rest-frame | Line flux11These are upper limits in a 1□″ 7 Å aperture. | Ly- flux ratio11These are upper limits in a 1□″ 7 Å aperture. | QSO ratio22From the composite broad-line region AGN spectrum in Osterbrock (1989). | HzRG | Seyfert II |
|---|---|---|---|---|---|---|
| Å | (Ly-)/(line) | (Ly-)/(line) | ratio44From Ferland & Osterbrock (1986). | ratio55C IV lies in the OH forest sky emission so the limit is less stringent. | ||
| Ly- | 1215.7 | 37 | 1.0 | 1.0 | 1.0 | 1.0 |
| N V | 1238.8,1242.8 | 1.8 () | 20 () | 4.0 | 9.7 | — |
| C IV | 1548.2,1550.8 | 5.055C IV lies in the OH forest sky emission so the limit is less stringent. () | 7.455C IV lies in the OH forest sky emission so the limit is less stringent. () | 2.5 | 3.9 | 4.6 |
| He II | 1640.5 | 1.4 () | 26 () | 20 | 5.5 | 27 |
| Component | F555W | F814W | ||
|---|---|---|---|---|
| northern arc | () | () | () | () |
| southern arc | () | () | () | () |


Appendix A Appendix A: The “straight arc”
Our near-infrared imaging covers the nearby “straight arc” (Pelló et al. 1991), which has generated much interest given the challenge to lens models in reproducing this geometry (e.g., Kassiola, Kovner & Blandford 1992). However, our and images indicate that the “straight arc” is in fact a serendipitous alignment of two or three significantly less straight components (Fig. 1). The photometry of these components is detailed in Table 5. Although the colors of A & B are similar, C differs significantly – it is redder by a magnitude in – adding weight to the interpretation that these are physically distinct objects. Indeed, spectroscopy by FB98 indicates that the two components have different redshifts ( & ).
| Component | ||||
|---|---|---|---|---|
| A | 19.23 | 1.67 | 0.67 | 0.59 |
| B | 19.06 | 1.79 | 0.78 | 0.55 |
| C | 18.00 | 2.77 | 1.72 | 0.92 |