NICMOS images of JVAS/CLASS gravitational lens systems
Abstract
We present Hubble Space Telescope (HST) infrared images of four gravitational lens systems from the JVAS/CLASS gravitational lens survey and compare the new infrared HST pictures with previously published WFPC2 HST optical images and radio maps. Apart from the wealth of information that we get from the flux ratios and accurate positions and separations of the components of the lens systems that we can use as inputs for better constraints on the lens models we are able to discriminate between reddening and optical/radio microlensing as the possible cause of differences observed in the flux ratios of the components across the three wavelength bands. Substantial reddening has been known to be present in the lens system B1600+434 and has been further confirmed by the present infrared data. In the two systems B0712+472 and B1030+074 microlensing has been pinpointed down as the main cause of the flux ratio discrepancy both in the optical/infrared and in the radio, the radio possibly caused by the substructure revealed in the lensing galaxies. In B0218+357 however the results are still not conclusive. If we are actually seeing the two “true” components of the lens system then the flux ratio differences are attributed to a combination of microlensing and reddening or alternatively due to some variability in at least one of the images. Otherwise the second “true” component of B0218+357 maybe completely absorbed by a molecular cloud and the anomalous flux density ratios and large difference in separation between the optical/infrared and radio that we see can be explained by emission from either a foreground object or from part of the lensing galaxy.
keywords:
gravitational lensing - galaxies: active - galaxies: individual: B0218+357 - galaxies: individual: B0712+472 - galaxies: individual: B1030+074 - galaxies: individual: B1600+4341 Introduction
Gravitational lens systems are important for a number of reasons. Individual lenses can be studied to determine a mass and information about the mass distribution of the lensing galaxy or cluster. Moreover, detailed studies of the lensing galaxies give clues to galaxy type and galaxy evolution (Keeton, Kochanek & Falco 1998). If the lensed object is variable, measurement of time delays between variations of the multiple images, together with a good mass model of the lensing object, allow one to estimate the Hubble constant (Kundić et al. 1997; Schechter et al. 1997; Keeton & Kochanek 1997; Biggs et al. 1998). Statistical properties of lenses are also important. Both and can be constrained by lens statistics, a good example being the recent limit of for flat cosmologies (Kochanek 1996). For all these reasons, studies of larger samples of gravitational lenses are important.
The Jodrell Bank VLA Astrometric Survey (JVAS) and Cosmic Lens All Sky Survey (CLASS) (Myers et al. 1998), in which 10,000 sources have so far been observed with the VLA, is the most systematic radio survey so far undertaken. It aims to look at all flat-spectrum radio sources in the northern sky with flux densities 30mJy at 5 GHz. Flat-spectrum radio sources are useful in this context for two main reasons; they have intrinsically simple radio structures, making the effects of lensing easy to recognise, and they are variable, allowing time delays to be derived. The ease of recognition means that this survey is statistically very clean and should not be subject to any significant selection biases – important in view of the results to be outlined below.
Here we present Hubble Space Telescope (HST) infrared imaging of four of the JVAS/CLASS lens sample. The main aim of this work is to obtain better constraints on the lensed images, in particular their flux ratios and their positions relative to the lensing galaxy. Saha & Williams (1997) describe the importance of the use of the improved image positions and ratio of time delays between different pairs of images as a rigid constraint in the modelling of lenses especially when there is a limited number of observational constraints. They note however, that lately it has become apparent (Witt & Mao 1997) that in the case of quadruple-lens systems even well-determined image positions are not enough for accurate modelling, and thus they use non-parametric models.
A second scope of the work is to compare the flux ratios of the components of the lens systems in the different wavebands (optical/near-infrared/radio). Variability of the source spectrum in connection with the time delay can lead to different flux ratios in different spectral bands. Another possibility is microlensing in at least one image. The stellar mass objects can magnify only sufficiently compact sources so if the flux ratios in two spectral bands in two or more images of a multiply-imaged QSO are different, this can be a sign of microlensing. For example, in the gravitational lens system 0957+561, one suspects microlensing effects from the different flux ratios in the optical continuum light, broad-line flux and in the compact radio component. A third possibility is differential magnification, where parts of the source are more magnified than others. This can occur if the scale on which the magnification varies in the source plane is comparable with the size of the emitting regions; so the effect can be different for radiation of different wavelengths. The most spectacular effects of microlensing occur when the angular radius of the source is much smaller than that of the Einstein ring for the microlens (Refsdal & Stabell 1997) but the effect has not been considered much up to now because of the long time scales that this occurs. However, the time scale is no more important when comparing the flux ratios of the different images in multiply lensed quasars.
Mao & Schneider (1998) have suggested also that as in the case of microlensing for optical fluxes, substructure in the lensing galaxy can distort the radio flux ratios and this can be another cause of difference in the flux density ratios at different wavebands.
Differential reddening can be an alternative explanation of differences observed in the flux density ratios of the lensed images at different wavebands. In gravitational lens systems, especially those where the images are seen through the lens, significant reddening by dust in the lens provides a natural explanation that must be considered first. There is considerable evidence for dust reddening during passage through the lensing galaxy (Larkin et al. 1994, Lawrence, Cohen & Oke 1995; Jackson et al. 1998). Infrared pictures are less subject to censorship by dust, generally giving the best view of the lensed images, and enable the degree of extinction to be quantified by comparison of brightnesses between images at different wavelengths. Another advantage of infrared observations is that the contrast between host galaxy starlight and AGN continuum is less than in the optical. Thus, for not very luminous lens objects, we can expect to see arcs or rings formed by the extended host galaxy starlight. The lens system B1938+666 (King et al. 1998) is a particularly spectacular example of this phenomenon. Our aim is also to study the colours and light distributions of the lensing galaxies themselves. Keeton, Kochanek & Falco (1998) discuss measurements of optical HST data on a number of the lensing galaxies, including B0218+357, B0712+472 and B1600+434, and use optical observations and lens modelling to address the question of dark matter distributions. Jackson et al. (1998) have published preliminary H-band photometry of the JVAS/CLASS sample and show that all the lens systems discovered so far have lensing galaxies of normal mass-to-light ratios and that there is no evidence for dark galaxies in this sample.
In section 2 we give details the HST observations. Section 3 contains brief descriptions and discussion of each individual object, and section 4 contains the conclusions.
2 Observations
All observations presented here were obtained with the Near Infrared Camera/Multi-Object Spectrometer (NICMOS) on the HST. Observations were taken with Camera 1, which has a pixel scale of 43 mas, and taken through the F160W filter, which has a response approximately that of the standard H-band. A list of observations, with exposure times and date of observations, is given in Table 1. Fits using the jmfit program in AIPS to the point spread functions generated by the TinyTim program (Krist 1997) yield full widths at half maximum (FWHM) of 131 mas for the NICMOS observations. The complementary Wide Field & Planetary Camera 2 data presented in the Figures have FWHM of 65 mas and 79 mas for 555-nm and 814-nm images respectively.
| Object | Obs date | Time | Observation number |
|---|---|---|---|
| B0218+357 | 970817 | L | N44501KYM |
| S | N44501KZM | ||
| L | N44501L7M | ||
| S | N44501L8M | ||
| L | N44501LKM | ||
| S | N44051LLM | ||
| B0712+472 | 970824 | L | N44503GAQ |
| S | N44503GBQ | ||
| L | N44503GKQ | ||
| S | N44503GLQ | ||
| B1030+074 | 971122 | L | N44504VWQ |
| S | N44504VXQ | ||
| B1600+434 | 970721 | L | N44505DYM |
| S | N44505DZM |
The data were processed by the standard NICMOS calibration pipeline at STScI. Multiple exposures were combined by weighted averaging or medianing depending on whether we had two or more images available. Bad pixels and cosmic rays were rejected by using a rejection algorithm. The images are first scaled by statistics of the image pixels, here the ”exposure” for intensity scaling. The rejection algorithm used is the “crreject” which rejects pixels above the average and works even with two images. The algorithm is appropriate for rejecting cosmic ray events.
As a second check we also added the images with binary image arithmetic within IRAF and divided the images by a number that is appropriate according to the exposures of the images and the number of the images involved so as to preserve the same counts/sec number as the initial NICMOS images. Cosmetically the result of both methods was the same.
A point spread function (PSF) was generated by the TinyTim programme (Krist 1997) and deconvolved from the images using the allstar software, available within the NOAO IRAF package. In cases where the point sources lie on top of extended emission, such as B0712+472, the PSF deconvolution was done by hand, shifting and scaling until the smoothest residual map was obtained. Photometry and errors are based on the quantity of PSF subtracted and the range of PSF subtraction which gives a smooth residual map. In Fig. 1-4 we show the raw images and the images with the point-sources subtracted.
3 Results and discussion
| Survey | Name | # images | zl | zs | lens galaxy | |
|---|---|---|---|---|---|---|
| JVAS | B0218+357 | 2 ring | 0.334 | 0.6847 | 0.96 | spiral |
| CLASS | B0712+472 | 4 | 1.27 | 0.406 | 1.34 | spiral |
| JVAS | B1030+074 | 2 | 1.56 | 0.599 | 1.535 | spiral |
| CLASS | B1600+434 | 2 | 1.39 | 0.414 | 1.589 | spiral |
| Object | Image | Flux density | Flux density | Flux density | Offset from A image | |||
|---|---|---|---|---|---|---|---|---|
| (555 nm) | (814 nm) | (1.6 m) | 555 nm | 814 nm | 1.6 m | Radio | ||
| 10-20W m-2nm-1 | (RA,,err) / mas | |||||||
| B0218+357 | A | 2.00.5 | 2.00.5 | 121 | - | - | - | - |
| B | 131 | 192 | 191 | 281,128,10 | 285,126,10 | 293,124,5 | 307,130 | |
| GAL | 62 | 132 | 152 | * | * | * | - | |
| B0712+472 | A | 1.020.10 | 0.870.09 | 0.980.15 | - | - | - | - |
| B | 0.330.03 | 0.330.03 | 0.410.06 | 66,151,10 | 64,149,10 | * | 57,160 | |
| C | 0.400.04 | 0.380.04 | 0.410.06 | 812,659,5 | 812,660,5 | 804,642,10 | 812,667 | |
| D | 0.02* | 0.02* | 0.220.05 | * | * | 1180,480,20 | 1163,460 | |
| GAL | 4.90.5 | 121 | 111 | 814,157,3 | 801,153,3 | 789,168,3 | - | |
| B1030+074 | A | 26.940.10 | 27.370.07 | 47.60.4 | - | - | - | - |
| B | 0.90.2 | 1.170.17 | 1.400.09 | 930,1256,4 | 931,1247,4 | 918,1244,5 | 935,1258 | |
| GAL | 6? | 7.90.7 | 10.80.5 | 882,1155,10 | 878,1143,10 | 864,1162,5 | ||
| B1600+434 | A | 3.90.3 | 2.90.3 | 0.750.1 | - | - | - | - |
| B | 2.00.2 | 2.20.2 | 0.530.1 | 726,1188,3 | 726,1184,3 | 708,1193,10 | 723,1189 | |
| GAL | * | 92 | 4.51 | * | * | * | ||
The general characteristics of all the four lenses can be found in Table 2. Columns 1 and 2 present the name of the survey in which each lens system was discovered and the name of the lens, while in columns 3, 4, 5, 6 and 7, one can find the number of components in the lens system, the image separation in arcsecs (the largest separation in the case of multiple components), the lens redshift, the source redshift and the morphology of the lensing galaxy respectively.
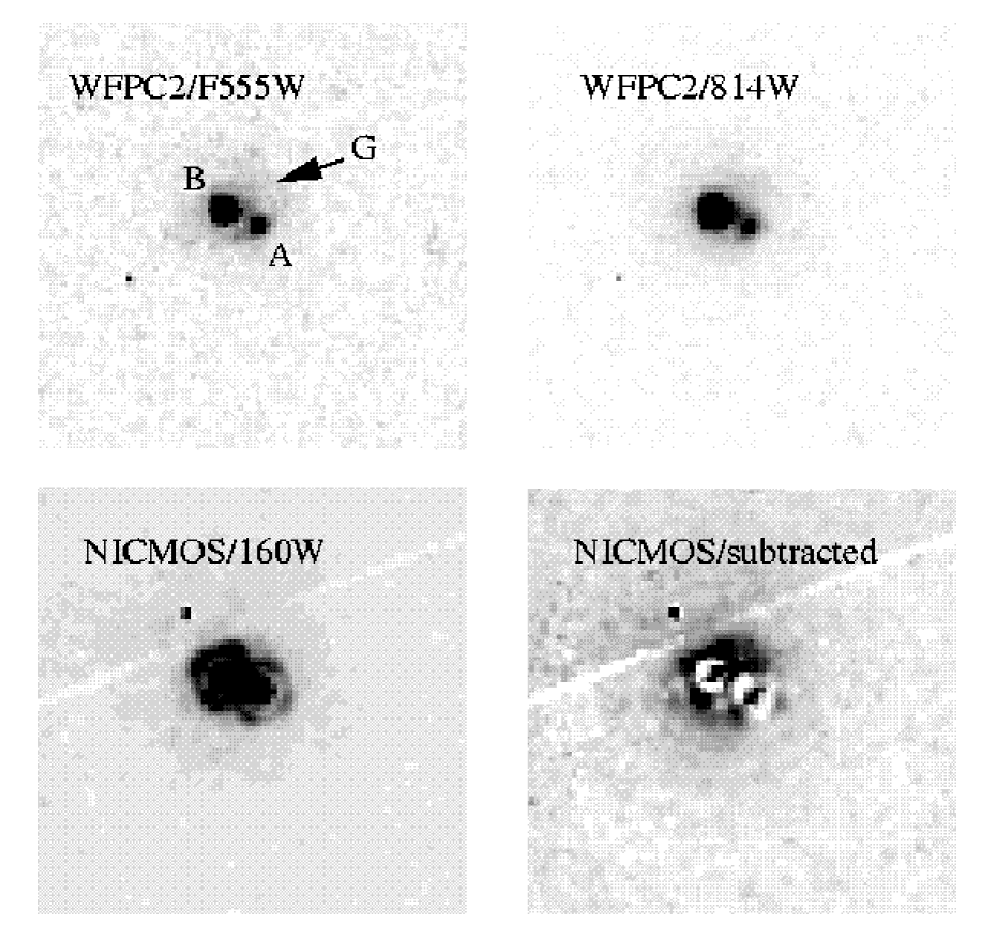
3.1 B0218+357
The B0218+357 system consists of two images of a compact radio source of a redshift 0.96 (Lawrence et al. 1995) separated by 334 mas. In addition to the compact images there is a radio Einstein ring (Patnaik et al. 1993). The lensing galaxy has a redshift of 0.6847 (Browne et al. 1993). It has been detected in V, I and H-bands with the HST (Fig. 1) and, as far as can be seen given the limits imposed by the signal in the images, it has a smooth brightness distribution and is roughly circular in appearance. The colours of the galaxy are consistent with its previous classification as a spiral galaxy based on the presence of H1 absorption (Carilli, Rupen & Yanny 1993), strong molecular absorption (Wiklind & Combes 1995) and large Faraday rotations for the images. It is worth noting that the presence of a rich interstellar medium means that extinction along lines of sight through the lensing galaxy may well be important, a possibility we will discuss below.
There are several anomalies associated with the optical properties of the images in the B0218+357 system which might be sufficient to doubt its classification as gravitational lens system, if it were not for the existence of an Einstein ring (Patnaik et al. 1993), a measured time delay (Corbett et al. 1995; Biggs et al. 1998) and high-resolution VLBA 15 GHz observations of B0218+357 (Patnaik et al. 1995). The observed anomalies are:
-
•
The optical and infrared flux ratios (see Table 3 and Grundahl & Hjorth 1995) for the images are very different from the well established radio ones (Patnaik et al. 1993).
-
•
The separation between the images may be less at optical and infrared wavelengths than it is at radio wavelengths (see below).
-
•
The optical/infrared colours of the two images are very different.
The V and I flux densities of B are consistent with the ground-based optical spectrum (Browne et al. 1993, Stickel et al. 1996; Lawrence et al. 1995). Similarly the H flux density is what one might expect if B has a spectrum typical of a BL Lac-like object. The A/B flux density ratios are, however, unexpected. The most obvious result is that they are very different from the 3.7:1 measured in the radio (Patnaik et al., 1993; Biggs et al., 1998). This could arise from micro-lensing of the optical/infrared emission and/or from extinction. However, extinction following a normal Galactic reddening law (Howarth 1983) is not consistent with the optical/infrared colours. This is because, if we attribute everything to extinction, the necessary amount of reddening to give a 1:7 ratio in the V-band image should give about 1:2 in I, assuming an intrinsic 3.7:1 ratio of the radio images. Even if we attribute the gross difference between the radio and optical/infrared ratios to micro-lensing, the fact that the V and I flux densities of image A are the same is not consistent with the A emission being a reddened version of the image B. Furthermore, if the flux densities for image B listed in Table 3 were severely contaminated with lensing galaxy emission, this still would not help. One last possibility would be to invoke some variability in at least one image, although this would not explain the problems arising from comparison between the V and I images which were taken within an hour of each other.
Hjorth (1997) has suggested that the separation between the images may be less at optical and infrared wavelengths (i.e. 300 mas) than it is at radio wavelengths (i.e. 334 mas). It is important to establish if this difference in image separations is real since, if true, it would immediately indicate that we are not seeing two images of the same object in the optical/infrared band.
The radio image separation is well established to be 3341 mas (Patnaik et al. 1993; Patnaik et al. 1995). The separations (and flux densities) given in Table 3 are the result of by-eye fitting of point spread functions to the HST pictures in such a way as to obtain smoothest residuals. The optical pictures have much lower signal-to-noise than the infrared ones, particularly for the A component and have correspondingly bigger errors. The image separation derived from fitting to the NICMOS picture is 3185 mas, a value much smaller than the radio separation given above. This H-band separation is close to the one we find from the optical V and I WFPC2 images (30810 mas and 31110 mas in V and I respectively) but slightly larger than the optical separation found by Hjorth (1997) (29610 mas and 29910 mas from V and I respectively). The method we employ does not explicitly take account of the light from the lensing galaxy.
Models consisting of an exponential disk plus point images have been fitted to the data by McLeod et al. (1999). We have tried the same approach. A point spread function (PSF) was generated by the TinyTim programme (Krist 1997) and was fitted simultaneously to the A and B components of the lens system. We have tried fitting and subtracting the PSF for different positions of the two components. By attributing some of the emission around the B image (about 30%) to the core of the lensing galaxy (central 0.4 0.4 arcsec) we increase the separation until no flux is left (by subtracting both the components and the lensing galaxy) and so we find the maximum best fit to give a separation of 335 mas between the two components. The lensing galaxy has then an offset of 0.54,0.34 x, y pixels from the B component or it is 27 mas away at a position angle of 260∘ from B. By taking into account the light contribution from the lensing galaxy the method removes the discrepancy between the radio and optical/infrared separation. A limit can be deduced for the fraction of the light from the region of the B image which is contributed by the lensing galaxy. If we examine the optical spectra obtained at a number of different epochs (e.g. Browne et al. 1993, Stickel et al. 1996; Lawrence et al. 1995) they show no significant 4000Å break nor any G-band absorption feature found in nearly all galaxy types (Bica & Alloin 1987). Of the light in the spectra 15% comes from the lensing galaxy. This implies that around the region of the B image, at an observed wavelength of 670 nm the galaxy contributes no more than 30% of the total flux density, allowing for slit losses and the fact that the A image makes a small contribution to the total light. Thus, if the lensing galaxy is as blue or bluer than the BL Lac-like spectrum of lensed object, the model with a 30% contribution from the galaxy at 1.6 m is only just consistent with the spectral data. Hence we conclude that, though a priori one would expect the radio and optical/infrared image separations to be the same, there is some evidence to suggest that they are different. The anomalous flux density ratios may also in some way be related to the separation problem.
So as mentioned above even if one takes into consideration the contribution of the light of the lensing galaxy to the B component there still is some doubt that the separation problem between the optical/infrared and radio is completely resolved.
Hjorth (1997) find from their optical data that the bright images that they observed could be identified with the radio A and B components because of the excellent agreement between the position angles, which is also in agreement with Grundahl & Hjorth (1995). They attribute the shorter separation to the extendedness of component A and they argue that what we see is what is not covered by the molecular cloud (Grundahl & Hjorth 1995; Wiklind & Combes 1995). However a potential problem with this interpretation is that the bright image appears to be a point source and not extended as would be expected in this case. The alternative explanation that they offer, that A is actually the core of the lensing galaxy while the counterpart to the B image is somehow swamped in the light of the galaxy core needs also to explain the fact that since B is a BLLac as proved from both ground based spectra and its V, I and H fluxes and the main dominant source of the optical continuum we are expecting to see a radio source at the location of the lens BL Lac (Urry & Padovani 1995) which we do not. Grundahl & Hjorth (1995) actually note that it is possible (due to the small intrinsic extent of A - 1 mas at high radio frequencies, so 5 pc at the redshift of the galaxy) that the molecular cloud can cover the entire image A. If this is the case then we are left with the difficult question concerning the nature of the A emission (hereinafter we refer to the optical/infrared emission near A as A∗) if it is not an image of the AGN. The fact that the true A image is obscured does not mean that all the light from host galaxy of the lensed object must be hidden too; some of its emission could be lensed and give rise to A∗. A difficulty with this idea is that the A∗ image is compact and of high surface brightness not extended as one might expect if it were an image of some part of the AGN host galaxy. Also there is no sign of an equivalent (B∗) image near B.
An alternative possibility is that A∗ is not a gravitational image at all but is part of the emission from the lensing galaxy (or even a foreground object). In this scenario one has to attribute the proximity of A∗ to A, and the fact that the A∗ lies at the expected position angle for a lensed image, to coincidence.
In the end, we find none of the possibilities satisfactory. It could be that we are deluted about the reality of separation difference and there is nothing to explain but the different colours of the A and B images.
3.2 B0712+472
Radio observations revealed this system to be a four-image gravitational lens, although only the A, B and C images were visible in the optical WFPC2 images (Jackson et al. 1998). In the new NICMOS image (Fig. 2) we clearly see the D image also. We use the new data to revisit the question of the anomalous flux density ratios discussed in the earlier work.
In the radio, optical and infrared bands, images A and C have the same flux density ratio (about 2.5:1) within the errors. The major discrepancy concerns the flux densities of B and D. The invisibility of D in V band and its marginal visibility in I can be ascribed to reddening in the lensing galaxy. Reddening was also initially thought to be the case for the large difference observed in the radio and optical flux density of component B (it has 80-90% of the flux of component A in the radio and only 30% of A in 555-nm). However, the fact that the B/A ratio remains constant throughout the optical and infrared within the errors while the inferred reddening at 555 nm, 1 mag, requires the reddening to fall to mag at 1.6 m which is clearly not the case here as seen from the NICMOS images, argues against it. Variability is now also unlikely, since the infrared and optical observations were taken over a year apart, much longer than the likely time delay between images, and yet the B/A optical/infrared flux density ratio has remained relatively constant (and very different from the radio flux density ratio). It seems therefore likely that we are, as suggested by Jackson et al. (1998), seeing an episode of microlensing. Further monitoring of this system over periods of years or tens of years (the typical timescale of microlensing in such a system) should reveal a gradual increase in the optical and infrared B/A flux density ratio.
The positions of all objects are (just) consistent between the optical, infrared and radio images. The exception is an apparent shift of the position of the lensing galaxy at different wavelengths which is small but systematic with increasing wavelength.
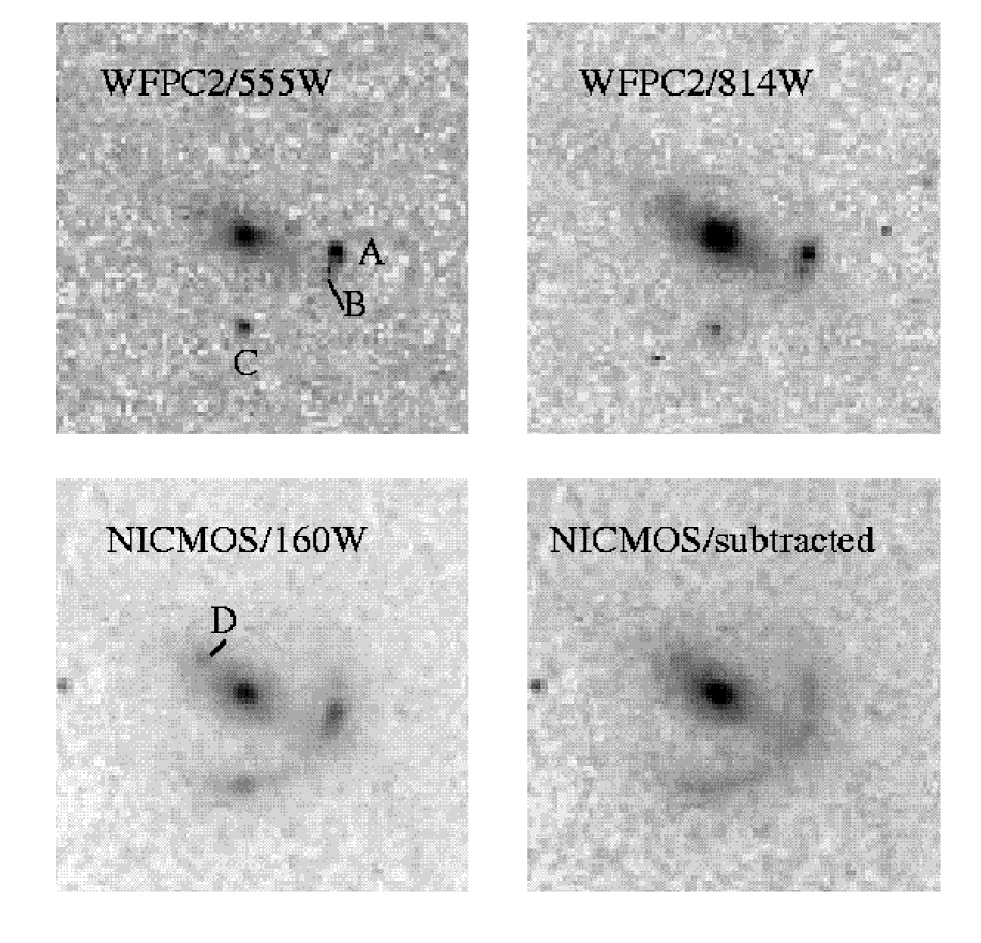
The lensed object appears to have a spectral index of , where the flux F(λ) in the rest-frame wavelength range of 240 nm – 690 nm. This is much redder than the typical values of found for quasars (e.g. Jackson & Browne 1991), implying that little quasar continuum is present. It has already been remarked that the object is severely underluminous (Jackson et al. 1998); it now appears that the continuum is unusually red for a quasar and is thus likely to have a substantial contribution from starlight, although some AGN component must be present to give the broad lines. This reinforces the conclusion that we may be dealing with an example of a mini-quasar inhabiting a host which is bright compared to the AGN component. Given the presumed magnifications (Jackson et al. 1998), the intrinsic radio luminosity of log(/W Hz-1sr-1)24.4 is only just in the radio-loud category as defined by Miller, Peacock & Mead (1990). The host galaxy of the lensed object is also visible, smeared into an arc in the NICMOS picture (Fig. 2) and is considerably redder than the quasar at its centre; the arc is invisible in the optical pictures.
The optical-infrared colours of the lensing galaxy are consistent with the conclusion by Fassnacht & Cohen (1998) that the lens is an early-type galaxy. The 4000Å break, at the galaxy’s redshift of 0.41 (Fassnacht & Cohen 1998) occurs between 555 nm and 814 nm.
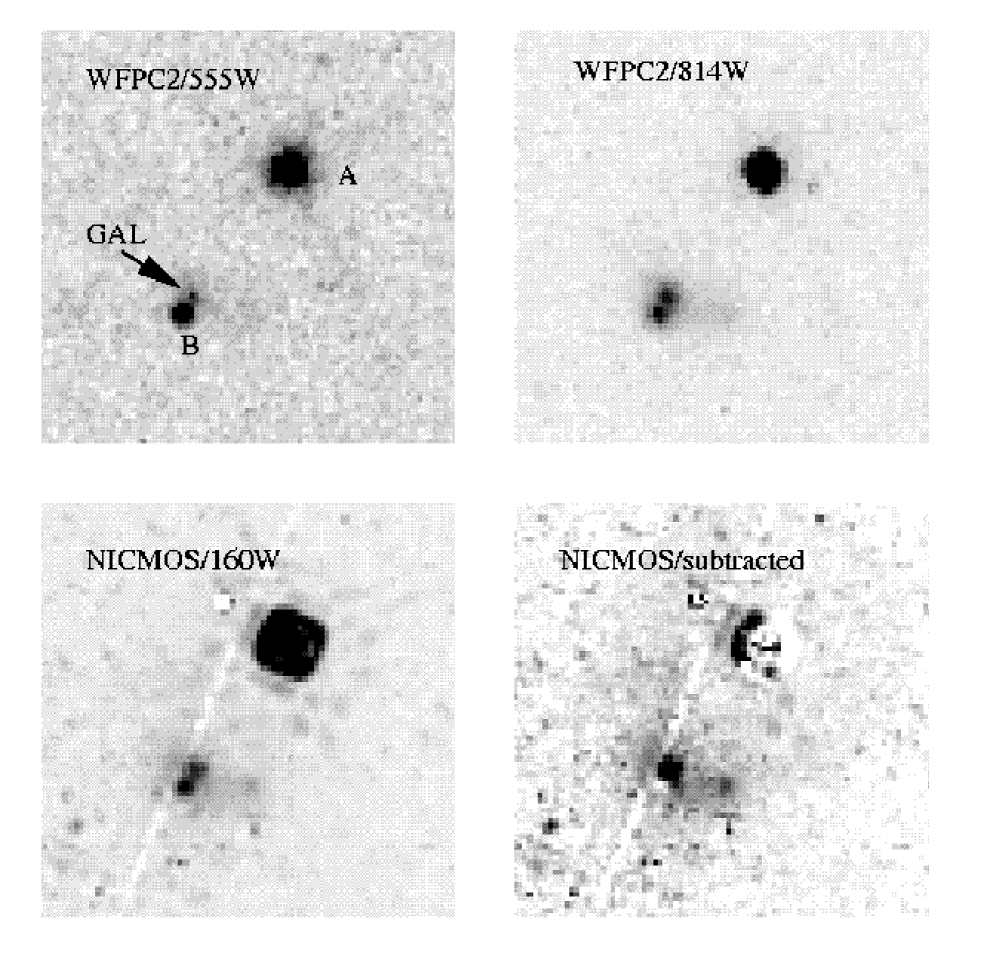
3.3 B1030+074
The discovery of the lensed system B1030+074 was reported by Xanthopoulos et al. (1998). The lensed images are of a quasar/BL Lac of redshift 1.535 (Fassnacht & Cohen 1998) and are separated by 1.56 arcsec with a radio flux density ratio in the range 12 to 19. The lensing galaxy has a redshift of 0.599 and its spectrum is typical of an early type galaxy (Fassnacht & Cohen 1998).
In Fig. 3 we show the WFPC2 V and I pictures (Xanthopoulos et al., 1998), together with our new NICMOS 1.6 picture. In all three bands the lensing galaxy is seen near the fainter B image. The peak of the galaxy light lies on the line joining the two images but there is also a secondary emission feature to the SE of the main part of the galaxy. Xanthopoulos et al. suggest that this secondary peak may be a spiral arm. The H-band data indicate that the colour of this feature is similar to that of the rest of the lensing galaxy, possibly suggesting that it is not a spiral arm but either part of the main galaxy or a companion object.
The colours of the lensed images are consistent with our knowledge that the lensed object is a quasar or BL Lac object. Of interest, however, are the optical/infrared flux density ratios of the images which are considerably higher than any of those measured at radio frequencies. It is tempting to attribute such differences to extinction but the fact that the H-band ratio is even larger than V and I ratios argues against this. We suggest that the differences are best explained as arising from microlensing. Substructure in the lensing galaxy can also distort the radio flux ratios (as in microlensing for optical fluxes), in particular for highly magnified images, without appreciably changing image positions. As Mao & Schneider (1998) note such substructure can be for example spiral arms in disk galaxies or structure caused by continuous merging and accretion of subclumps, as may possibly be the case for B1030+074, and can have a little effect on time delays and the determination of H0.
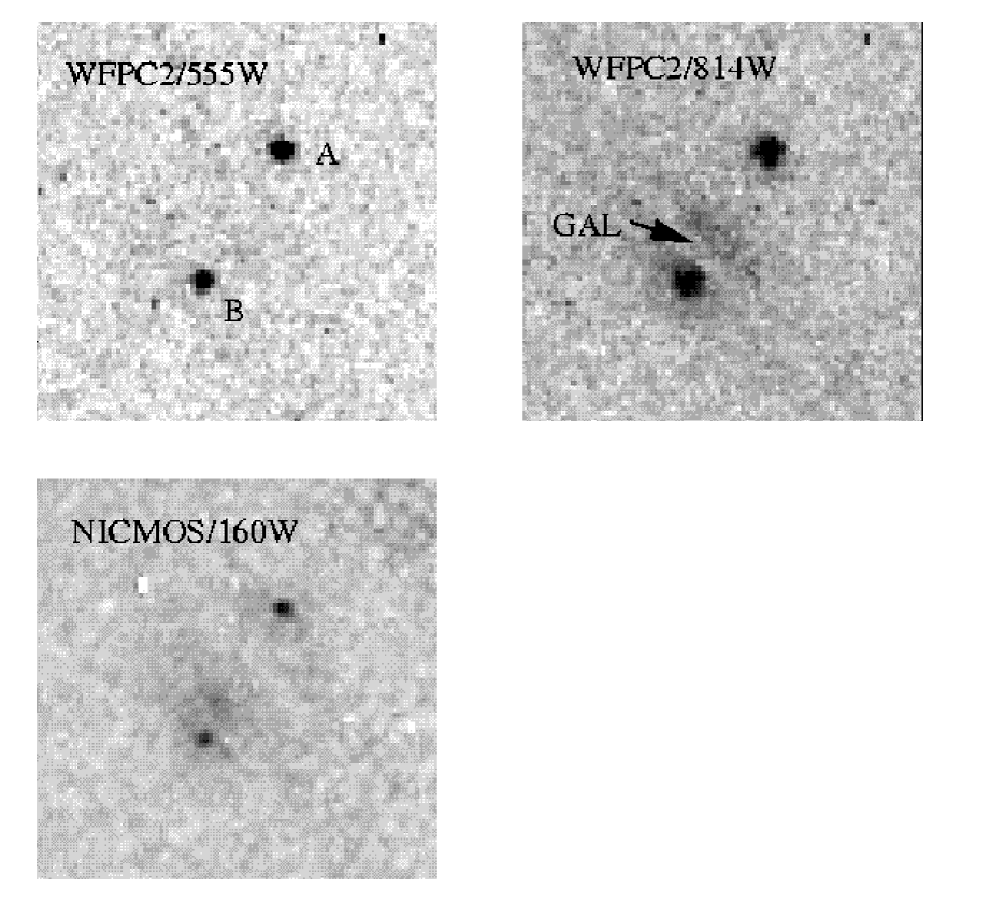
3.4 B1600+434
The lens system B1600+434 was discovered in the first phase of the CLASS survey (Jackson et al. 1995). It is a two-image system of separation 1392 mas; the lensing galaxy lies close to the southeastern component. In Fig. 4 we show the HST 555-nm and 814-nm images, together with the new NICMOS 1.6-m image. The lensing galaxy is an edge-on spiral (Jaunsen & Hjorth 1997; Kochanek et al. 1999), which has been modelled in detail by Maller, Flores & Primack (1997) and by Koopmans et al. (1998).
Photometry of this object is affected by the coincidence of the southeastern image, B, with the lensing galaxy. It is also likely that both optical images are variable (Jaunsen & Hjorth 1997). Jaunsen & Hjorth (1997) present ground-based BVRI photometry from which they deduce substantial reddening to be present in image B, almost certainly due to passage through the lensing galaxy. The infrared data lend support to this view, as the flux density ratios of the images in the infrared and radio are indistinguishable to within the errors.
The unreddened image A has a spectral index , which is roughly the spectral index of a normal quasar.
4 Summary and conclusions
Our NICMOS observations have proved successful at detecting both lensing galaxies and lensed objects. We find that often the flux density ratios of the images are different from those measured at radio wavelengths. Having infrared colours enables us to distinguish between extinction and microlensing as explanations for the different flux density ratios. We find evidence for both in different systems. Reddening is clearly affecting the B image in B1600+434 and may be part of the explanation for the puzzling system B0218+357. On the other hand, in both B0712+472 and B1030+074, the fact that the infrared and optical image flux density ratios are the same but different from the radio ones is strong evidence that microlensing is important in these objects.
On a larger scale microlensing can have an important effect on lensing statistics (see Bartelmann & Schneider 1990) and the fact the we see evidence in maybe three of the four systems examined here argues that the phenomenon is not as rare as previously thought. If microlensing is considered, single highly-magnified images can occur and for example the tight correlation between total magnification and flux ratio is weakened by microlensing.
The arcs seen in B0712+472 illustrate another important fact. Many of the lensed objects have relatively subluminous AGN and in some cases the infrared emission from the host galaxy starlight dominates over that from the AGN. This is when arcs are seen. Other examples are B1938+666 (King et al. 1998), B2045+265 (Fassnacht et al. 1999) and B1933+503 (Marlow et al. 1999). With an arc the lensing galaxy potential is probed at many points and provides useful additional constraints for the lens mass models.
Acknowledgments
This research was based on observations with the Hubble Space Telescope, obtained at the Space Telescope Science Institute, which is operated by Associated Universities for Research in Astronomy, Inc., under NASA contract NAS5-26555. This research was supported by the European Commission, TMR Programme, Research Network Contract ERBFMRXCT96-0034 “CERES”. We thank C. Kochanek for comments leading to an improvement in the first version of the paper.
References
- [1] Bartelmann, M., Schneider, P, 1990, A&A, 239, 113
- [2] Bica, E., Alloin, D., 1987, A&AS, 70, 281
- [3] Biggs, A.D., Browne, I.W.A., Helbig, P., Koopmans, L. V. E., Wilkinson, P.N., Perley, R. A., 1998, MNRAS, 304, 349.
- [4] Browne, I.W.A., Patnaik, A.R., Walsh, D., Wilkinson, P.N., 1993, MNRAS, 263, L32
- [5] Carilli, C.L., Rupen, M.P., Yanny, B., 1993, ApJ, 412, L59
- [6] Corbett, E.A., Browne., I.W.A., Wilkinson, P.N., & Patnaik, A.R., 1995. “Astrophysical Applications of Gravitational Lensing”, ed. Kochanek, C., IAU Symposium 173, Reidel, Dordrecht
- [7] Fassnacht, C.D., Cohen, J. G., 1998, AJ, 115, 377
- [8] Fassnacht, C.D., et al., 1999, AJ, 117, 658
- [9] Grundahl, F., Hjorth, J., 1995, MNRAS, 275, L67
- [10] Hjorth, J., 1997, in “Golden Lenses”, workshop held at Jodrell Bank, June 1997, available at http://multivac.jb.man.ac.uk:8000/ ceres/workshop1/proceedings.html
- [11] Howarth, I. D., 1983, MNRAS, 203, 301
- [12] Jackson, N., Browne, I.W.A., 1991, MNRAS, 250, 414
- [13] Jackson, N. et al., 1995, MNRAS, 274, L25
- [14] Jackson, N. et al., 1998, MNRAS, 296, 483
- [15] Jaunsen, A. O., Hjorth, J., 1997, A&A, 317, L39
- [16] Keeton, C. R., Kochanek, C. S., 1997, ApJ, 487, 42
- [17] Keeton, C. R., Kochanek, C. S., Falco, E. E., 1998, ApJ, 509, 561
- [18] King, L. J., Jackson, N. N., Blandford, R. D., Bremer, M. N., Browne, I. W . A., de Bruyn, A. G., Fassnacht, C., Koopmans, L., Marlow, D. R., Wilkinson, P. N., 1998, MNRAS, 295, L41
- [19] Kochanek, C. S, 1996, ApJ, 466, 638
- [20] Kochanek, C. S, Falco, E. E., Impey, C. D., Lehár, J., McLeod, B. A., Rix H.-W., 1999, Proceedings of the 9th Annual Astrophysics Conference in Maryland, After the Dark Ages: When Galaxies Were Young, eds. S. Holt and E. Smith, American Institute of Physics Press, 1999, p. 163
- [21] Koopmans, L.V.E., de Bruyn, A.G., Jackson, N., 1998, MNRAS, 295, 534
- [22] Krist, J., 1997, “WFPC2 ghosts, scatter and PSF field dependence”, postscript document available from the STScI WWW page
- [23] Kundić, T., Turner, E.L., Colley, W.N., Gott, J.R., Rhoads, J.E., Wang, Y., Bergeron, L.E., Gloria, K.A., Long, D.C., Malhotra, S., Wambsganss, J., 1997, ApJ, 482, L37
- [24] Larkin, J.E., Matthews, K., Lawrence, C.R., Graham, J.R., Harrison, W., Jernigan, G., Lin, S., Nelson, J., Neugebauer, G., Smith, G., Soifer, B.T., Ziomkowski, C., 1994, ApJ, 420, L9
- [25] Lawrence, C.R., Cohen, J.G., Oke, J.B., 1995, AJ, 110, 2583
- [26] Lawrence, C.R., Elston, R., Januzzi, B.T., Turner, E.L., 1995, AJ, 110, 2570
- [27] Maller, A., Flores, R.A., Primack, J.R., 1997, ApJ, 486, 681
- [28] Mao, S., Schneider, P., 1998, MNRAS, 295, 587
- [29] Marlow, D.R., Browne, I.W.A, Jackson, N., Wilkinson, P. N., 1999, MNRAS, 305, 15
- [30] McLeod, B., Falco, E.E., Impey, C., Kochanek, C., Lehar, J., Rix, H.-W., Keeton, C., Muñoz, J.A., Peng, C.Y., 1999, in preparation
- [31] Miller, L., Peacock, J.A., Mead, A.R.G., MNRAS, 244, 207, 1990
- [32] Myers, S. T., et al., 1998, in preparation
- [33] Patnaik, A.R., Browne, I.W.A., King, L.J., Muxlow, T.W.B., Walsh, D., Wilkinson, P.N., 1993, MNRAS, 261, 435
- [34] Patnaik, A.R., Porcas, R.W., Browne, I.W.A., 1995, MNRAS, 274, L5
- [35] Refsdal, S., Stabell, R., 1997, A&A, 325, 877
- [36] Saha, P., Williams, L. L. R., 1997, MNRAS, 292, 148
- [37] Schechter, P.L., et al., 1997, ApJ 475, L85
- [38] Stickel, M., Rieke, G.H., Kühr, H., Rieke, M.J., 1996, ApJ, 468, 556
- [39] Urry, C. M., Padovani, P., 1995, PASP, 107, 803
- [40] Wiklind, T., Combes, F., 1995, A&A, 299, 382
- [41] Witt, H.-J., Mao, S., 1997, MNRAS, 291, 211
- [42] Xanthopoulos, E., et al., 1998, MNRAS, 300, 649