Globular Cluster Ages and Strömgren CCD Photometry
Abstract
Strömgren CCD photometry can be used in a variety of ways to constrain the absolute and relative ages of globular clusters. The reddening corrected diagram offers the means to derive ages that are completely independent of distance. Very precise differential ages for clusters of the same chemical composition may also be determined from such 2–color plots, or from measurements of the magnitude difference, , between the subgiant and horizontal branches on the plane (where both of these features are flat and well-defined, even for clusters like M13 that have extremely blue HBs on the diagram). Based on high-quality photometry we find that: (1) M92 is Gyr old, (2) M3 and M13 differ in age by Gyr, and (3) NGC 288, NGC 362, and NGC 1851 are coeval to within Gyr. These results strongly suggest that age cannot be the “second parameter”. Finally, we suggest that the observed variations in among giant branch stars in all the metal–poor clusters that we have studied so far are likely due to star–to–star C and N abundance variations, and potentially indicate that most (if not all) globular clusters have “primordial” variations in at least these elements.
University of Victoria, Department of Physics and Astronomy
PO Box 3055, Victoria, BC, V8W 3P6, Canada
1. Introduction
Strömgren photometry has, for many years, served as an important source of information about the Galactic field and halo star populations due to its capability for deriving such physical parameters as metal abundance, effective temperature and luminosity for individual stars (see eg. the series of papers by Schuster and Nissen (1989), for recent examples and references). The filters are of intermediate width and thus their application in photoelectric photometry of faint stars, as found near the turnoff (TO) in open and globular clusters is rather difficult. With the availability of CCD detectors with excellent near UV sensitivity and low readout noise, as well as telescopes with superb image quality, it is now possible to obtain precise and accurate photometry for individual TO and main–sequence stars in such objects. Pioneering work in this field has been carried out by Anthony-Twarog (1987a) and Anthony-Twarog & Twarog (1987b) but those early studies were hampered by the low quantum efficiency (in particular in the band centered at 3500Å) and the high readout noise of the available CCD detectors.
In the present contribution some results from a large programme of photometry in globular (and open) clusters carried out with the Nordic Optical Telescope (NOT) on La Palma and the Danish 1.54m telescope at ESO, will be described. Other results from this programme are described by Landsman et al. (1999, these proceedings) and Grundahl et al. (1998, 1999), who give brief descriptions of the data sets that were obtained.
2. Absolute Cluster Ages
The motivations for studying star clusters are many and well known and they have been discussed at length in the recent literature, eg. Renzini & Fusi Pecci (1988), VandenBerg, Bolte & Stetson (1996). Of particular interest is the determination of absolute cluster ages as these provide strict lower limits to the age of the Universe. Recent attempts (Carretta, Gratton, Clementini & Fusi Pecci 1999 and references therein) based on the results of the ESA space astrometry mission HIPPARCOS illustrate how the determination of cluster ages from comparison of cluster color–magnitude diagrams to stellar evolution models depends critically on the quality of the available subdwarf parallaxes and cluster reddening and abundance determinations. As has been most clearly illustrated by Schuster and Nissen (1989), photometry offers the ability to determine distance independent stellar ages for stars near the turnoff through the use of the index which, for F and G type stars, is sensitive to surface gravity (and hence evolutionary status). Not only is the determination of the age independent of distance, but it is also only very slightly dependent on reddening because E, and thus even relatively large errors in E() have only minor effects on , and the derived absolute age depends primarily on the value of the TO stars.
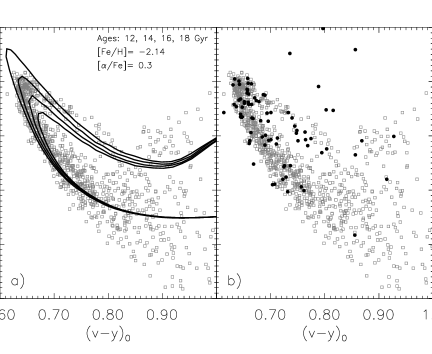
The application of this method is illustrated in Figure 1a for one of the most metal–poor GCs, M92, using data obtained with the Nordic Optical Telescope in excellent seeing conditions. We note that a fairly high age of nearly 15 Gyr seems appropriate for this cluster. The overplotted isochrones are based on the evolutionary tracks reported by VandenBerg et al. (1999), with colors kindly calculated by R. A. Bell. In Fig. 1b the position of very metal–poor field stars from Schuster et al. (1996) in the diagram is illustrated. We have assumed that the field stars have the same reddening as the cluster stars, and not used the individual reddenings tabulated by Schuster et al. (1996). This is for the reason that for the majority of the stars (most of which are found at high galactic lattitudes) have rather large errors in E() due to relatively large (random) errors in the photoelectric H photometry of these faint stars. In fact, if the individual reddenings are used, the scatter among the field stars increases significantly, indicating that the assumption of a constant, low, reddening is not unreasonable.
It is worth noting that, as for other methods attempting absolute age determinations, accurate photometry is essential. However if this is available the main uncertainties in the age determinations lie in the models and their transformation to the observed plane as well as in the determination of detailed cluster abundances. Importantly, the problem of determining accurate distances is completely eliminated.
3. Relative Cluster Ages for 2’nd Parameter Pairs
As we have in hand accurate photometry for M3 and M13, it is obviously of interest to compare their ages. These two clusters have very similar metallicities but quite different HB morphologies with that of M13 being much bluer than M3. Given that the two clusters have a similar [Fe/H] (the first parameter) what other factor(s) govern their HB morphology (the second parameter problem)? Age has been a popular candidate in recent years since, according to theoretical calculations older clusters have bluer HBs. However, as discussed by Stetson, VandenBerg & Bolte (1996), there is little solid evidence that this is in fact the case — but at the same time the available photometry for the most famous (and easily studied) pairs has not been of a sufficiently high quality that unambiguous conclusions could be drawn. We will compare the ages of these two clusters via three different methods:
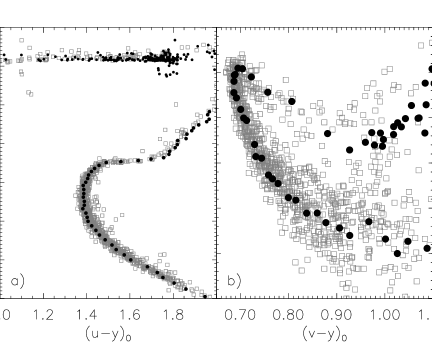
The –method: It is common to estimate GC ages by deriving the –band luminosity difference between the HB and cluster TO ( method). However, in the case of clusters with different HB morphologies, this is not an easy task — especially if the clusters under study do not have stars with an overlap in color on the HB (see Stetson, VandenBerg & Bolte 1996 for a review). We have found that, for BHB clusters, the stars hotter than the instability strip and cooler than the jump (Grundahl et al. 1999, Landsman et al., these proceedings) the HB is horizontal in a diagram, as illustrated in Figure 2a, where the M3 fiducial sequence has been overlayed on the M13 CMD. The shift in color corresponds to E001. From this figure it is also evident that the SGB is flat, which makes it much easier to estimate its level accurately than eg. . Thus using has the potential to yield much more accurate estimates of the relative ages of BHB clusters. Model isochrones indicate that grows at a rate of 007 Gyr-1. We see that there appears to be a small (005) difference in between the two clusters corresponding to Gyr, with M13 being the older (Fig. 2a). The error estimate is based entirely on the errors of the mean values of the HB and SGB levels and relies on the assumption that only the age varies between the two.
The horizontal method: VandenBerg, Bolte and Stetson (1990) showed how the color difference between the cluster turnoff and lower RGB could be used as a relative age indicator. We have measured the color difference for these two clusters using their derived fiducial sequences and find that it indicates an age difference of 1 Gyr. This is consistent with the estimate.
The value for the cluster turnoff: As discussed in the previous section, the value for a cluster turnoff is an excellent age indicator, independent of cluster distance, HB– and RGB morphology, and nearly independent of reddening. In Figure 2b we present a comparison of the fiducials for these two clusters in the plane. It is evident, since the turnoffs coincide, that this comparison indicates essentially no age difference between the clusters. We note that only shifts based on their canonical reddenings have been applied. Furthermore using other colors, such as , or instead of leads to exactly the same conclusion (using only shifts corresponding to a reddening difference of E) that the age difference between these two clusters is essentially zero. Based on the above analyses, which all indicate Gyr, age can hardly be the main factor responsible for the difference in the HB morphology of these two clusters. It should however be stressed that this conclusion depends on the assumption that both clusters have identical abundances.
As part of this programme, we have also observed NGC 288, NGC 362 and NGC 1851 which are belived to be chemically very similar. An accurate estimate of the age differences between them would be interesting since the difference in HB morphology between NGC 288 and NGC 362 is even more extreme than in the case of M3/M13. NGC 362 has a much redder HB than NGC 288, whereas the morphology of the HB in NGC 1851 is intermediate between the two. Unfortunately the photometry for these clusters is not precise enough to use to estimate their age differences. However if we use the diagram and NGC 1851 as a “bridge” between the HB of NGC 288 and NGC 362, as first proposed by Stetson, VandenBerg and Bolte (1996), we can estimate their relative ages. This approach is shown in Figure 3.
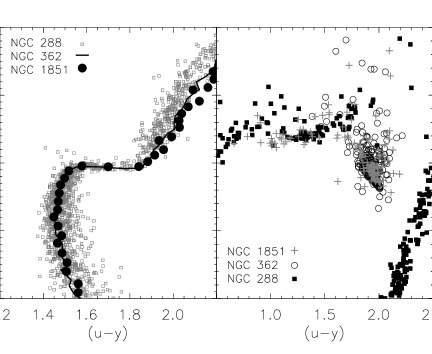
We proceeded to make this comparison, by first deriving fiducial sequences for the MS, TO and lower RGB of each cluster. Next we added arbitrary shifts in color and luminosity to align the TO regions (Fig. 3, left). These shifts were then applied to the photometry for the HB stars in each cluster, resulting in the right panel of Figure 3.
From the right panel in Fig. 3 we note that the NGC 1851 stars (gray plus signs) match well the ZAHB level for NGC 288 (black squares) in the color interval 1–1.5 in . Also, at the NGC 1851 RHB stars match the NGC 362 (open circles) RHB stars; the small difference in level (or color) corresponds to 004 in . Since the offsets applied to the HB stars have been determined from the requirement that the age–sensitive SGB regions (left panel) are aligned, we conclude from this comparison that the age differences between these three clusters are Gyr. Such a small difference is not enough to explain the difference in HB morphology between NGC 288 and NGC 362 (Catelan & De Freitas Pacheco 1993).
It is however worth noting that, as was the case for the M3/M13 comparison, the color difference between the TO and lower RGB seems to be larger for NGC 362 and NGC 1851 than for NGC 288. As no adequate models on the system , at this metallicity, are available at this time we cannot determine a limit to the possible age difference between the clusters from this method. VandenBerg (1999) discusses the possible dependence of the interpretation of age differences derived via the “horizontal” method on abundance and choice of filters.
It seems very likely that the age differences between these three clusters are too small to explain the variations in HB morphology in terms of age. However, additional observations will be required to settle this issue. In particular, we suggest that, if sufficiently accurate values can be measured for the cluster TO’s, the age differences can be inferred independently of the HB morphology (as for M3/M13). Such a project, which is easily carried out in 1–2 nights on a 4m class telescope avoids completely the difficult problem of comparing a red HB to a blue HB.
4. RGB scatter
Grundahl et al. (1998) reported a large spread in (at fixed luminosity or color) among the RGB stars in M13 and speculated that this could be due to star-to-star variations in the strength of their CN bands. We have subsequently analysed photometry for many other clusters and in all cases we find a scatter reminicent to that found in M13. For clusters in the metallicity range to we also find an indication that the “width” of the scatter gets smaller as the luminosity increases from the RGB bump level towards the RGB tip.
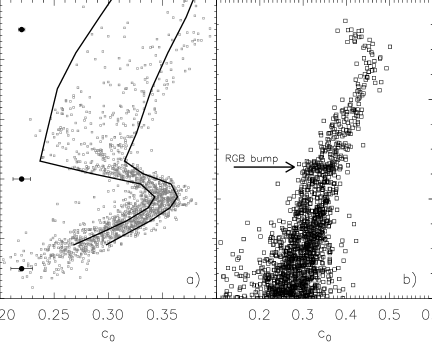
Michael Briley has kindly carried out simulations of RGB spectra with varying amounts of C and N abundances corresponding to that observed in TO and MS stars in 47 Tuc and NGC 6752. We show in Figure 4a how these simulations reproduce the width of the scatter observed in M13. The variations found in these two clusters are widely suspected to be “primordial” in origin since there are no known mixing proceses that can operate in stars near the MSTO in GC’s which could produce star–to–star variations in C and N sufficiently large to produce the observed scatter. If C and N variations are the explanation for the observed scatter, then this probably implies that most GC’s have significant variations in (at least) C and N, due to earlier generations of field- and/or cluster stars. We emphasize that this interpretation relies on the correctness of the atmosphere models as we do not yet have spectra for the stars. The observed “narrowing” of the scatter in stars brighter than the RGB bump (see Fig. 4b) could potentially be understood as the result of deep mixing commencing at this point on the RGB (Sweigart & Mengel 1979, Charbonnel, Brown & Wallerstein 1998, Carretta, Gratton, Sneden & Bragaglia 1998). Such mixing would bring CN processed material to the surface of RGB stars. This would have the effect of decreasing the C abundance and increasing the N abundance with the net result that the CN and CH features present in the and bands become weaker, thereby reducing the observed spread.
5. Conclusions
Strömgren photometry offers the potential to determine globular cluster ages without needing to know their distances and with only a weak sensitivity on the cluster reddening. If current steller interior and atmosphere models are correct, this implies an age of nearly 15 billion years for M92. For two pairs of second parameter clusters we showed how the inclusion of the filter can help in measuring their relative ages, and found that M3 and M13 differ by less than one billion years in age. The range in age encompassed by NGC 288, NGC 362 and NGC 1851 appears to be less than 1.5 billion years. To improve further on these age constraints requires a better knowledge of the detailed cluster abundances. Finally, it was discussed that the index is potentially an excellent indicator of the surface abundances of C and N in low metallicity RGB stars – and the results for clusters that we have observed so far indicate that they may all have “primordial” variations in (at least) these elements and that the reduction of the scatter observed in RGB stars brighter than the bump could be due to non–canonical mixing.
Acknowledgments.
I would like to acknowledge useful and stimulating conversations and exchange of data and models with Michael Andersen, Roger Bell, Michael Briley, Márcio Catelan, James Hesser, Poul Erik Nissen, Peter Stetson and Don VandenBerg. Financial support from The Danish Natural Sciences Research Council, Don VandenBerg, The Herzberg Institute of Astrophysics and the Carlsberg Foundation is also gratefully acknowledged.
References
Anthony–Twarog, B. J. 1987a, AJ, 93, 1454
Anthony–Twarog, B. J., & Twarog, B. A. 1987b, AJ, 94, 1222
Carretta, E., Gratton, R., Sneden, C., & Bragaglia, A., to appear in the proceedings of the meeting “Galaxy Evolution: Connecting the Distant Universe with the Local Fossil Record”, Observatoire de Paris–Meudon, 21–25 September 1998
Carretta, E., Gratton, R., Clementini, G. & Fusi Pecci, F., 1999, preprint, (astro-ph 9902086)
Catelan, M., & De Freitas Pacheco, J. M., 1993, AJ, 106, 1858
Charbonnel, C., Brown, J. A., Wallerstein, G., 1998, A&A, 332, 204
Grundahl, F., VandenBerg, D. A., & Andersen, M. I., 1998, ApJ, 500, L179
Grundahl, F., Catelan, M., Landsman, W. B., Stetson, P. B., & Andersen, M. I., 1999, ApJ, 524, Oct. 10 issue.
Landsman, W. B. 1999, these proceedings.
Renzini, A., & Fusi Pecci, F., 1988, ARA&A, 26, 199
Schuster, W. J., & Nissen, P. E., 1989, A&A, 221, 65
Schuster, W. J., & Nissen, P. E., Parraro, L, Beers, T. C., & Overgaard, L. P., 1996, A&AS, 117, 317
Stetson, P. B., VandenBerg, D. A., & Bolte, M., 1996, PASP, 108, 560
Sweigart, A. V., & Mengel, J. G., 1979, ApJ, 229, 624
VandenBerg, D. A., 1999, ApJ, submitted
VandenBerg, D. A., Bolte, M., & Stetson, P. B., 1990, AJ, 100, 445
VandenBerg, D. A., Bolte, M., & Stetson, P. B., 1996, ARA&A, 34, 461
VandenBerg, D. A., Swenson, F. J., Rogers, J. J., Iglesias, C. A., & Alexander, D. R., 1999, ApJ, submitted