Abstract
The projected multiplicity function of galaxies gives (per square degree) the density of galaxy aggregates formed by N members. We use the CRoNaRio matched catalogues to derive the low N () multiplicity function from D-POSS data. The van Albada (1982) algorithm was implemented and used to identify candidate groups in the CRoNaRio catalogues. In absence of redshift surveys complete down to the magnitude limit of the DPOSS material and covering a wide enough area, the performances of the algorithm were tested on realistically simulated catalogues.
The application to a set of 13 CRoNaRio catalogues allowed us to derive a multiplicity function as accurate as those available in literature obtained from redshift surveys.
1 Introduction
The multiplicity function (hereafter MF) is a powerful tool to test the various cosmological scenarios (Combes & Boissé 1991) and provides an independent way to measure the index of the initial perturbation spectrum at the era of baryonic recombination (Turner, Gott III 1976).
The CRoNaRio project is a joint enterprise among Caltech and the astronomical observatories of Napoli, Roma and Rio de Janeiro, aimed to produce the first general catalogue of all objects visible on the DPOSS (Digitised Palomar Sky Survey). The final Palomar-Norris catalogue will include astrometric, photometric (in the three Gunn-Thuan bands g, r and i) and rough morphological information for an estimated stars and galaxies. More than of the catalogues are already available and are currently being used for many scientific applications.
2 The van Albada algorithm
In order to compile a catalog of candidate groups of galaxies in absence of redshift information, we implemented a slightly modified version of the van Albada algorithm (Soares 1989).
This algorithm makes use of apparent magnitude and projected position in the sky only, and gives, for each pair of adjacent galaxies, their probability of being physically related.
Assuming a Poisson statistic, the probability that the angular distance of a fixed galaxy to its nearest non-physical companion lies between and is given by:
The introduction of an adimensional distance (defined as the ratio of the observed to the expected mean distance to the nearest neighbour) allows to combine the angular separation of different pairs into a single distribution (Fig. 1) removing the effects of clustering in the background.

3 The accuracy of the algorithm
In order to test the accuracy (lost groups) and the reliability (spurious groups) of the algorithm, we tested it on realistically simulated sky fields.
We first produced the galaxy background by assuming uniform distribution and the field luminosity function given by Metcalfe et al. 1994; then we added simulated groups of galaxies according to the multiplicity function by Turner & Gott III 1976, with redshift computed according to:
and absolute magnitude of the brightest galaxy in the group taken from the cumulative luminosity function for groups of galaxies:
where and . Other parameters which were varied in the course of the simulations were:
-
the diameter of the group inside a Gaussian distribution centered at: ;
-
the maximum possible redshift for a group, which were assumed to fall in the range: .
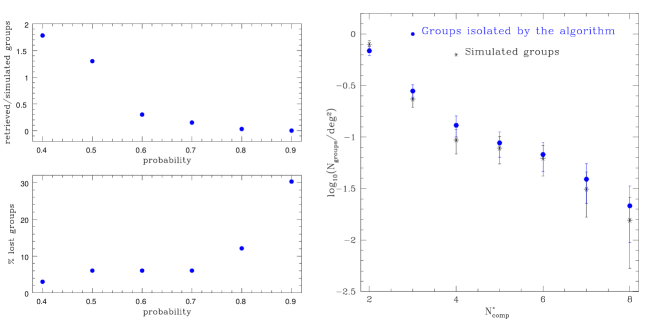
Different simulations were performed in order to optimize the lower limit of the probability for which two galaxies were considered as physical companions by the algorithm. The optimal value, id est the value ensuring the best compromise between accuracy and reliability (Fig. 2),
turned out to be .
With this choice, the modified Van Albada algorithm succeds in retrieving, from the simulated catalogues, more than of the groups having more than three components.
4 A preliminary Multiplicity Function from CRoNaRio data
The figure (Fig. 3) gives the MF obtained from CRoNaRio plates (subtending a total solid angle of ). In the same figure we also compare it with six other MFs taken from literature:
-
1.
MF derived from magnitude limited surveys making use of redshift information: Garcia (Garcia et al. 1993), CfA (Geller & Huchra 1983), NorthCfA (Ramella, Pisani 1997), ESP (Ramella et al. 1998)
-
2.
MF derived from diameter limited survey: Maia (Maia & Da Costa 1989)
-
3.
MF derived from limited magnitude survey without redshift information: Turner (Turner & Gott 1976)
Agreement is found between our FM, obtained with our algorithm without any tridimensional data, and the ones in literature using redshift information. Therefore, with our algorithm, even in absence of redshift information, it is possible to explore wide areas of the sky and to retrieve groups () with an efficiency comparable to that of 3-D surveys.

5 An estimate of
For the groups with at least one redshift available, MF (as a function of luminosity) was calculated. With a fit of the observed data to the theoretical function
| (1) |
we obtained:
This allows an estimate of the spectral index :
References
- 1
- 2 Combes F., Boissé P. 1991 Galaxies and Cosmology
- 3 Frei Z., Gunn J.E. 1994 AJ,108,4,147
- 4 Garcia A.M. 1995 A&A,297,56
- 5 Geller M.J., Huchra J.P. 1983 ApJSS,52,61
- 6 Gott III J.R., Turner E.L. 1976 ApJ,209,1
- 7 Maia M.A.G., Da Costa L.N. 1989 ApJSS,69,809
- 8 Metcalfe N., Godwin J.G., Peach J.V. 1994 MNRAS,267,431
- 9 Ramella M., Pisani A. 1997 AJ,113,2,483
- 10 Ramella M.et al. 1998 A&A (astro-ph/9811150)
- 11 Soares D.S.L. 1989 Investigation of binary galaxies, Ph.D. Thesis
- 12 Turner E.L., Gott III J.R. 1976 ApJSS,32,40
- 13 Turner E.L., Gott III J.R. 1976 ApJ,209,6
- 14