VLBA ABSORPTION IMAGING OF IONIZED GAS
ASSOCIATED WITH THE
ACCRETION DISK IN NGC 1275
Abstract
Nearly simultaneous VLBA observations of 3C 84, the radio source associated with NGC 1275, have been made at multiple frequencies to study the free-free absorption of the northern, or “counterjet”, feature found by Walker, Romney, and Benson (1994) and by Vermeulen, Readhead, and Backer (1994). Our observations confirm that the spectra are consistent with free-free absorption and eliminate the possibility that the earlier result was an effect of variability. The northern feature is well resolved spatially, so images have been made showing the distribution of the absorption over a region of about 1.5 pc on a side, beginning about 1.5 pc from the presumed location of the central object. That distribution is dominated by a strong decrease with radial distance. The magnitude of the absoption near 2.5 pc projected distance from the central object is consistent with a K gas with an emission measure of about pc cm-6. The geometry is consistent with absorption by ionized gas associated with an accretion disk. The data provide firm constraints for models of the outer regions of accretion disks and, perhaps, associated winds.
Accepted 1999 Sept. 9 for publication in the Astrophysical Journal.
1 Introduction
The dominant member of the Perseus Cluster is the galaxy NGC 1275, which has a Seyfert-like nucleus, but an unusual morphology. Minkowski (1957) found that it contains two velocity systems, one at 5300 km s-1and the other at 8200 km s-1. The low velocity system includes the main body of NGC 1275 (Strauss et al. 1992) and filaments of ionized gas thought to be a product of the cooling flow that is centered on the galaxy. CO and X-ray observations suggest the cooling flow rate is several hundred (Lazareff et al. 1989; Allen & Fabian 1997). HST and Keck observations of globular clusters suggest that many may have been formed in a merger event several hundred million years ago (Carlson et al. 1998; Brodie et al. 1998). The high velocity system includes giant H II clouds. Hydrogen associated with the high velocity system is seen in absorption against the nuclear radio emission (DeYoung, Roberts, & Saslaw 1973; Romney 1978). This and other evidence indicate that the high velocity system is either infalling, or is a system that is already part way through the main galaxy (e.g. Kaisler et al. 1996; Nørgaard-Nielsen et al. 1993).
The radio source 3C 84 is associated with NGC 1275. The features coincident with the center of the galaxy constitute one of the strongest compact radio sources in the sky. This source began a major increase in activity in about 1959. It was below 10 Jy in the earliest observations, but was already rising towards peaks in excess of 50 Jy in the 1970’s and 1980’s (Dent 1966; Pauliny-Toth & Kellermann 1966; Pauliny-Toth et al. 1976; O’Dea, Dent, and Balonek 1984; Nesterov, Lyuty, & Valtaoja 1995). It has been high ever since, although in recent years the flux density had been decaying and is currently around 20 Jy at centimeter wavelengths.
The compact structure of 3C 84 has been the object of Very Long Baseline Interferometry (VLBI) observations since the early days of that technique (See, for example, Pauliny-Toth et al. 1976; Readhead et al. 1983; Romney et al. 1984; Marr et al. 1989; Biretta, Bartel, & Deng 1991; Krichbaum et al. 1993; Venturi et al. 1993; Dhawan, Kellermann, and Romney 1998; Romney, Kellermann, & Alef 1999). It has complex structure on parsec scales that frustrated imaging efforts in the early years. But early models, combined with more recent images made with the global networks and with the Very Long Baseline Array (VLBA — Napier et al. 1994) show that, south of the compact core, there is a bright region of emission that has been increasing in length by about 0.3 milliarcseconds yr-1 (mas yr-1) and whose size extrapolates back to zero at about the time of the 1959 outburst (Romney et al. 1982; the rate is from Walker, Romney, and Benson 1994, hereafter WRB, and is based on their image and others from the literature). The bright region now extends about 15 mas south of the compact core. It is almost certainly related to a jet, but the morphology is somewhat like the radio lobes seen in many sources on much larger scales. This may indicate that the jet material from the 1959 event is not simply following earlier material down the jet channel, but is interacting strongly with either that material or the surrounding medium. To avoid a physical bias, we will simply call the bright regions “features”. For this study, they are only used as sources of background radiation with which to study the absorbing medium.
Beyond the bright southern feature, the remnants of earlier activity are clearly seen. Immediately south of the 15 mas bright feature, low frequency VLBI observations show a continuation of the jet to about 100 mas (e.g., Taylor & Vermeulen 1996; Silver, Taylor, & Vermeulen 1998, hereafter STV; this paper). STV also see a “millihalo” approximately 250 mas in size at 330 MHz. On scales of arcseconds and larger, 3C 84 has weak, somewhat asymmetric twin jet structure surrounded by a diffuse halo (Pedlar et al. 1990; Sijbring 1993).
In 1993, a feature extending to about 8 mas north of the compact core was discovered with the VLBA at 8.4 GHz by WRB and independently, using 1991 Global VLBI Network data at 22 GHz, by Vermeulen, Readhead, and Backer (1994, hereafter VRB). At 22 GHz, this feature was similar to, but smaller and somewhat weaker than the bright southern feature. It most likely is related to a jet on the far side of the AGN corresponding to the near side jet responsible for the southern feature. This source provides an especially favorable case for relating jet and counterjet features because of the dramatic changes in jet brightness dating to the 1959 outburst. WRB show that the ratio of distances to the ends of the bright emission in the north and south, the brightness ratio of the features at 22 GHz, and the measured speed of the southern feature, are consistent with a mildly relativistic jet ( to ) at a moderate angle ( to ) to the line-of-sight.
The most exciting result of WRB and VRB was the observation that the northern feature has a strongly inverted spectral index. It was very much brighter at 22 GHz than at 8.4 GHz, and it had not been seen at all in high dynamic range images of Biretta et al. (1991) at 1.7 GHz. But the 22 and 8.4 GHz observations were separated in time by about 2 years so there was some potential for confusion due to time dependent effects. VRB present persuasive arguments that the spectral index, if confirmed, is most likely the result of free-free absorption by ionized material along the line-of-sight to the northern feature. This absorbing material must be located in the inner few parsecs of the source — otherwise it is highly unlikely that it would absorb only the northern feature leaving the core and southern feature unaffected. An obvious geometry consistent with the data puts the ionized gas in, or associated with, a disk. Levinson, Laor, and Vermeulen (1995, hereafter LLV) discuss models involving accretion disks at some length. One problem is that, according to simple theory, the accretion disk should be too cold at parsec distances to contain ionized gas. They address a variety of mechanisms that would allow ionizing radiation from the central regions of the AGN to reach the outer disk and create an ionized atmosphere adequate to explain the observed absorption.
Apparent free-free absorption is also seen in this source at lower frequencies. O’Dea, Dent, and Balonek (1984) deduce, from flux density monitoring data, that the variable core component is absorbed below about 2.2 GHz. They suggest that the absorbing gas has a thickness of pc, K, and cm-3. More recently, STV found a feature 80 mas north of the core in 330, 612, and 1414 MHz VLBA observations that presumably corresponds to an earlier epoch of activity. The spectrum of this feature can be interpreted in terms of free-free absorption on a much larger scale.
Evidence for free-free absorption on parsec scales has been seen in a few other sources. Jones et al. (1996) find preferential absorption of counterjet emission in Cen A, indicating a geometry similar to what is seen in 3C 84. Jones and Wehrle (1997) see a feature in NGC 4261 that is possibly due to absorption by an inner accretion disk with a width of less than 0.1 pc, but they do not have spectral information on this feature. Kellermann, Vermeulen, Cohen, and Zensus (1999) report the presence of free-free absorption of the nucleus and receding jet in NGC 1052, with the absorption moving to lower frequencies over scales from 15 light days to more than 3 light years. Taylor (1996) attributes the spectral turnover seen in the parsec scale jet components in Hydra A to free-free absorption over the entire central region, probably due to gas on a somewhat larger scale. Parsec scale ionized gas associated with a disk may have been observed directly in NGC1068 by Gallimore, Baum, & O’Dea (1997). The inferred temperature of the observed region is around K. But the case that this is ionized disk gas, rather than a jet, is not firmly established.
Ulvestad, Wrobel, & Carilli (1999) report evidence for absorption in Markarian 231, a powerful Seyfert 1/starburst galaxy at whose compact emission regions look remarkably similar to 3C 84. In both magnitude and physical scale, the observed absorption in Mrk 231 is more comparable to that observed in 3C 84 by STV than that reported in this paper. Unlike 3C 84, a spectral gradient is reported for the southern feature, implying some absorption over the whole source. But this may be a result of alignment of the images on the core. At least in 3C 84, the centroid of the core shifts with frequency. Also, the 1.4 GHz image shows emission well north of any seen at higher frequencies, implying unphysically steep spectral indices or some imaging effect such as much greater sensitivity to large structures at 1.4 GHz than at the other frequencies.
In this paper, we present results of the first two epochs of observations of 3C 84 designed to study the absorption and its two dimensional distribution. The observations were made with the Very Long Baseline Array of the National Radio Astronomy Observatory, supplemented in some cases by a single antenna of the Very Large Array (VLA). At each epoch, a wide range of frequencies were observed, all within a period short enough to preclude uncertainties due to variability. High dynamic range images, all convolved to the same resolution, allow us to image the absorption over the extent of the northern feature.
The first, and simplest, result is that the apparent absorption is not due to temporal changes in the source. The quasi-instantaneous radio spectra at positions on the northern feature are consistent with free-free absorption. Minor deviations from a theoretical free-free spectrum are probably due to inhomogeneities in the medium. We show that the dominant spatial structure of the absorption is a strong decrease with radial distance from the central feature. The concept that the ionized gas is associated with the accretion disk and falls off in density from the center is consistent with the observations.
At km s-1, pc, where km s-1Mpc-1. In this paper, we assume that , so the scale of the images is very close to .
2 The Observations
Observations of 3C84 were made with the VLBA in 1995 January and October at 2.3, 5.0, 8.4, 15.4, 22, and 43 GHz. The specific dates are listed in Table 1. The observations were spread over several days at each epoch in order to gather sufficient data at each frequency to make high dynamic range images. However all observations for each epoch were confined to a period of two weeks in order to avoid confusion by possible time variations. A single antenna of the VLA was included in the 22 and 43 GHz observations in October in order to enhance the coverage of short baselines. The day following the last of our October observations, 3C 84 was observed at 0.33, 0.61, and 1.4 GHz by STV. Therefore near simultaneous observations of this source in 1995 October are available at all bands for which the VLBA has receivers.
| Date | Frequency | Antennas | Bit Rate | Polarization | Baseline |
|---|---|---|---|---|---|
| (1995) | (GHz) | (Mbps) | Hours | ||
| Jan 15 | 22.2 | VLBA | 64 | dual | 384 |
| Jan 22 | 2.3 aaBand switching was used to observe 2.3, 5.0, and 8.4 GHz on the same day. bbDichroic system used to observe 2.3 and 8.4 GHz simultaneously on Jan. 22. | VLBA ccOnly 9 of the 10 VLBA antennas participated. | 32 | dual | 159 |
| 5.0 | VLBA ccOnly 9 of the 10 VLBA antennas participated. | 64 | dual | 88 | |
| 8.4 bbDichroic system used to observe 2.3 and 8.4 GHz simultaneously on Jan. 22. | VLBA ccOnly 9 of the 10 VLBA antennas participated. | 32 | dual | 158 | |
| Jan 29 | 15.3 | VLBA | 64 | LCP | 249 |
| Jan 30 | 43.2 | VLBA | 128 | LCP | 399 |
| Oct 09 | 15.3 | VLBA | 128 | dual | 174 |
| Oct 16 ddData not used for this paper, but listed for completeness. | 43.2 | VLBA+VLA eeIncluded one antenna only of the VLA. | 128 | LCP | |
| Oct 21 | 22.2 | VLBA+VLA eeIncluded one antenna only of the VLA. | 128 | dual | 244 |
| Oct 22 | 2.3 aaBand switching was used to observe 2.3, 5.0, and 8.4 GHz on the same day. | VLBA | 64 | dual | 44 |
| 5.0 | VLBA | 64 | dual | 116 | |
| 8.4 | VLBA | 64 | dual | 135 | |
| Oct 23 ddData not used for this paper, but listed for completeness. ffIndependent but related project (Silver, Taylor, & Vermeulen 1998). | 0.3, 0.6, 1.4 | VLBA | 64 | dual |
The northern feature seen at higher frequencies about 8 mas from the core was not detectable at 2.3 GHz to a limit of about 2 mJy beam-1 in both January and October, presumably because it is too heavily absorbed. Also the much more distant northern feature, at about 80 mas, that was reported by STV at low frequencies, was not seen in our 2.3 GHz images, perhaps because of inadequate short baselines. The convolved images used to look for the distant features have off source noise levels of about 1.5 mJy beam-1 with beams of 19 by 15 mas. At 43 GHz the the feature 8 mas north of the core was detected, but most of the flux density appears to be missing. This feature is several mas in size, which is a size scale that falls in the range that is poorly measured at 43 GHz because of the gap in (u,v) coverage between the VLBA and the VLA. The feature is mostly resolved out on the VLBA, but is still a point source to the VLA. Therefore the results presented here will be based almost entirely on the 5.0, 8.4, 15.4, and 22 GHz images, although we show the 2.3 GHz images and one 43 GHz image.
Details of the observations are presented in Table 1. The columns are the date within 1995, the antennas included, the bit rate, the polarizations recorded, and the number of effective baseline hours of data available for the final image. The total recorded bit rate was divided among 2, 4, or 8 baseband channels. The baseline hours listed is simply the integration time times the number of visibility records. The 2.3, 5.0, and 8.4 GHz observations were performed by band switching during a single day in both January and October. In January, but not in October, the 2.3 and 8.4 GHz data were obtained simultaneously using the VLBA’s dichroic system.
Apriori amplitude calibration was done in the usual way using the system temperatures measured during the observations and gains measured by the NRAO staff during pointing observations. Most of the data were processed with AIPS. The 22 GHz image from January was made using DIFMAP (Shepherd, Pearson, & Taylor 1994). On 1995 October 20, VLA observations were made of 3C 84 and the compact source DA 193 (0552+398) to obtain flux densities. These were used to check and adjust the apriori amplitude calibration of the VLBA. Adjustments in the amplitude scales by factors of 1.00, 0.91, 1.00, 0.95 for 22, 15.4, 8.4, and 5.0 GHz were made as a result. The remaining uncertainty in the flux scale is roughly estimated to be about 5% for the October data. For January, the apriori calibration had to be trusted and there may be residual errors at the 10% level. The 2.3 GHz amplitudes from January were scaled by 0.87 to adjust for the effects of an inappropriate off-source position used in VLBA 2.3/8.4 GHz dual frequency gain measurements prior to 1997 November.
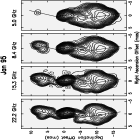
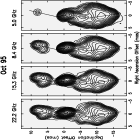
Montages of the contour plots of the images used in the analysis are shown in Figures 1 and 2. All images are convolved to a beam of 1.6 by 1.2 mas, elongated in position angle 0 degrees. This is about the actual resolution of the 5 GHz images, but represents a considerable smoothing of the higher frequency images. On each contour plot, a segmented line is shown which marks the slice used for some of the analysis below.

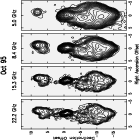
Contour plots of the 2.3 GHz images are shown in Figure 3. The resolution of these images is lower than for the others because of the lower frequency. These images show the southern feature well and make it clear that there is a weak, underlying structure extending well beyond the region of the features that resulted from the 1959 outburst. Those underlying structures are also seen weakly in the 5 GHz images, although only when plotted to deeper levels than were used in Figures 1 and 2. The northern feature is absent, presumably completely absorbed. In the 1995 October image at 22 GHz, the ratio of integrated flux density in the northern and southern features is about 3.7. In the 2.3 GHz image from the same epoch, the integrated flux density of the southern feature is about 21 Jy. If the intrinsic spectral index (without absorption) of the northern and southern features is the same, the expected flux density of the northern feature at 2.3 GHz would be 5.7 Jy. Instead it is below about 2 mJy, so there is very strong absorption — corresponding to an optical depth of at least 7.9. At 5 GHz, the northern feature had an integrated flux density of about 20 mJy in January and 34 mJy in October in a region smaller than the 2.3 GHz beam. Thus the observed spectral index between 2.3 and 5.0 GHz was at least 2.9 in January and 3.6 in October. While we do not use this information in the following analysis, it further supports the interpretation of the spectra as being due to the exponential cutoff resulting from free-free absorption toward the northern feature.

An image based on the 43 GHz VLBA data from Jan. 1995 is shown in Figure 4. The image has been convolved to the same beam used in the analysis of the 5 to 22 GHz images. The northern and southern features are clearly there, but at much reduced flux densities because of the lack of baselines of a few tens to a few hundred km. Because of this missing flux density, this image cannot be used in the analysis. For more on VLBA monitoring of the 43 GHz structure of this source, see Dhawan, Kellermann, and Romney (1998).
For background information, full resolution images of the source in 1995 October are shown in Figure 5. The analysis in this paper will be based entirely on the images convolved to the resolution of the 5 GHz images. At higher resolutions, imaging artifacts, that are not readily visible in the total intensity images, become apparent in spectral index images and in the absorption analysis, which are based essentially on differences. These artifacts are the result of the inadequate (u,v) coverage of the VLBA at high frequencies for a source of this complexity and size. Future observations will include additional antennas to address this difficulty. The 22 GHz image was not made with the instrument’s full resolution, knowing that it was to be convolved to the lower resolution of the lower frequency observations. Note that the 5 GHz image, with contour levels that are deeper than those of Figure 2, shows the beginning of the extension, beyond 15 mas south of the core, that is seen at 2.3 GHz.
3 Analysis
The jet speed and angle results of WRB are based on the measured length ratio of the northern and southern features, on the long term expansion rate of the southern feature, and on the assumption that the northern and southern features both originated in the outburst of about 1959, so they have the same age. The 1995 data do not change the numbers. But the flux density ratio of the northern and southern features at 22 GHz was 9 in the data from VRB, used by WRB. In the 1995 October 22 GHz image, the ratio is about 3.7. The difference might be the result of the better coverage of short interferometer baselines in the 1995 data, or it might be the result of real changes in either the emission in the source or in the absorbing screen suggested by VRB and discussed below. By the beamed jet model of Blandford and Königl (1979), the flux density ratio and length ratio are related by . The index is either or , where is the spectral index (), for a continuous jet or a single component respectively. The data of VRB give , which is consistent with the single component model and the spectral index observed in the southern feature. The 1995 data give , which does not fit the simple model so well. Even with the continuous jet model, the spectral index would have to be flatter than is observed in the southern feature. But the flux density of the source has been decreasing with time for many years. In any one image, the northern feature is observed at an earlier time in its history than the southern feature because of light travel time effects — about 22 years earlier for the geometry of WRB and our assumed Hubble constant. In the early to mid 1970’s, the integrated flux density of 3C 84 at 22 GHz was roughly twice the the 1995 value (Nesterov, Lyuty, & Valtaoja 1995). Therefore, while the distribution of the emission at 22 GHz in the 1970’s is not known, it is reasonable that the northern feature would be stronger ( lower) than would be expected by the simple, no-evolution beaming model.
The southern feature has a fairly uniform spectral index of , a value rather typical of radio jets and hot spots in lobes. The northern feature is entirely different. It is far stronger at high frequencies and has spectral indices that vary both spatially and with frequency and that get as high as . Even with less data, VRB argued that the steeply inverted spectral index, along with the extended size of the feature, effectively rules out other explanations than free-free absorption. Below we characterize and discuss this absorption. The core region also has an inverted spectrum and may be subject to some free-free absorption. However that spectrum could also simply be due to synchrotron self-absorption in the most compact regions of the jets. Therefore we do not include the core region in our discussion of free-free absorption.
Most of the analysis for this study was done with a special purpose program that operates on the CLEAN components from the AIPS images. Very deep CLEANs were done, so essentially all of the flux density is represented in the CLEAN components. The program is used to shift the components to align the images, make any required final amplitude calibration adjustments, convolve the components with a Gaussian beam roughly equivalent to the resolution of the lowest frequency image, and fit for the absorption. The fits are done both in the image plane and for points along a segmented slice as shown in Figures 1 and 2.
In order to image the absorption, it is necessary to align the images at different frequencies very accurately. Because of the presence of steep emission gradients, relative shifts of as small as 20 microarcseconds (as) make small, but perceptible, changes in the distribution of the absorption. An alignment to that level of accuracy is desirable, but VLBI observations that don’t utilize phase referencing retain no absolute position information. These observations were scheduled with occasional short scans on the nearby calibrator 0309+411. Positions accurate to about a 1 mas could probably be obtained with the aid of these scans. But to obtain positions to 20 as would require dual frequency observations to remove the effects of the ionosphere and scans all over the sky to calibrate the troposphere.
It is possible to use the source itself, in the case of 3C 84, to align the images very accurately. This requires the assumption that the southern feature is similar in structure at all frequencies — that there aren’t large variations in observed spectral index. This assumption is supported by the images. The images could be aligned by finding the relative positions that minimize spectral index gradients. But a method that is at least as effective, and easier to automate, is to utilize the image cross correlation techniques previously developed for use on VLA data on 3C120 and M87 (Walker 1997 and references therein). The idea is to find the peak, as a function of position offset, of the cross correlation of portions of two images. For comparison, the software also does a least squares fit for the position offset of the image portions, generally obtaining similar results. For 3C 84, the regions greater than 5 mas south of the core were cross-correlated for all 6 possible pairs of images at each epoch. The images were shifted so as to minimize the offsets determined by the cross correlations. The 6 pairs over determine the problem, so the scatter of the results gives a crude estimate of the accuracy of the method. For each epoch, an alignment was found for which all reported offsets in RA and Dec were less than 5 as, easily meeting our requirements. With these alignments, the uniformity of spectral indices was better than had been achieved previously with a tedious, non-automated procedure based directly on the spectral indices.
With alignment nominally accurate to a few microarcseconds, the internal motions of the source start to be a concern. Historically, the southern lobe is moving way from the core at about 0.3 mas yr-1. The counterjet would be expected to be moving at some fraction of that speed, probably lower by the length ratio of about 1.8. Thus we expect relative motions of jet and counterjet at the level of about 1.3 as per day. The January observing sequence spanned 15 days and the October sequence spanned 13 days, so relative motions of up to 19 as are expected. This has very little effect on the final results. Nevertheless an attempt has been made to account for it by moving the features more than 2 mas north of the core by an appropriate amount, depending on observing date relative to the day of the 5 and 8.4 GHz observing. Rather than having an abrupt transition between the shifted and unshifted components, the region between -3.6 mas and +2 mas north of the core was stretched linearly. These distances are in proportion to the jet/counterjet length ratio.
The analysis program is capable of doing simultaneous fits for 22 GHz amplitude (), emitted spectral index (), absorption, and a covering factor (), all as a function of position. The equation of the fit is:
| (1) |
where is the flux density measured at frequency (Hz), and is the absorption coefficient, which is the main item of interest. The absorption is given by:
| (2) |
where is the path length through the absorbing medium in parsecs, is the electron density in cm-3, is the temperature in degrees K, and the terms in the square brackets are the Gaunt factor. The fits for absorption were actually done for the combination of parameters (), where is the temperature in units of K and is the ratio of the Gaunt factor to the Gaunt factor for K. Note that is simply the emission measure (EM), so for the case of a K constant temperature medium, the fit is simply for the emission measure.
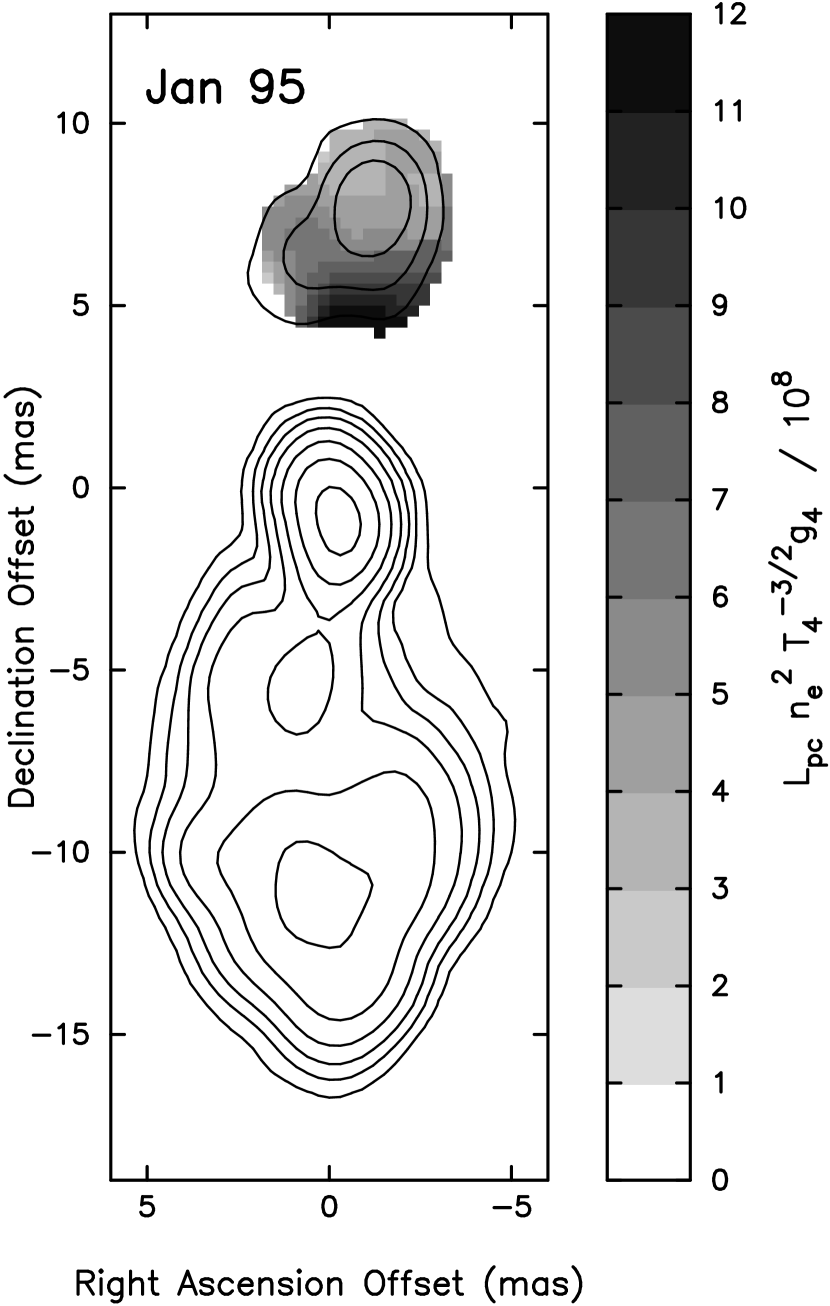
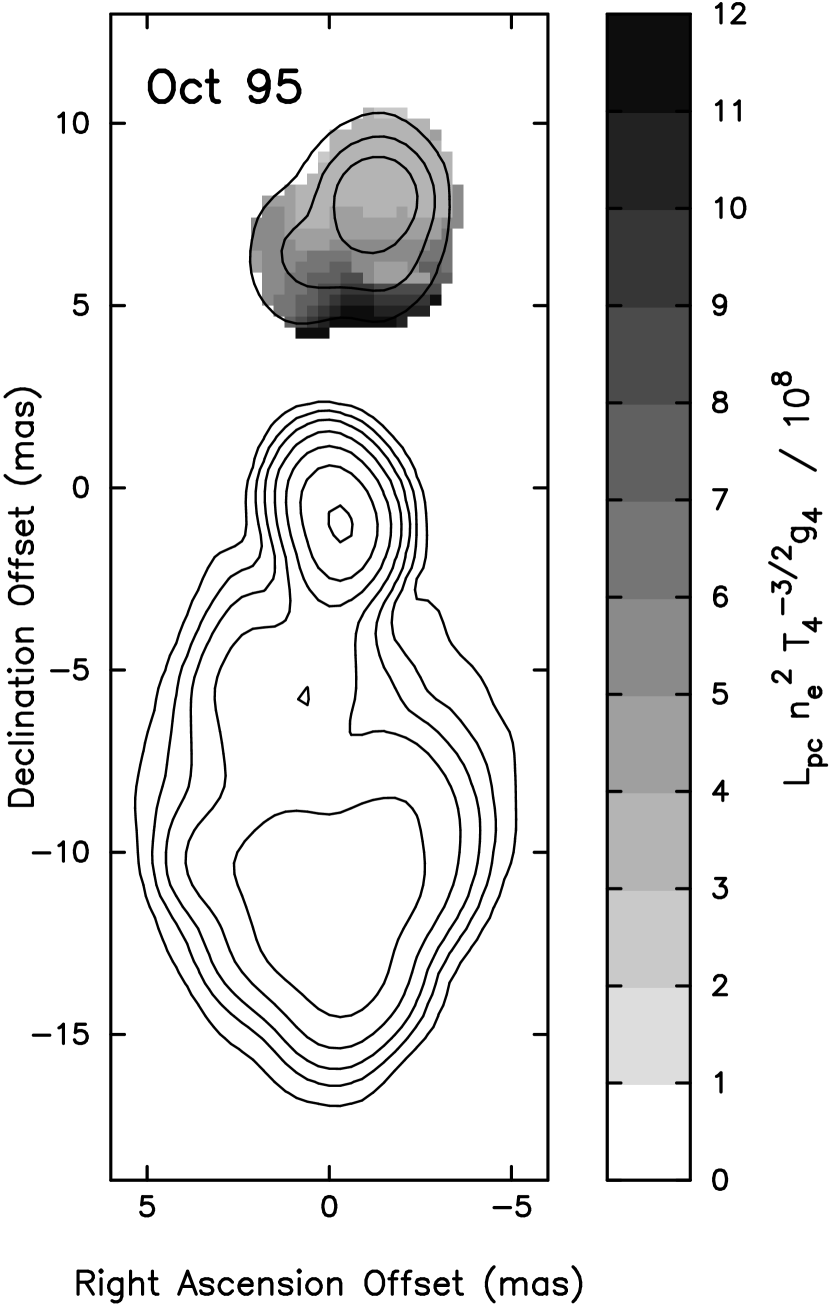
The above parameterization has 4 unknowns. The observations reported here have 4 frequencies, and so have a maximum of 4 measurements at any point in the image or along the slice — sometimes fewer. Fitting for all 4 parameters was not really justified. After some experimentation, it was decided to fit only for and along the southern feature, setting . On the northern feature, the subtle variations in emitted spectral index are overwhelmed by the strong absorption, so the fits were done for and absorption with and . The results for the fits along the slice are shown in Figures 6 and 7. The results for the absorption as a function of position in the image are shown as the gray scales in Figures 8 and 9.


The quality of the fits is best assessed in Figures 6 and 7. In those figures, the top panel shows the results for and absorption along the slice, in terms of radial distance from the core. The amplitudes from the 22 GHz slice are also shown for orientation. The lower panel shows the amplitudes from all 4 frequencies as lines and the fitted model amplitudes as crosses. Note the logarithmic scale and the very deep absorption, especially at 5 GHz. The fits are not perfect, in the sense that the absorption is not actually quite as sharp as for free-free absorption in a uniform medium. Better, even near perfect, fits can be obtained by releasing either or . Fitting for gives spectral indices that are close to zero, which is significantly different from what is seen in the southern jet. We do not consider this to be very likely. Fitting for gives values in the range 0.98-0.995 — allowing less than 2% of the light to pass unabsorbed would give a near perfect fit. Probably more likely is that there are variations in the absorption over each beam area that account for the slightly flatter than a pure free-free spectrum. A detailed model has not been attempted and almost surely would not be unique.
We are assuming that the origin of the jets, presumably in the vicinity of a massive black hole, is located at the northern end of the bright, compact regions seen at high frequency (Dhawan, Kellermann, and Romney 1998). We believe that this is consistent with the structures seen in our images, including the absence of any compact features farther north in the high resolution versions of the 43 GHz images. But we cannot completely exclude the possibility that the true base of the jets is significantly north of this point as suggested by Nesterov, Lyuty, & Valtaoja (1995) based on time lags between optical and radio variations. If the core is displaced northwards, the lack of strong radio emission at its location could be because the radio emission has not turned on in the inner jet, as suggested by Nesterov, Lyuty, & Valtoaja, or because those inner regions are absorbed. The latter could be consistent with the fact that we do see structures in that region at the high frequencies, but not at lower frequencies, and with the possibility that the inverted spectrum in the region we call the core is due to absorption. A displaced core does not strongly affect the conclusions of this paper, but would affect the parameterization of the radial gradient of absorption. It would also affect the geometry derivation of WRB in the sense that the jets would lie closer to the line-of-sight and the simple relativistic beaming model would not work quite as well.
Our fit results show that the absorption has a strong gradient away from the core. This is seen clearly in the slices of Figures 6 and 7 and in the gray scale images of Figures 8 and 9. An attempt to characterize this gradient was made using the slice results by fitting a power law in , the core distance in units of 2.5 pc. This reference distance was chosen so that the constant in the equation corresponds to the value at about the middle of the northern feature. The results are displayed on Figures 6 and 7. They are:
| (3) |
in January and
| (4) |
in October. The power law is clearly only a rough description of the results. The formal fit errors for the exponent are less than 0.1. But it is clear that there are large deviations from any power law, so the value of the exponent should not be taken too seriously. A wider range of core distances would be useful for any characterization of the gradient.
The feature (NN), seen at about 80 mas north of the core at low frequencies by STV, also has a peaked spectrum that STV conclude is the result of free-free absorption. For this feature, the absorption is much weaker since it occurs at a much lower frequency. The simple power laws fit to our higher frequency data in the region less than 10 mas from the core, if extrapolated to the more distant feature, would give far too much absorption. If the power law characterization is reasonable, the exponent must be in the vicinity of the determined by STV. But a power law with a exponent is not very consistent with our data in the 4 to 10 mas range. It is likely that the amount of ionized gas eventually falls off faster between 10 and 80 mas (3.2 and 26 pc) than it does over the 4 to 10 mas (1.3 to 3.2 pc) range over which we measure it. In fact, the existence of structure even closer to the core at 15 and 22 GHz (see Figure 5) suggests that the absorption does not continue to increase as fast with decreasing core distance inside the region of our measurements as it does further out.
4 Discussion
The current data provide more frequencies than were available for previous discussions of the spectrum of the northern feature and provide measurements of all frequencies taken at approximately the same time, so that time variability should not be a source of uncertainty. Based on the earlier 8.4 and 22 GHz data, with a 2 year separation, VRB and LLV argue that the inverted spectrum of the northern feature is not synchrotron self-absorption on the grounds that, given the spectrum and the size of the feature, the magnetic field energy density would have to be greater than the particle energy density by a factor of , which is unlikely. Also the total energy content of the jet with the implied magnetic field would be unreasonably high. The current measurements provide a rather simpler argument. The observed spectral index on the northern feature between 5.0 and 8.4 GHz is about . This is significantly steeper than the optically thick synchrotron spectral index of 2.5. Therefore, synchrotron self-absorption cannot be the only cause of the inverted spectrum. LLV also consider stimulated Raman scattering as the cause of the inverted spectrum, but rule it out on the grounds that the brightness temperature is inadequate. That argument remains unchanged. The Razin-Tsytovich effect, which exponentially suppresses synchrotron radiation at frequencies below those where the phase velocity is greater than c, can cause a steeply inverted spectrum below Hz. But with only in the exponent, compared to the of free-free absorption, it cannot produce the change from about , seen between 15 and 22 GHz, to about , seen between 5.0 and 8.4 GHz, without an unphysically steep underlying emitted spectral index. Also, the Razin-Tsytovich effect operates in the emitting region rather than along the line-of-sight, so it is difficult to understand why there would be a very big difference between the northern and southern features. Free-free absorption, on the other hand, fits the spectra reasonably well, and, to the extent that there are deviations, they are what might be expected from non-uniformities in the medium, something that is reasonable to expect.
The opacity fits presented above give an emission measure of about at 2.5 pc with a fairly steep radial gradient, assuming a temperature of K. The path through the absorbing medium cannot be significantly larger than the projected distance of the line-of-sight from the core. In fact, if the geometry were that of a thin disk, the path would be significantly smaller than the projected offset. The density of ionized gas required is roughly cm-3 for a thick (1 pc) medium at K, rising to significantly higher values for a thinner medium or a higher temperature.
LLV point out that the Thomson optical depth along the line-of-sight must not significantly exceed unity, constraining the density to be
| (5) |
This density is not all that far from that implied by the free-free absorption measurements. If we insert the inequality of Equation 5 into Equations 3 and 4, we get:
| (6) |
for January and
| (7) |
for October. The fact that is not well constrained leaves room for a fairly wide range of temperature limits. But for values of between 0.01 and 1, the temperature at 2.5 pc cannot exceed between about and respectively in October and slightly less in January. These limits don’t really cause any problems for models that we are aware of, but it is clear that the temperature cannot greatly exceed the K called for in some cases (eg. Königl and Kartje 1994; Gallimore, Baum, & O’Dea 1997)
The region where free-free absorption is observed is a few parsecs from the central object in NGC 1275. LLV estimate the bolometric luminosity to be about ergs s-1, which is about the Eddington luminosity for a black hole. If that is the mass of the central object, a location 2.5 pc away is at roughly (The gravitational radius ). On the other hand, the same location would only be about from a black hole. These distances are in the outer regions typically covered in accretion disk models, if not well beyond. In such regions, models are complicated by the possible importance of self gravity and of external illumination of unknown geometry. The temperature at these distances is expected to be too low for ionization without illumination by ionizing radiation from the central regions. Such illumination requires an appropriate geometry such as a flaring or warped disk or a source of radiation offset from the disk center, possibly from a jet or from scattering. LLV give an extensive discussion of the implications for disk models of the observation of free-free absorption in NGC 1275 — a discussion that is not significantly changed by the new data.
The idea that AGN disks are likely to be illuminated by ionizing radiation from the central compact region near the black hole has been explored as part of efforts to model the spectra of broad line regions and the structure of outer disks (see Collin and Huré 1999 and references therein including Collin-Souffrin & Dumont 1990). Generally the density of the outer disk is expected to be much higher than implied by the free-free absorption. However, much of the disk is sufficiently optically thick that the central regions are shielded from ionizing radiation. These regions will be neutral and will not contribute to the free-free absorption or to many of the observed optical emission lines. But there is likely to be an ionized “chromosphere” above the dense regions. At large radii, the density is too low to provide shielding and the disk is fully ionized and at a temperature of about 7000 K. This chromosphere, or the ionized regions at large distances, could be the absorbing region.
An alternative to the irradiated disk for the location of the ionized material responsible for the free-free absorption might be a wind off the surface of the disk. For example, Königl and Kartje (1994 — see also other references therein) discuss the properties of centrifugally driven winds in the AGN context. Winds of this type are the leading model for the origin of the bipolar outflows that are very common in young stellar objects. They seem likely to exist whenever a disk is threaded by magnetic fields — a situation that is probably hard to avoid. The temperatures and densities of some of the examples presented in Königl and Kartje are of the magnitude required by our data.
It seems likely that both of the above scenarios apply in an AGN. The central regions are a strong source of ionizing radiation which is very likely to affect some portion of the disk. And, given the almost certain presence of magnetic fields in any accretion disk, combined with the ubiquitous presence of magnetically driven winds from galactic examples of accretion disks, it seems hard to avoid having a magnetically driven wind. There is a considerable range of possible variations on these models, depending on the black hole mass, the accretion rate, the disk composition, the magnetic field strength, and other factors, so a variety of types of data will be required to determine anything like a unique model. Because of the large range of possible models, we have not attempted detailed comparisons with any specific models. But our data do provide some firm constraints that any model must match. We are attempting to obtain additional constraints by making multi-frequency observations that can be used at higher resolution than those presented here. Such observations will also be sensitive to temporal variations in the absorption since 1995. In addition, we are searching for recombination lines from the absorbing medium.
5 Conclusions
The primary conclusions of this work are:
-
•
The suggestion from VRB and WRB, based on two frequencies and observations separated by 2 years, that there is free-free absorption of the northern feature in 3C 84 at a few parsecs from the central object, is confirmed. We present two separate epochs in which the absorption was observed nearly simultaneously at 5 frequencies. The observed spectral indices are sufficiently steep to preclude other absorption mechanisms.
-
•
The free-free absorption shows a two dimensional structure dominated by a gradient with distance from the radio core. The absorption is greater near the core and falls off with distance. If the absorption goes as a power law with distance, the exponent is a bit above over the range of the observations presented here (about 1.5 to 3.5 pc projected distance from the core). However a somewhat steeper exponent is required to match up with the observations of STV at around 25 pc. Those observations were taken at the same time as ours.
-
•
The observed absorption is consistent with the model proposed by WRB and VRB. In that model, the northern feature is on the far side of the system relative to the Earth. There is an accretion disk extending to the parsec scales observed here and that accretion disk has associated ionized gas that is responsible for the absorption. The amount of ionized gas falls off fairly rapidly with core distance.
Various models, including disk ionization by radiation from the central regions and disk-driven hydromagnetic winds, might provide the necessary ionized material in a geometry that would only affect the far-side jet. The free-free absorption results provide firm constraints on the ionized gas on parsec scales, including positional information, that any model of the central regions of NGC 1275 must match.
References
- (1)
- (2) Allen, S. W., & Fabian, A. C. 1997, MNRAS, 286, 583
- (3)
- (4) Biretta, J. A., Bartel, N., & Deng, J. 1991, in IAU Coll. 131, Radio Interferometery: Theory, Techniques, and Applications, eds. T. J. Cornwell & R. A. Perley (San Francisco: Astronomical Society of the Pacific), ASP Conference Series, Vol. 19, 334
- (5)
- (6) Blandford, R. D. & Königl, A. 1979, ApJ, 334, 560
- (7)
- (8) Brodie, J. P., Schroder, L. L., Huchra, J. P., Phillips, A. C., Kissler-Patig, M., & Forbes, D. A. 1998, AJ, 116, 691
- (9)
- (10) Carlson, M. N. et al. 1998, AJ, 115, 1778
- (11)
- (12) Collin-Souffrin, S. & Dumont, A. M. 1990, A&A, 229, 292.
- (13)
- (14) Collin, S. & Huré, J.M. 1999, A&A, 341, 385.
- (15)
- (16) Dent, W. A. 1966, ApJ, 144, 843
- (17)
- (18) DeYoung, D. S., Roberts, M. S., and Saslaw, W, C. 1973, ApJ, 185, 809.
- (19)
- (20) Dhawan, V., Kellermann, K. I., & Romney, J. D. 1998, ApJ, 498, L111
- (21)
- (22) Gallimore, J. F., Baum, S. A., and O’Dea, C. P. 1997, Nature, 388, 852
- (23)
- (24) Jones, D. L. et al. 1996, ApJ, 466, L63
- (25)
- (26) Jones, D. L. & Wehrle, A. E. 1997, ApJ, 484, 186
- (27)
- (28) Kaisler, D., Harris, W. E., Crabtree, D. R., & Richer, H. B. 1996, AJ, 111, 2224
- (29)
- (30) Kellermann, K. I., Vermeulen, R. C., Cohen, M. H., and Zensus, J. A. 1999, BAAS, 31, 856
- (31)
- (32) Königl, A. & Kartje, J. F. 1994, ApJ, 434, 446
- (33)
- (34) Krichbaum, T. P., Witzel, A., Graham, D. A., Schalinski, C. J., & Zensus, J. A. 1993, in Sub-arcsecond Radio Astronomy, eds. R. J. Davis & R. S. Booth (Cambridge: Cambridge University Press), p. 181
- (35)
- (36) Lazareff, B., Castets, A, Kim, D.-W., & Jura, M. 1989, ApJ, 336, L13
- (37)
- (38) Levinson, A., Laor, A., & Vermeulen, R. C. 1995, ApJ, 448, 589
- (39)
- (40) Marr, J. M., Backer, D. C., Wright, M. C. H., Readhead, A. C. S., & Moore, R 1989 ApJ, 337, 671
- (41)
- (42) Minkowski, R. 1957, in IAU Symposium No. 4, Radio Astronomy, ed. H. C. van de Hulst (Cambridge: Cambridge University Press), p. 107
- (43)
- (44) Napier, P. J., Bagri, D. S., Clark, B. G., Rogers, A. E. E., Romney, J. D., Thompson, A. R., & Walker, R. C. 1994, Proc. IEEE, 82, 658
- (45)
- (46) Nesterov, N. S., Lyuty, V. M., & Valtaoja, E. 1995, A&A, 296, 628
- (47)
- (48) Nørgaard-Nielsen, H. U., Goudfrooij, P., Jørgensen, H. E., & Hansen, L. 1993, A&A, 279, 61
- (49)
- (50) O’Dea, C. P., Dent, W. A., Balonek, T. J. 1984, ApJ, 278, 89
- (51)
- (52) Pauliny-Toth, I. I. K. & Kellermann, K. I. 1966, ApJ, 146, 634
- (53)
- (54) Pauliny-Toth, I. I. K., et al. 1976, Nature, 259, 17
- (55)
- (56) Pedlar, A., Ghataure, H. S., Davies, R. D., Harrison, B. A., Perley, R., Crane, P. C., & Unger, S. W. 1990, MNRAS, 246, 477
- (57)
- (58) Readhead, A. C. S., Hough, D. H., Ewing, M. S., Walker, R. C., & Romney, J. D. 1983, ApJ, 265, 107
- (59)
- (60) Romney, J. D. 1978, Ph. D. thesis at the California Institute of Technology
- (61)
- (62) Romney, J. D., Alef, W., Pauliny-Toth, I. I. K., Preuss, E., & Kellermann, K. I. 1982, in IAU Symposium no. 97: Extragalactic Radio Sources, eds. D. S. Heeschen & C. M. Wade (Dordrecht: Reidel) p. 291.
- (63)
- (64) Romney, J. D., Alef, W., Pauliny-Toth, I. I. K., Preuss, E., & Kellermann, K. I. 1984, in IAU Symposium No. 110: VLBI and Compact Radio Sources, eds. R. Fanti, K. Kellermann, & G. Setti (Dordrecht: D. Reidel Publishing Company), p. 137
- (65)
- (66) Romney, J. D., Kellermann, K. I., & Alef, W. 1999 in preparation
- (67)
- (68) Shakura, N.I. & Sunyaev, R. A. 1973, A&A, 24, 337
- (69)
- (70) Shepherd, M. C., Pearson, T. J., & Taylor, G. B. 1995, BAAS, 26, 987
- (71)
- (72) Sijbring, L, G. 1993, thesis at the University of Groningen
- (73)
- (74) Silver, C. S., Taylor, G. B., & Vermeulen, R. C. 1998 (STV), ApJ, 502, 229
- (75)
- (76) Taylor, G. B., & Vermeulen, R. C. 1996, ApJ, 457, L69
- (77)
- (78) Ulvestad, J. S., Wrobel, J. M., & Carilli, C. L. 1999, ApJ, 516, 127.
- (79)
- (80) Venturi, T., Readhead, A. C. S., Marr, J. M., and Backer, D. C. 1993, ApJ, 411, 552
- (81)
- (82) Vermeulen, R. C., Readhead, A. C. S., & Backer, D. C. 1994 (VRB), ApJ, 430, L41
- (83)
- (84) Walker, R. C., Romney, J. D., & Benson, J. M. 1994 (WRB), ApJ, 430, L45
- (85)
- (86) Walker, R.C., Romney, J.K., Vermeulen, R.C., Dhawan, V., & Kellermann, K.I. 1996, in Extragalactic Radio Sources; IAU Symposium 175, eds. R. Ekers, C. Fanti, and L. Padrielli (Dordrecht: Kluwer), 30
- (87)
- (88) Walker, R. C. 1997. in Accretion Phenomena and Related Outflows; IAU Colloquium 163, eds. D. T. Wickramasinghe, G. V. Bicknell, and L. Ferrario (San Francisco: Astronomical Society of the Pacific), 591
- (89)
- (90) Walker, R.C. 1997, ApJ, 488, 675
- (91)
- (92) Walker, R. C., Kellermann, K. I., Dhawan, V., Romney, J. D., Benson, J. M., Vermeulen, R. C., & Alef, W. 1998. in Radio Emission from Galactic and Extragalactic Compact Sources; IAU Colloquium 164, eds. J. A. Zensus, G. B. Taylor, and J. M. Wrobel (San Francisco: Astronomical Society of the Pacific), 133
- (93)