A new catalogue of multiple galaxies in the Local Supercluster
Abstract
To reveal small galaxy groups in the Local Supercluster, a new approach is suggested which allows for individual properties of galaxies. The criterion is based on the assumption of closed motions of companions around the dominating group member within a zero velocity sphere.
The criterion is applied to a sample of 6321 nearby galaxies with radial velocities km/s. The 3472 galaxies have been assigned to 839 groups that include 55% of the considered sample. For the groups revealed by the new algorithm (with members) the median velocity dispersion is 86 km/s, the median harmonic radius is 247 kpc, the median crossing time is 0.08(1/H), and the median virial-mass-to-light ratio is .
Special Astrophysical Observatory, Russia
1. Grouping criterion
Over the last years the number of galaxies with known radial velocities has grown greatly. This is true for distant volumes as well for the nearby volume of the Local Supercluster. For instance, the Nearby Galaxies Catalog by Tully (1988) contains 2367 galaxies, whereas last version of the LEDA Database (Paturel et al, 1996) collects about 6900 objects in the same volume of the Local Supercluster. The new observational data give us a ground to consider assignment of nearby groups again.
For selection of small galaxy groups we apply a new percolation algorithm basing on approach supposed by Karachentsev (1994). Unlike in earlier approaches, where individual properties of galaxies were used not enough, we consider pairwise interactions of galaxies and assume the full energy for each physical pair to be negative.
The condition of closed orbits can be expressed as the kinetic and gravitational energy ratio:
| (1) |
where R and V are space linear separation and space velocity difference, is the total mass of the pair, and G is the gravity constant. However, because of projection effects this condition itself does not allow to distinguish false pairs with small radial velocity difference. Therefore, the condition (1) must be adopted with a limitation on the maximum galaxy separation in a pair. Such a natural bound is the “zero-velocity” surface, which separates the collapsing volume against expanding space (Sandage, 1986). In the case of spherical symmetry expansion it can be expressed as:
| (2) |
where H is the Hubble parameter.
It should be noted that both the conditions are conservative with respect to projection factors, i.e. for each real bound pair they remain to be true. On the other hand, the group catalogue may still be polluted by optical pairs.
Our algorithm for group selection is a kind of percolation methods. On the first step it reveals pairs satisfying to the conditions (1) and (2). At the second step all pairs with any common component link together into a group. Finally, if a galaxy turns out to be a companion of several more massive galaxies, then we choose from these combinations the most massive attractor. Particularly, one group can form a subgroup inside more massive one. Therefore, our criterion combines the advantages of a “friends-of-friends” companionship to a hierarchic “dendrogram” approach.
Each galaxy mass can be estimated from its luminosity or amplitude of its rotation curve. We use the first case, because it can be applied to all considered galaxies. We account a mass-to-light relation for different galaxy types. The “total” mass has been derived as
| (3) |
where is a fraction of mass within the standard galaxy radius. According to numerous data on rotational curves of galaxies we assume as an average (Hoffman et al., 1996; Broeils & Rhee, 1997).
2. Application of the criterion
The described algorithm was applied to a sample of galaxies from the LEDA Database (Paturel et al, 1996), updated by the latest observations.
We selected galaxies with radial velocities less than 3000 km/s after correction for the Sun motion with respect to the Local Group centroid. The region of “Zone of Avoidance” in the Milky Way was excluded.
| (4) |
We did not remove the central part of Virgo cluster to check the method efficiency in crowded regions. Finally, 6321 galaxies were collected for analysis, which is 2.5 time their number in catalogue by Tully (1988).
Apparent magnitudes of galaxies were corrected for the Galactic extinction using new IRAS/DERBE map (Schlegel et al, 1998). All other photometric corrections were made following the LEDA manner (Paturel et al, 1996). To correct heliocentric radial velocities we used the apex parameters from Karachentsev & Makarov (1996). The Hubble constant of 70 km/s/Mpc was adopted.
3. Results
The criterion allows to identify 839 galaxy groups of different multiplicity. At total these groups contain 3472 galaxies, i.e. 55 percent of the considered galaxy sample. For different parameters of the groups their median values and quartiles are presented in the table.
k N 2 424 3 158 4 72 5 47 6 27 7 21 185 90 11 all 839
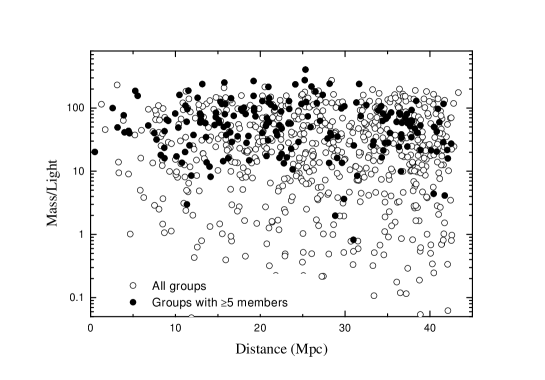
In fact there is no correlation between velocity dispersion and distance to the groups as well between their virial-mass-to-light ratio and group distances (see fig. 1). Therefore, we conclude that our clustering algorithm does not introduce considerable biases to the dynamical parameters of groups with their distance.
![[Uncaptioned image]](/html/astro-ph/9909343/assets/x2.png)
![[Uncaptioned image]](/html/astro-ph/9909343/assets/x3.png)
Figure 2.: Histogram of velocity dispersion. The arrow indicates the
median value of 86 km/s for groups with members.
Figure 3.: Mean harmonic radius. The arrow point out the
median value of kpc for groups with members.
![[Uncaptioned image]](/html/astro-ph/9909343/assets/x4.png)
![[Uncaptioned image]](/html/astro-ph/9909343/assets/x5.png)
Figure 4.: The histogram of crossing time. The median value for the
“rich” groups with members of is indicated
by the arrow.
Figure 5.: Mass-to-light ratio. The median value of 86 km/s
for the large groups with members is indicated by the arrow.
The median velocity dispersion in groups increases with group membership. For groups with it is 86 km/s only, being considerably lower than in the Geller & Huchra (1983) catalog. The maximum value of radial velocity dispersion, 287 km/s, is comparable with the rotational velocity amplitude typical for giant galaxies. The distribution of groups by velocity dispersion is presented in fig. 3.
The median harmonic radius (see fig. 3) for galaxy systems equals to 247 kpc.
The median crossing time for our groups is only , that indicates to the virialized state of many galaxy group (fig. 5).
The virial-mass-to-luminosity ratio grows with number of galaxies in group, and for rich systems with its median is . The derived quantity indicates to existence of moderate amount of dark matter in the groups. The histogram of mass-to-light ratios is presented in fig. 5.
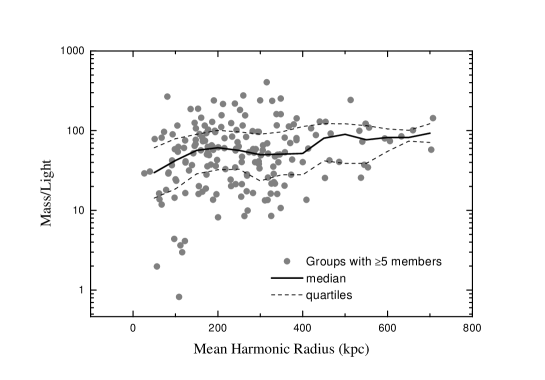
As is seen in fig. 6, there is a tendency of increasing of M/L ratio with harmonic radius of the groups.
Apparently, the proposed algorithm seems to be applied to low dense regions like the Local Group. But, in fact, it allows to distinguish some groups in Virgo cluster. Two groups with population of about 80 members each were selected around the giant galaxies NGC 4486 and NGC 4472. These probable subclusters in the Virgo have been also noted by other authors. However, one should be careful with the parameters of groups selected in the central part of rich clusters, because this method needs more physical ground to be applied to regions of high overdensity.
4. Conclusions
-
•
We propose the algorithm for group selection, which accounts individual galaxy properties in their pairwise interaction and bases on a linkage of galaxies with negative mutual full energy.
-
•
For the assumed value of about 55 percent of the galaxies have been grouped.
-
•
The dynamical parameters of the groups show no dependency on their distance.
-
•
In the rich groups the velocity dispersion is about km/s, which differs considerably from the quantity obtained by Geller & Huchra (1983). The maximum velocity dispersion in the groups reaches 287 km/s.
-
•
The median crossing time is about 0.08 of the Hubble time that points to virialized state of many groups.
-
•
The median virial-mass-to-luminosity ratio is about 56, that shows a presence of moderate amount of dark matter in small galaxy groups.
-
•
The algorithm intend for small group selection, but probably it can be also applied to distinguish substructures in galaxy clusters.
References
Broeils A. H., & Rhee M.-H., 1997, A&A, 324, 877.
Geller M. J., Huchra J. P., 1983, ApJS, 52, 61
Hoffman G. L., Salpeter E. E., Farhat B., Roos T., Williams H., & Helou G., 1996, ApJS, 105, 269
Karachentsev I., 1994, A&Ap Transaction, 6, 1
Karachentsev I. D., Makarov D. I., 1996, AJ, 111, 794
Paturel G., Bottinelli L., Di Nella H. et al., 1996, Catalogue of Principal Galaxies: PGC-ROM 1996, Saint-Genis Laval, Observatoire de Lyon
Sandage A., 1986, ApJ, 307, 1
Schlegel D. J., Finkbeiner D. P., Davis M., 1998, ApJ, 500, 525
Tully R. B., 1988, Nearby Galaxies Catalog, Cambridge, Cambridge Univ. Press