03(11.09.1; 11.09.4; 11.11.1)
Strong non-circular motions of gas in the spiral galaxy NGC 1084 ††thanks: Based on observations collected with the 6m and 1m telescopes of the Special Astrophysical Observatory (SAO) of the Russian Academy of Sciences (RAS), operated under the financial support of the Science Department of Russia (registration number 01-43).
Abstract
The results of and [NII] observations of the spiral galaxy NGC 1084 at the SAO 6m telescope with a Fabry-Perot interferometer are presented. The complex structure of the emission line profile has revealed the presence of giant star formation regions (“spur”) in the NE part of the galaxy. In this region the line shows two distinct components, with line-of-sight velocity differences of . The first component corresponds to normal circular rotation. The second velocity component may be a signature of non-circular motions of the ionized gas in shock wave fronts. An increase of the line ratio confirms the shock wave interpretation of these features. The ionized gas kinematics in this galaxy is discussed.
keywords:
galaxies: individual: NGC 1084 – galaxies: ISM – galaxies: kinematics and dynamics1 Introduction
A velocity field of interstellar gas in spiral galaxies is not only a good indicator of mass distribution and structural properties of their disks, but can also reveal perturbations in diffuse matter related to local sources of energy. Non-circular motions of gas can locally trigger an active star formation, and, in turn, may be the result of the collective action of massive young stars on a short time scale.
Actually, a model of circular gas motion in the disk of any galaxy is no more than a first approximation to the real kinematic picture. Apart from the evident cases of tidal forces or of an active nuclear region (which will not be considered here), responsible for peculiar gas motions, the most common reason of deviation from circular motion is a presence of a spiral density wave or a bar. In these cases, non-circular velocity components have well-ordered systematic character related with the optically observed structure.
However in some galaxies local velocity perturbations exceeding have been discovered, which cover large regions from a few hundred pc up to a few kpc size. Good examples are two regions observed in M 101 in the HI line (van der Hulst & Sancisi [1988]) which show peculiar velocity components reaching , as well as giant HI supershells expanding with velocities of in NGC 4631 ( Rand & van der Hulst [1993]), NGC 1313 (Ryder et al. [1995]) and IC 2574 (Walter et al. [1998]). The typical kinetic energy of perturbed gas motions in these cases is about ergs, and their connection with sites of star formation is obvious. Although in different galaxies the nature of local velocity peculiarities may not be the same, there are two ways to explain it: local bursts of star formation (stellar winds, explosions of supernova or hypernova) or accretion of intergalactic gas clouds and dwarf gas-rich galaxies (see references and discussion in Rand & van der Hulst [1993]).
In this paper we describe the discovery of an extended region of unusual strong non-circular motion of gas in the spiral galaxy NGC 1084 from optical observations in the and [NII] emission lines.
NGC 1084 is a late-type spiral galaxy classified as SA(s)c in the Reference catalog of bright galaxies (RC3). The distance adopted in this paper is 18.5 Mpc (). At first glance, NGC 1084 is a normal galaxy with mildly inclined disk, a regular two-armed grand design spiral structure, and without close optical companions or any morphological peculiarities. The rotation of the gas in this galaxy was measured on several occasions. Burbidge et al. ([1963]) obtained three long-slit spectra in the spectral range near , making two cuts along the major axis and one cut along the minor axis. Yet, the accuracy of their measurements was low, and the obtained velocity curve was unreliable. Kyazumov ([1981]) has performed a long-slit study of NGC 1084. He has obtained improved line-of-sight velocity distributions, although the shape of the rotation curve remains uncertain. The maximum rotation velocity of which he finds, has been confirmed later by Afanasiev et al. ([1988]). These authors have obtained long-slit spectroscopy with a digital detector (IPCS ) at the 6m telescope. The rotation curve of the ionized gas has been of a higher accuracy than previous determination. In particular, it is found that the velocity curve reaches its maximum very close to the center – at a radius of . Two long-slit cross-sections – along the major axis and under an angle of to it – indicate flat velocity distributions up to from the center. Besides, the higher spatial resolution enables them to detect some non-circular phenomena. Firstly, in the central region () a difference in velocities measured from and from the forbidden emission lines ([NII] and [SII]) is found. The authors have interpreted it as a possible signature of two differently rotating gaseous systems, where non-circular velocities associated to the forbidden lines would be caused by a low-contrast nuclear minibar. Secondly, at an extended region located to the N has been localized, which shows a negative excess of line-of-sight velocity up to . No explanation is proposed for this feature.
In this paper, new observations of NGC 1084 with a Fabry-Perot interferometer at the SAO 6m telescope are presented. The main goal of the observations was the study of the velocity field of the ionized gas in the galaxy as a whole. We focus on investigating strong non-circular gas motions in the northern part of the galaxy. The analysis of gas grand-design motions in the spiral structure will be given in a forthcoming papers.
The paper is structured as follow: In the next section (Sect. 2), we describe the observations and data reduction; the ionized gas kinematics is described in Sect. 3; possible explanations of nom-circular gaseous motions are discussed in Sect. 4; conclusions are drawn in Sect. 5.
2 Observation and data reduction
2.1 Observations with the Fabry-Perot Interferometer
The two-dimensional velocity field of NGC 1084 was obtained on October 26, 1995 at the SAO 6m reflector, using a scanning Fabry-Perot interferometer (FPI) installed in the pupil plane of a focal reducer attached to the f/4 prime focus of the telescope. The detector was an intensified photon counting system (IPCS). The observational parameters are given in table 1.
| Number of pixels | (binning ) |
|---|---|
| Pixel size | 0\farcs92 |
| Galaxy wavelength | Å |
| Etalon interference order | 501 at Å |
| Free spectral range | Å |
| Number of spectral channels | 32 |
| Channel size | Å |
| Exposure time for each channel | 225 s |
| Total exposure time | 7200 s |
| Seeing |
An order separating filter with Å was used, centered at Å, close to the redshifted galactic emission line . The filter bandpass includes also the nitrogen emission line [NII]. This line falls into the interfringe of the etalon - very close to the next order line. Usually such situation complicates data processing and interpretation, but in our case the proximity of and [NII] interference rings was purposely used to compare gas kinematics in two emission lines from the same observational data set.
Observational data were converted into a cube of 32 images. A neon lamp spectrum was used for phase calibration. Reduction of the observational data was performed using the software ADHOC developed at the Marseille Observatory (Boulesteix [1993]). It includes a phase map construction (wavelength calibration), subtraction of the night sky emission, spatial and spectral smoothing. The spatial resolution of our data, after smoothing, is 3\farcs5, and the spectral resolution is close to . Uncertainty of velocity measurements depends mostly on calibration errors and is about .
After phase calibration, the first spectral channel corresponds to 6585.5 Å ( at the redshifted line). The [NII] line is observed in the -2 interference order relatively to the -line order and has a visible shift of () from the line position. Therefore, the emission lines are certainly separated since the spectral resolution of the FPI is about .
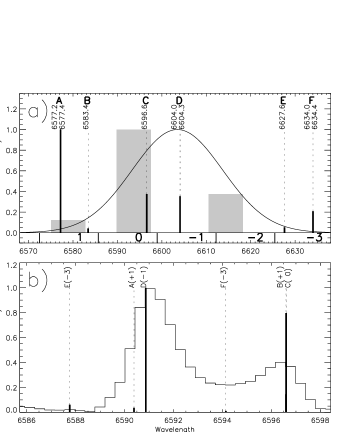
Fig. 1b shows the transmission curve of the narrowband order separating filter, while the and [NII] emission lines positions are marked as gray boxes. The width of these boxes corresponds to the full range of observable velocities (). The high velocity components of the line were included. The relative heights of the gray boxes have been set from normal emission lines ratio in HII regions. The flux from the [NII] line must then be 10 times lower than the flux from the [NII] line due to the filter transmission. Indeed, there is no traces of [NII] in our FPI spectra.
Relative intensities of the night sky emission lines from Osterbrock et al.([1996]) are shown in Fig.1. The FPI’s mean night sky spectrum was obtained as an integrated emission on the detector’s part which is free from emission of the galaxy and its ghost image. Then the mean night sky spectrum was subtracted from all Fabry-Perot spectra. The total mean night sky spectrum plotted in Fig. 1b and the individual sky lines from Fig. 1a are superimposed on the FPI spectrum. The relative intensities of these emission lines were multiplied on the filter bandpass transmission curve and the wavelengths of the night sky lines were converted to the wavelength scale for the interference order.
The night sky lines (label C in Fig. 1) and (label D) are the main contributors to the observed FPI spectra. Contribution from other lines is negligible ( including which is the brightest in the filter bandpass but is located in the extreme blue wing of the filter). Discrepancies between the FPI night sky spectrum and the line intensities and positions from Osterbrock et al.([1996]) are due to calibration errors and night sky brightness variations.
In Sect. 3 it will be shown than all non-circular components of the object’s emission lines are brighter than the mean night sky spectrum. Therefore the errors due to subtraction of the night sky lines have no influence on the measurement of the high velocity motions of the gas.
The velocity map and monochromatic and red continuum images of the galaxy were constructed after sky subtraction and smoothing procedures. All spectral channels within (8 channels) from the channel with maximal intensity were summed in each pixel to obtain the image. The non-circular component of has a relative velocity larger than only in regions where its intensity is negligible in comparison with the main component (see below). Therefore the velocity range is optimal for measuring the total flux. The flux is calibrated using the integrated flux of Hα+[NII] in NGC 1084 from Kennicutt & Kent ([1983]) and assuming a line ratio = 1.5.
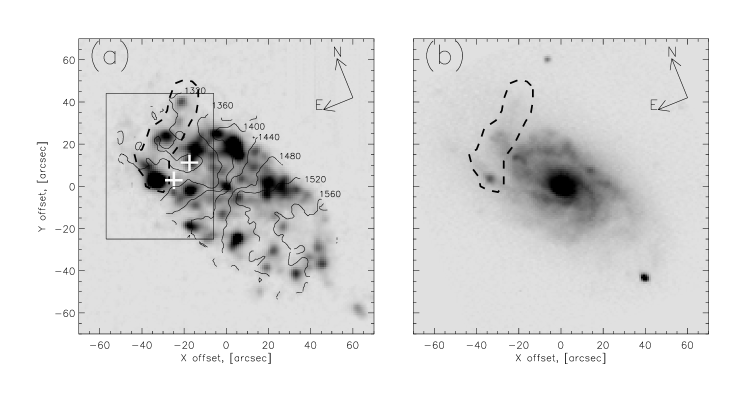
Baricenters of the and [NII] lines were calculated to obtain the full-format velocity fields (the map of the first moment) in these lines. Fig. 2a. shows the image of the galaxy and isovelocities of the velocity field. For the regions with complex emission line profiles we used a multi-component gaussian analysis.
2.2 Photometric observations
Images of the galaxy were obtained on January 14, 1997, at the SAO 1m Zeiss reflector with a CCD camera through the V filter of Johnson’s system and RC, IC filters of Cousin’s system. The pixel size of CCD was 0.49\arcsec, the seeing was about 2\farcs5. Standard stars from Landolt ([1992]) were observed for flux calibration. The rms error in the determination of the photometric zero points was 0\fm01.
The image of NGC 1084 in IC is shown in Fig. 2b. Let us note that the spiral structure which is well seen in the broad band image can hardly be traced in (Fig. 2a).
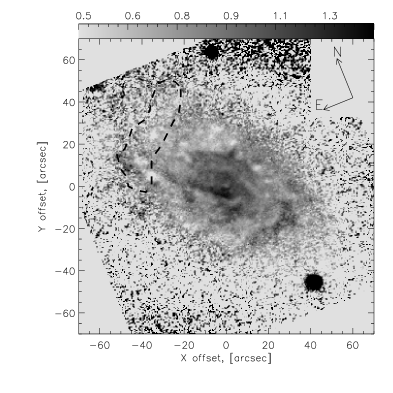
A map of the (V-IC) color index is shown in Fig. 3. A thick clumpy dust lane (”red” region in this image) appears in the SE inner part of NGC 1084 suggesting that this side of the galaxy is the closest to us. Since the SW part of the galaxy is redshifted and the NE part is blueshifted (see the velocity field on Fig. 2), the spiral arms are trailing. This situation is ordinary for spiral galaxies.
3 Gas kinematic properties
In the NE part of the galaxy there appears a chain of HII regions which does not match the shape of the spiral arm. This structure, which we call a “spur”, is outlined in Fig. 2 by a dash contour. It begins near a bright HII region and extends nearly perpendicular to the spiral arm. The total luminosity of the spur reaches of the total luminosity of the galaxy.
The mean velocity curve used as the reference curve of circular rotation was derived from the velocity measurements across the entire body of the galaxy by applying the custom developed software based on the algorithm described by Begeman ([1989]) for pure circular rotation. As a first step we find the dynamical center position and the mean value of the systemic velocity . As a second step these parameters are fixed, and the position angle of the kinematical major axis and inclination are estimated in tilted rings of 3\arcsec width. Fig. 4 shows the radial dependence for the rotation velocity (Fig. 4a), for (Fig. 4b) and for disk inclination (Fig. 4c). At , velocity data are available only for small emission islands in the WE (part see Fig. 2a) and in this region we fix the mean values for and . The resulting mean disk parameters ( , , ) are in good agreement with those found by Afanasiev et al. ([1988]). The disk orientation parameters being fixed at their mean value and the rotation curve being extracted from the velocity field (Fig. 4a), this figure shows that the circular rotation velocity is approximately constant and does not exhibit any peculiarities for the radius range .
In the most part of the galaxy the profiles of the and [NII] emission lines are quite symmetrical and have a gaussian shape (except the central region where a bar-like structure may be located). But in the “spur” the emission profiles differ from the common picture. In many locations in the “spur” the Hα profiles split into two components: a “normal” component, close to the expected one from the circular rotation velocity field, and an “abnormal” component, shifted by . To study this peculiarity in detail, we have binned resulting in our data cube (by ) an enlarged pixel size of 1\farcs84. Double-horned profiles of the spectral lines were fitted by two gaussians, corresponding to the “normal” and “abnormal” velocity components. Both and [NII] emission lines were used. In some regions of the spur the latter appears to be strongly enhanced, almost up to the level of the line intensity.
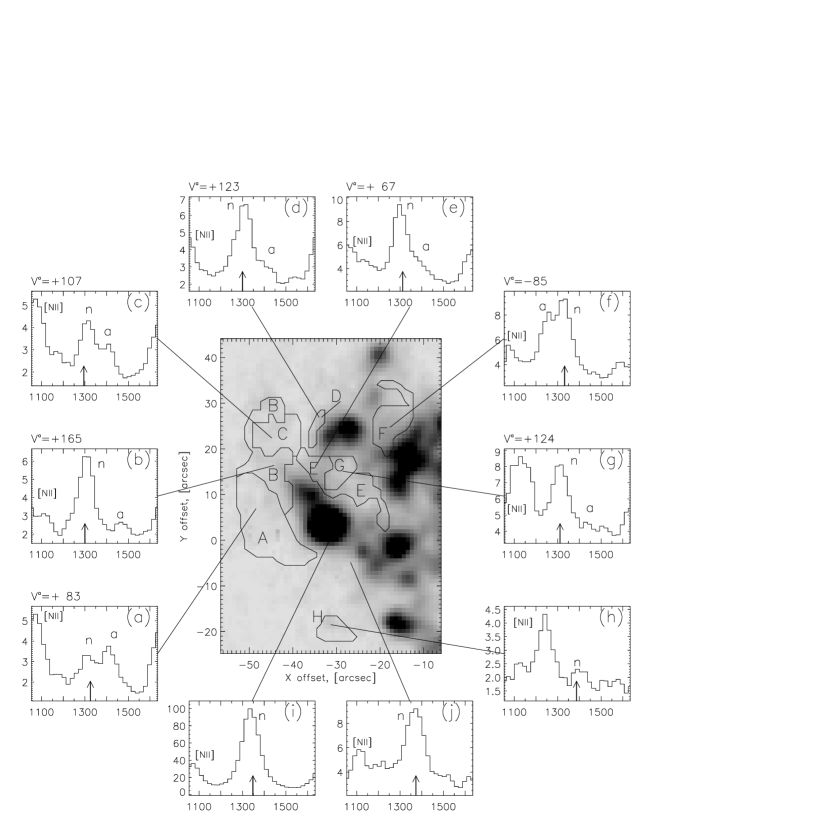
Fig. 5 reproduces the enlarged -image of the “spur” , where different regions are identified by letters A – H. Typical line profiles of and [NII] are also shown for every region in Fig. 5i and Fig. 5j. The vertical arrows in each frame corresponds to the velocity of circular rotation.
The regions with abnormal velocity components have a complex shape and are located mainly between the bright HII regions of the “spur”, avoiding the sites of active star formation. Although the brightness of emission lines away from HII regions is rather low, the observed anomalies are reliable features. As an illustration, Fig. 5j shows normal line profiles obtained for a low brightness region. The bright giant HII regions possess quite normal line profiles (see Fig. 5i), and their velocities correspond to the expected ones for the pure rotation.

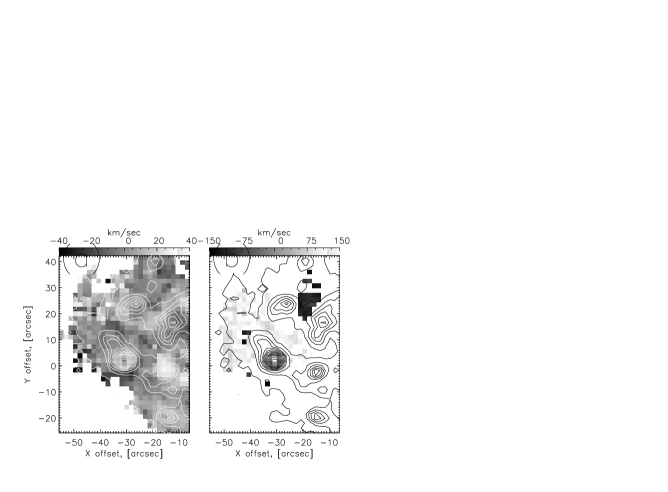
To obtain a map of residual velocities in the given region of the galaxy, the simulated 2D line-of-sight velocity field corresponding to the mean rotation curve (Fig. 4a), was subtracted from the observed velocity field. The map of the residual velocities overlapped by the isophotes of the image is shown in Fig. 7 – separately for “normal” and “abnormal” components. It shows that local velocities of the “normal” components are not perturbed by HII regions. They are in good agreement with the rotation, and hence are related to the non-disturbed gas. Let us note however that the dispersion of residual velocities is about that exceeds the observational errors and might reflect velocity perturbation by a density wave. On the contrary, velocities of the “abnormal” components differ from circular velocities by about and as mentioned above they are observed mostly between the bright HII regions.
.
Kinematic and photometric parameters of the regions marked in Fig. 5, are given in Table 2. Column (1) gives the region identification in agreement with Fig. 5. Columns (2) – (3) give the mean velocity residuals (observed velocity minus circular velocity) for “normal” () and “abnormal” () velocity components, measured from profiles. Column (4) gives the residual velocities found for [NII], columns (5) and (6) provide the intensity ratios of [NII] to lines and the ratio of “normal” to “abnormal” components. The errors in columns (2)-(6) were obtained by the intensity-weighted averaging of values over the whole region. Column (7) gives the total luminosity (in ). Line intensities were not corrected for internal absorption. Such a correction would increase , but would not change the intensity ratios.
| region | [NII]/ | |||||
|---|---|---|---|---|---|---|
| (1) | (2) | (3) | (4) | (5) | (6) | (7) |
| A | 1.28 | |||||
| B | 1.21 | |||||
| C | 0.67 | |||||
| D | 0.25 | |||||
| E | 1.93 | |||||
| F | 1.78 | |||||
| G | 0.63 | |||||
| H | — | — | — | 0.27 | ||
As seen in Table 2, the “abnormal” component is especially strong on the periphery of the “spur” (regions A and D). It is just where the relative intensity of the nitrogen line is observed to be the largest: [NII] in these regions is comparable to Hα and sometimes is larger (see Fig. 5a and 5c).
It should be noted however that there is an uncertainty in the estimates of line ratios due to continuum subtraction the overlapping of two interference orders. In addition, the transparency of the interference filter is different for [NII] and Hα lines, and the velocity variations of these components may also change their observed relative intensity. But it cannot affect the results significantly because within the same region the observed velocity range of any component usually does not exceed . Note also that independent measurements of the line intensity ratios in bright HII regions of the “spur” carried out at the same telescope with the long slit spectrograph UAGS (A.N. Burenkov, private communication) give [NII]/H, which is in good agreement with our own measurements.
In the Region B and in the Region D which captures the extension of the bright HII region, the [NII] line intensity is relatively low ([NII]/H), and the non-circular component is seen only as an asymmetry in the profile. In Region E, which extends over about 2 kpc between two bright HII regions, the relative intensity of the “abnormal” component is also low, less than 20% of the normal one. Non-circular motions of the gas are traced by an enhanced “red” wing of the profile. A similar asymmetry is typical for [NII] line profiles in this region. In the Region G, neighboring E, the intensity of [NII] becomes comparable to . Non-circular components of are not detected (Fig. 5g), but the [NII] line is redshifted by at least with respect to . The situation is different in the isolated Region F, lying at the inner edge of the “spur”. The relative intensity of [NII] looks normal here, but the line possesses a bright blue-shifted non-circular component. Note that this is the same region where the negative relative velocity excess was found earlier by Afanasiev et al.([1988]) from long-slit observations of with lower spectral resolution.
Finally, the Region H, lying on the continuation of the “spur” differs from the other regions by an unusually weak line ([NII]/H) and by the absence of a noticeable non-circular component.
Let us note that all anomalies in the emission lines profiles cannot result from the errors of the night sky subtraction. In Fig. 6 we present examples of the abnormal emission profiles from Fig. 5 and the night sky spectrum from Fig. 1b on the same intensity scale. Fig. 6 a-c show some profiles with double-horned line and/or abnormal [NII] ratio. In contrast, in Fig. 6d we plot a “normal‘’ profile from the SW side of the galaxy, opposite to the “spur” region. Obviously all lines from the object are more intense than the sky spectrum. Moreover the brightest lines of the sky spectrum are located only near the ’normal’ component of the Hα line (Fig. 6a and 6b). Therefore the “abnormal” component of the line and the largest [NII] lines are not related with overestimation or underestimation of the sky spectrum contribution.

To summarise, the residual velocity distribution looks rather complex. From Table 2 it can be found that the “normally” rotating gas does not show a systematic deviation (within ) from the line-of-sight component of circular rotation. The “abnormal” component of is strongly redshifted everywhere except the isolated region F where the residuals have the same order of magnitude, but are negative. Velocity profiles of [NII] unlike reveal only one component, excluding the region E where there is a hint that some profiles are double-horned. The velocities measured from the [NII] profiles exceed those obtained from the “normal” profile components by in all regions with the exception of the Region H where the sign of the difference is opposite. Finally, the residual velocities found from the “abnormal” components and from the [NII] lines have the same sign in all regions except the region F, which support the hypothesis that these velocity anomalies could be related phenomena.
4 Discussion
As shown above, there exists at least two different systems of emitting gas in the “spur” of NGC 1084. One of the gaseous systems shows nearly circular rotation, while the velocities of the other one differ by about from those expected in the case of non-perturbed rotation, and in the most regions the difference is positive.
The common explanation of double-peaked emission lines in star-forming galaxies, namely an expanding superbubble, is inapplicable in this particular case because the regions with velocity anomalies have an unusual location in the sky plane. As shown in the section 2.2 the SE half of the galaxy disk is the nearest to the observer. In this case the region of redshifted residual velocities lies on the nearest side while the region of blueshifted velocities lies on the far side of the disk. This would rather suggest a shrinking superbuble, which is improbable.
If a sound velocity in the gas clouds of the “spur” is close to its mean value for the ISM in outer disk regions of spiral galaxies (solar neighbourhood as example), , then , the velocity of perturbed motions exceeds strongly the sound velocity ( of neutral hydrogen). The observed enhancement of the [NII] emission line and the lower velocity difference measured from the [NII] profiles may be naturally explained if one considers the strong [NII] emission line as emitted by shock-excited gas slowed down by collisions with the unperturbed medium.
Such fast-moving gas cannot be retained by the galactic plane and must fill a volume with some filling factor, so there could be different gas velocities along the line-of-sight. This accounts for the complex shape of emission-line profiles on a scale of 200pc (a pixel of 2\arcsec ). So it is not surprising that the residual velocity field appears complex being projected onto the galactic plane. Bright HII regions, connected with massive gas clouds have quite normal velocities. The perturbed component, if it exists there, might be hidden by the bright background.
There are at least two possible interpretations of the observed velocity peculiarities.
One is an infall of high latitude gas clouds (intergalactic clouds or clouds expelled from the disk earlier) onto the galactic disk. Massive starforming clouds in the disk are too heavy to be pushed by gas inflow, so their velocities remain circular as observed, although the interaction with infalling gas may trigger star formation there. A similar phenomenon on smaller scales is occurring in our Galaxy, where high-velocity clouds (HVCs) are observed far from the galactic plane. Their infall onto the disk is confirmed by the detection of X-ray emission from heated gas spots (Kerp et al. [1994]; Kerp et al. [1999] ). The existence of gas off the galactic plane has also been noticed in external spiral galaxies, for example in NGC 891 ( Swaters et al. [1997]).
However, invoking the HVCs explanation is in contradiction with the measure of the current star formation rate (SFR) in NGC 1084, as deduced from the integrated intensity of : by using the total flux emission from Kennicutt & Kent ([1983]) and one gets (absorption was accepted to be ). The model dependence between and the SFR (Kennicutt [1983]) gives for the stellar mass interval . This value is normal (or mildly enhanced) for a late-type galaxy. The “spur” luminosity fraction is about of 18% of the total flux, and corresponds to as in the “spur” region. On the other hand, the present-day SFR may be more intense in this galaxy: three supernovae have been detected during the last 40 years. These are SN 1963P , SN 1996an and SN 1998dl. The latter two are Type II supernovae (Nakano [1996]; Filippenko [1998]) connected with recent star formation. The location of both SNe II are marked by white crosses in Fig. 2a. So it cannot be excluded that the observed off-disk gas may be expelled during the short and intense burst of starformation which took place in this region of the galaxy.
Moreover the central parts of the HII regions in the “spur” has a very blue color ( the color index ). This may indicate a large fraction of young OB stars (see Fig. 3). The red features on the E-side of the “spur” (Region A) with ) can be explained by strong dust absorption due to the shock waves in the “spur” region.
The second possible interpretation is an interaction with a gas-rich dwarf galaxy accompanied by tidal disruptive merging. Indeed, on the opposite side of the galaxy, at to the S of the nucleus, there is a small “island” of emission (Fig. 2a). It does not distinguish itself dynamically, but the radio map in the non-thermal continuum at 1.49 GHz obtained at the VLA (Condon [1987] ) shows that a long radio tail begins here which connects NGC 1084 to another radio source located 3\farcm5 (about two optical diameters) from the galaxy. As no HI map at 21 cm is available for NGC 1084, one cannot confirm whether this radio tail contains some expelled gas. But the configuration resembles a tidal tail as usually developing on the opposite side of a galaxy colliding with another one. Therefore, the gas flow twisted in the northern half of NGC 1084 might be accretion; if the initial rotation momentum of this gas is nearly orthogonal to the rotation momentum of NGC 1084, the gaseous flow could look like an off-center polar ring. This hypothesis would explain easily the different signs of velocity anomalies in the NW and SE ends of the “spur”: we would be seeing the receding and approaching parts of the rotating ”polar ring”. Such a configuration is short-lived because all the gas must fall towards the center of the galaxy in some years, but this time is not too short to prevent its detection.
To clarify further the possible mechanisms responsible for the peculiar velocity field of the “spur”, high-resolution observations of neutral and molecular gas distributions and two-dimensional spectral investigations in various forbidden optical emission lines are required.
5 Conclusions
The 2D velocity field of NGC 1084 obtained with the scanning Fabry-Perot interferometer tuned at the redshifted and [NII] emission lines has revealed an extended region in the NE part of the galaxy where two kinematically distinct gas systems are present. The first system is related to normally rotating gas, whereas the second one reveals line-of-sight velocities differing by . The “spur” covers a region of kpc in size and avoids the bright HII regions. The fast-moving gas is mostly characterized by enhanced [NII]6583 emission, which evidences for the presence of strong shock waves. Possible explanations for this phenomenon are the infall of extraplanar high-velocity clouds or the tidal disruption and accretion of another small galaxy.
Acknowledgements.
I would like to thank astronomers of the Special Astrophysical Observatory – V.L. Afanasiev and S.N.Dodonov for the observations with FPI and for useful discussion. I thank as well V.H.Chavushyan and V.V.Vlasyuk who obtained optical images at the 1m telescope and S.V. Drabek who supported observations at the 6m telescope with the IPCS. I am very grateful to O.K. Sil’chenko and A.V.Zasov for help and discussion, J. Boulesteix who provided interference filters to be used at the 6m telescope and A.N. Burenkov for providing unpublished long-slit observations of NGC 1084. Also I am grateful to referees for more notes and corrections. This work was supported by the grant of the Russian Foundation for Basic Research (project No. 98-02-17102).References
- [1988] Afanasiev, V.L., Burenkov A.N., Zasov A.V., Sil’chenko, O.K., 1988, Afz 28, 243
- [1989] Begeman, K.G., 1989, A&A 223, 47
- [1993] Boulesteix, J., 1993, ADHOC Reference Manual. Marseille: Publ. de l’Observatoire de Marseille
- [1963] Burbidge, E.M., Burbidge, G.R., Prendergast, K.H., 1963, ApJ 137, 37
- [1987] Condon, J.J., 1987, ApJS 65, 485
- [1998] Filippenko, A.V., 1998, IAU Circ 6994B, 1
- [1983] Kennicutt R.C., 1983, ApJ 272, 54
- [1983] Kennicutt, R.C., Kent, S.M., 1983, AJ 88,1094
- [1994] Kerp, J., Lesch, H.,Mask, K.-H., 1994, A&A 286, L13
- [1999] Kerp, J., Burton, W.B., Egger, R., et al., 1999, A&A 342, 213
- [1981] Kyazumov, G.A., 1981, SvAL 7, 151
- [1992] Landolt, A.U., 1992, AJ,104,340
- [1996] Nakano, S., 1996, IAU Circ 6442A, 1
- [1996] Osterbrock, D.E., Fulbright, J.P., Martel A.R.,, Keane M.J.,, Tracer S.C., 1996, PASP,108,277
- [1993] Rand, R.J., van der Hulst, J.M., 1993, AJ 105, 2098
- [1995] Ryder, S.D., Staveley-Smith, L., Malin D., Walsh, W., 1995, AJ 109, 1592
- [1997] Swaters R.A., Sancisi, R., van der Hulst, J.M., 1997, ApJ 491, 140
- [1988] van der Hulst, J.M., Sancisi, R., 1988, AJ 95, 1354
- [1998] Walter, F., Kerp, J., Duric, N., Brinks, C., Klein, U., 1998, ApJ 502, L143