The warm absorber in IRAS 13349+2438: dusty or not?
Abstract
IRAS 13349+2438 was the first quasar suggested to host a warm absorber with internal dust. We obtained new HRI data for this object and derive constraints on the X-ray emitting region of IRAS 13349+2438 by investigating its X-ray extent and lightcurve. Rapid X-ray variability is detected with a factor of two change in count rate within one day and 20% variability within about three hours, which practically rules out any significant contribution of scattered X-rays. We present for the first time a detailed, self-consistent modeling of the ROSAT PSPC and ASCA spectrum of IRAS 13349+2438 in terms of a warm absorber including dust. It turns out that both a dust-free and a dusty single-component warm absorber fail to explain the ROSAT, ASCA, and optical data simultaneously. We discuss possible explanations such as a variable and/or complex warm absorber, a variable soft X-ray continuum and instrumental effects.
Key Words.:
Galaxies: active – quasars: individual (IRAS 13349+2438) – X-rays: galaxies
1 Introduction
IRAS 13349+2438 is the archetypal infrared-selected quasar, discovered in a sample of bright IRAS 12 sources by Beichmann et al. (beichmann (1986)). It is optically bright () and located at a redshift of (Kim et al. kim (1995)). Broadband investigations revealed that the spectral energy distribution is dominated by infrared emission. Its bolometric luminosity111 km s-1 Mpc-1 and are assumed throughout this paper. between 0.34 and 100 is erg s-1 (Beichmann et al. beichmann (1986)). VLA observations show a weak, unresolved radio source with a flux density of mJy at 4.85 GHz (Laurent-Muehleisen et al. sally (1997)).
Wills et al. (wills (1992)) presented polarimetric and spectrophotometric observations and found high polarization which rises from 1.4% in the K-band (2.2) to 8% in the U-band (0.36). From the very large hydrogen broad-line ratios (; ) and the shape of the optical continuum they derive , which corresponds to a hydrogen column density of cm-2 assuming standard dust and a Galactic gas-to-dust ratio. To explain their observations, Wills et al. (wills (1992)) argued for a model which invokes a bipolar geometry of the central region and in which the line-of-sight just grazes the edge of a dusty, parsec-scale torus or disk. The observed optical emission is a superposition of two components: a direct one, which gets attenuated as the light passes through the molecular torus, and a second one, which is emitted in polar directions and then scattered towards us by electrons or small dust grains. The latter component is therefore polarized parallel to the major axis of the host galaxy.
IRAS 13349+2438 turned out to be an extraordinarily bright and variable soft X-ray source. In the ROSAT All-Sky Survey it was detected with cts/s in the 0.1-2.4 keV energy band (Brinkmann & Siebert wpb94 (1994)). Brandt et al. (brandt96 (1996); BFP96 hereafter) analyzed two short ROSAT PSPC pointed observations and found large amplitude variability as well as evidence for an ionized absorber in the soft X-ray spectrum by identifying the O viii absorption edge at (rest frame) 0.871 keV. They also suggested the presence of dust within the so-called ’warm absorber’ in order to explain the apparent discrepancy between the observed optical reddening and the absence of any cold absorption in excess of the Galactic value.
Whereas the model of a warm absorber with internal dust has meanwhile been successfully applied to the X-ray spectra of several AGN (e.g. NGC 3227, NGC 3786, IRAS 17020+4544; Komossa & Fink 1997a,b; Leighly et al. 1997b ; Komossa & Bade komossa98 (1998)) this has not yet been done for IRAS 13349+2438(for first results see Komossa & Greiner komossa99 (1999)). Given the potentially strong modifications of the soft X-ray spectrum by the presence of dust (e.g. Komossa & Fink 1997a ) it is important to scrutinize whether (and under which conditions) a dusty warm absorber is consistent with the observed X-ray spectrum. ROSAT spectra are best suited to accomplish this, since the most pronounced signature of dust is the carbon edge at 0.28 keV, which is outside the ASCA energy range.
Brinkmann et al. (wpb96 (1996)) analyzed the ASCA observation of IRAS 13349+2438 and found distinct changes in the spectral parameters compared to the earlier ROSAT data. These findings were confirmed by Brandt et al. (brandt97 (1997)) in an independent analysis of the data. In particular, the strong O viii absorption edge found in the PSPC observation was not detected anymore. Instead, both analyses find a spectral feature around keV, which is interpreted as an emission line by Brinkmann et al. (wpb96 (1996)) and a weak O vii absorption edge by Brandt et al. (brandt97 (1997)).
Besides a successful spectral fit, a key argument for invoking the presence of dusty warm absorbers is the apparent discrepancy between the column densities of cold material derived from the optical reddening and the absence of excess soft X-ray absorption. A crucial assumption for this argument is that both, the optical and the X-ray continua, are seen along the same line of sight. The necessity of dusty warm material would be alleviated if the X-ray emission were spatially extended, i.e. if the X-rays would not pass through the material causing the optical extinction. Observations with the ROSAT HRI allow to set limits on the contribution of an extended component to the X-ray emission by its improved spatial resolution and the confirmation of the rapid X-ray variability observed with ASCA (Brinkmann et al. wpb96 (1996)).

We note that IRAS 13349+2438 was also considered as a narrow-line Seyfert 1 galaxy (Osterbrock & Pogge osterbrock (1985)), due to some of its optical (permitted emission line widths, [O III]/H ratio) and X-ray properties (steep spectrum, rapid variability), which are typical for this class of AGN. We will discuss some of our results in view of this hypothesis.
2 The ROSAT HRI data
IRAS 13349+2438 was observed twice with the ROSAT HRI. The first observation (hereafter H1) took place in 1996 from July 16 to July 21 and resulted in an effective exposure of 6209 s. The second observation (H2) was conducted roughly one year later, from June 15 to June 24 1997, and resulted in 24748 s of good exposure. IRAS 13349+2438 was observed on-axis in both observations with an average count rate of cts/s.
2.1 Spatial extent
The high spatial resolution of the ROSAT HRI provides tight constraints on any extended emission component in IRAS 13349+2438. The HRI point spread function (PSF) can be approximated by two Gaussians with arcsec and arcsec and an exponential term, which is relevant for large radii ( arcsec) and bright sources (David et al. david (1997)). The inner core of the PSF corresponds to a projected linear size of kpc at the redshift of IRAS 13349+2438. Due to random errors in the aspect solution, the values of and vary from 1.9 to 2.5 arcsec and from 3.3 to 4.1 arcsec, respectively, between individual observations of point sources. Further, elongations of the PSF by uncorrected residual wobble motion have been reported for a number of sources (Morse morse (1994); W.Pietsch, priv. com.).


In a practical approach, the observation dependent uncertainties were modeled by smearing the theoretical PSF with an additional Gaussian characterized by . We searched for the best-fitting by fitting the smeared PSF to the binned radial profile of IRAS 13349+2438 from the H2 observation using a least-squares method. The best description, shown in Fig. 1, is achieved for arcsec. This value is well within the range determined from numerous other analyses of point source observations. Given the mentioned uncertainties in the determination of the correct HRI PSF for an individual observation, we conclude that the X-ray emission of IRAS 13349+2438 is point like to the limit of the HRI resolution.
2.2 Light curves
Source counts were extracted from a circular region with radius 1.5 arcmin around the centroid position of the X-ray source. The background was determined from a source free annulus with inner radius 3 and outer radius 5 arcmin. Since IRAS 13349+2438 was observed on-axis, no vignetting correction was applied to the data. Finally, the observations were split into individual observation intervals with durations between 1000 to 3000 s. The intervals were chosen by hand to ensure sufficient photon statistics in each data point and to match as closely as possible the distribution of the observation intervals in “real time”. The resulting light curves are shown in Fig. 2.
The average count rate in both, H1 and H2, is cts/s. Assuming a simple power law spectrum with a photon index of (see Sect. 3.3.1) and Galactic absorption ( cm-2; Murphy et al. murphy (1996)), this count rate yields an unabsorbed 0.1-2.4 keV flux of erg cm-2 s-1. The corresponding rest frame 0.1-2.4 keV luminosity is erg s-1.
IRAS 13349+2438 clearly displays rapid and large amplitude variability in both HRI observations. At the beginning of H2 we obviously observed the decline of a larger outburst and the count rate decreases by almost a factor of two within one day. The fastest variability seen is a decline by 20% within about 3 hours, which is truly remarkable given the high X-ray luminosity of IRAS 13349+2438. Following Lawrence & Papadakis (lawrence (1993)), who find a correlation between luminosity and doubling time scale from EXOSAT variability power spectrum analysis, a variability time scale of the order of 106 to 107 sec would have been expected for IRAS 13349+2438.
For illustrative purposes we show in Fig. 3 the historical X-ray light curve for IRAS 13349+2438 including all available data from the ROSAT All-Sky Survey to the latest HRI observations. All measurements have been converted to PSPC count rates assuming a simple power law spectrum () and Galactic absorption.
X-ray variability was detected in all previous observations of IRAS 13349+2438. BFP96 note a factor of change between the two PSPC observations separated by about one year (P1 and P2). During P2 in December 1992, IRAS 13349+2438 obviously happened to be in a historical high state. Unfortunately, P2 only lasted s and no variability was detected within this time interval (BFP96). In the ASCA observation a 50% increase in flux within about 5 hours was detected (Brinkmann et al. wpb96 (1996)). This time scale is similar to that found in the HRI observation.
Using the observed variability time scales and causality arguments we can derive upper limits on the size of the X-ray emitting region (; neglecting relativistic beaming). A time scale of one day gives an upper limit of AU. The fastest observed variability time scales of 3 to 5 hours suggest a size of the X-ray source not larger than 20 to 30 AU. This practically rules out a significant contribution of scattered X-rays, since the observed sizes of electron scattering mirrors are a factor of larger ( pc in NGC 1068; Antonucci et al. antonucci (1994)). In addition, a small mirror would imply very high electron densities and a Thomson-thick scattering medium, which might be in contradiction to observations at other wavelengths (see discussion in BFP96).
Variability also constrains the efficiency of the conversion of infalling matter into radiation energy (e.g. Fabian fabian (1979)):
The observed change in luminosity of erg s-1 within s gives 1.2%.
We finally note, that the above arguments hold only in the absence of relativistic beaming, which would effectively shorten the observed variability time scales by time dilation effects. Models involving relativistic motion have recently been proposed for a number of narrow-line Seyfert 1 (NLS1) galaxies to explain spectral features (Leighly et al. 1997a ; Hayashida hayashida (1997)) and in particular to explain the rapid X-ray variability in IRAS 13224-3809 (Boller et al. boller (1997)). Despite its high luminosity, IRAS 13349+2438 shows many similarities to NLS1 galaxies, e.g. a steep soft X-ray spectrum and rapid variability. It also satisfies the NLS1 classification criteria of Goodrich (1989b ). Therefore the presence of relativistic effects in IRAS 13349+2438 cannot be excluded.
3 The ROSAT PSPC data: Spectral analysis
3.1 Data preparation
IRAS 13349+2438 was observed in two short pointings with the ROSAT PSPC from January 7 to January 14, 1992 ( s) and on December 16 1992 ( s). Hereafter the two observations are referred to as P1 and P2, respectively. The data were extracted from the ROSAT archive at MPE and analyzed using standard routines within the EXSAS environment (Zimmermann et al. zimmermann (1994)). Source photons were extracted from a circular cell with radius 3 arcmin. The background was determined from a circular source-free region near the target source. Corrections for vignetting and dead-time were applied. For the spectral analysis, the pulse height spectrum between channels 11 and 240 was rebinned such that the signal-to-noise ratio in each bin was at least 10.
In the ROSAT All-Sky Survey IRAS 13349+2438 was observed for about 365 s. We extracted source photons from a circle with radius 10 arcmin centered on IRAS 13349+2438. To ensure a similar exposure, the background was determined from a source free circle with the same radius, but displaced from IRAS 13349+2438 along the scanning direction of the satellite during the All-Sky Survey. Again the data were corrected for vignetting and dead time. In total, about 930 photons were accumulated for IRAS 13349+2438 during the Survey observation. Finally, the pulse height spectrum between channels 11 and 240 was rebinned according to a constant signal-to-noise ratio of 5.h1626.tex
3.2 Warm absorber models
To discuss the X-ray spectrum in terms of warm absorption we used warm absorber models calculated with the photoionization code Cloudy (Ferland ferland (1993)). For the general assumptions of the models see Komossa & Fink (1997a,b). Briefly, the ionized material was assumed to be of constant density (log = 7) and of solar abundances (Grevesse & Anders grevesse (1989)) in the dust-free case. A typical Seyfert IR to -ray spectral energy distribution (with in the EUV) was assumed as ionizing continuum. In the warm absorber models including dust, the dust composition and grain size distribution were like those of the Galactic diffuse interstellar medium (Mathis et al. mathis (1977)), and the chemical abundances were depleted correspondingly, if not mentioned otherwise. We focused on Galactic-ISM-like dust, because this was also assumed in the optical reddening estimates (e.g. Brandt et al. 1996). To test specific scenarios we also varied the dust properties, but these are not treated as additional free fit parameters. The warm absorber properties which are derived from X-ray spectral fits are the ionization parameter and the hydrogen column density of the ionized material, where is the count rate of incident photons above the Lyman limit, is the distance between the central source and the warm absorber and is the hydrogen density.


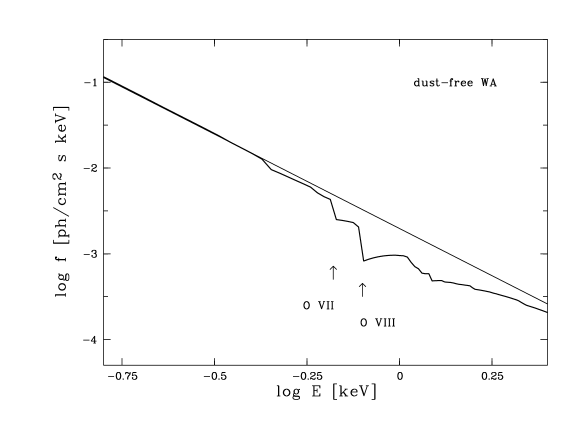
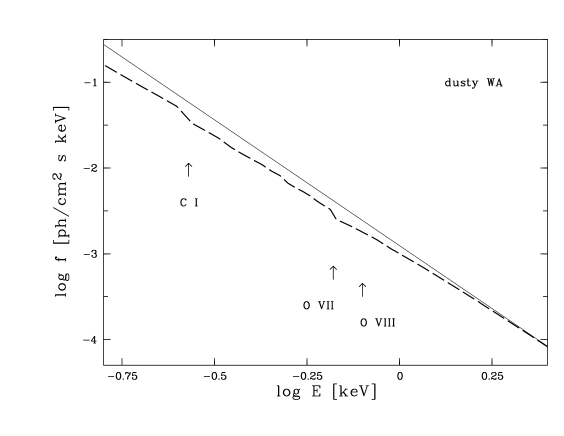
To illustrate the influence of dust on a warm absorber, we show in Fig. 4 the model spectra for a dust-free and a dusty warm absorber model in the ROSAT PSPC energy range. In the dust-free case the observed spectrum, when it is described with a simple power law model, appears to be steeper than the intrinsic power law continuum because of a sequence of absorption edges due to ionized oxygen and neon. If dust is added to the warm absorber, the observed spectrum changes dramatically. A carbon absorption edge appears at 0.28 keV due to the graphite species of dust and the absorption edges of ionized oxygen are less pronounced, because of the dust-induced lower ionization state of the warm absorber gas (Komossa & Bade komossa98 (1998)). In particular, the O viii edge is considerably weaker relative to O vii (and almost completely disappears in the case of IRAS 13349+2438). Contrary to the dust-free warm absorber, the presence of dust leads to an apparent flattening of the X-ray spectrum in the ROSAT PSPC energy band.
3.3 Results
3.3.1 Pointed Observations
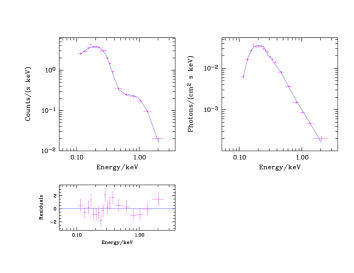
First, we applied various ‘standard models’ to the data, e.g. a simple power law and a power law plus black body, to check whether the results of BFP96 could be reproduced. The residuals of the power law fit to the PSPC data are displayed in the top panels of Fig. 5. We obtain , cm-2 and for P1 and , cm-2 and for P2. Clearly, simple power law models are ruled out for both observations.
In a second step, a dust-free warm absorber model was applied. In contrast to the approach of BFP96 we use the additional information on the hard X-ray power law available from the ASCA observation, i.e. we fix the intrinsic power law index to (Brinkmann et al. wpb96 (1996); see also Sect. 4.2). We find an acceptable fit of the X-ray spectrum in terms of a dust-free warm absorber, with log () and log () for P1 and P2, respectively (Fig. 5, middle panels). The value of is consistent with that of BFP96. The amount of cold absorption in this model is slightly below, but still consistent with the Galatic value ( = cm-2, as compared to cm-2).
We conclude that the dust-free warm absorber model provides a successful fit to the ROSAT X-ray spectra and removes almost all systematic residuals. Moreover, the intrinsic X-ray continuum is consistent with the hard X-ray photon index obtained with ASCA.
If we now modify this best fit model by adding the appropriate amount of dust to the warm absorber which corresponds to the value of , taking into account the gas-dust and gas-radiation interaction, the expected X-ray spectrum changes drastically and the data cannot be fit at all (). This is partly due to dust-induced additional absorption, in particular at the carbon edge, which leads to a much flatter spectrum than observed. This still holds if we allow for non-standard dust, i.e., if we selectively exclude either the graphite or silicate species. A more detailed exploration of the very large paramater space of dust properties is not warranted with current data and should await the availability of higher resolution X-ray spectra.
The expected column density derived from optical extinction is much smaller than the value of determined from the dust-free warm absorber fit. Therefore, in a next step, we allowed all parameters (except ) to vary and checked whether a dusty warm absorber can be successfully fit at all. This is not the case. For example, if log is fixed to log we get .
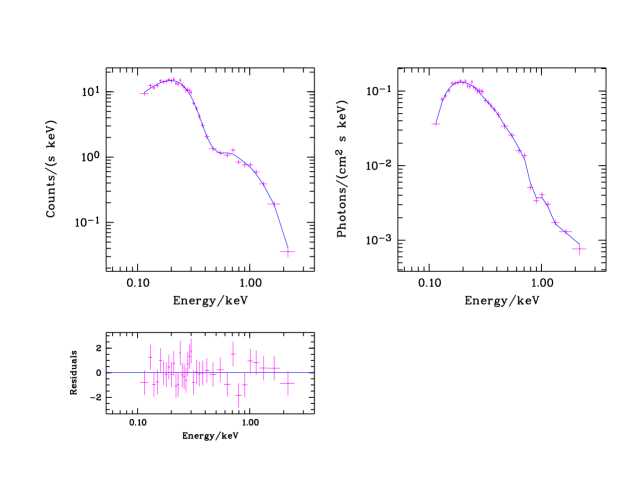
Next, the underlying power law spectrum was allowed to vary as well. Fixing to again, the fit of the P2 observation results in a steep intrinsic spectrum with in order to compensate for the ’flattening effect’ of dust (cf. Komossa & Fink 1997a,b). The intrinsic continuum is much steeper than obtained with ASCA and still the fit is statistically not acceptable (). The ionization parameter is not well constrained by the data (). Similar results are obtained for the P1 observation (). The residuals between 0.6 and 1 keV remain (Fig. 5, bottom panels) and a dust-free warm absorber model provides a better description of the PSPC data.
3.3.2 Survey observation
A simple power law model provides an excellent fit to the Survey data with and = cm-2 ( = 0.74).
When fitting the warm absorber models to the Survey observation we get the following results: A dust-free warm absorber with provides a successful fit and the resulting model parameters are consistent with those of the pointed observations within the errors. If we add dust to the model and fix to , no successful fit can be achieved. For example, fixing to the Galactic value, the fit still yields an unacceptably high of about 11. Allowing for a steeper intrinsic spectrum, with as in the pointed observations, a dusty warm absorber with = is consistent with the spectrum from the Survey observation. However, the quality of the fit is slightly worse compared to the dust-free warm absorber.
We conclude that, within the limits of low photon statistics, the Survey data are roughly consistent with the pointed observations.
4 The ASCA data
The ASCA observation of IRAS 13349+2438 was analyzed and discussed in detail by Brinkmann et al. (wpb96 (1996)) and Brandt et al. (brandt97 (1997)). Therefore we describe in the following only the differences to the above papers in terms of data preparation and then turn to our new spectral analysis.
4.1 Data preparation
We used the ’Revision 2’ data obtained from the ASCA public archive at Goddard Space Flight Center (GSFC) and applied the following conservative screening criteria: For the GIS the minimum elevation angle above the Earth’s limb (ELV) was chosen to be . In the case of the SIS we used ELV. To avoid atmospheric contamination, data were only accepted in the SIS when the angle between the target and the bright earth (BR_EARTH) was greater than . A minimum cut-off rigidity (COR) of 6 GeV/c was applied for both, the SIS and the GIS. Data taken within four read-out cycles of the CCD detectors after the passage of the South Atlantic Anomaly (SAA) and the day-night terminator are not considered in the analysis. Further, periods of high background were manually excluded from the data by checking the light curve of the observation.
Source counts were extracted from a circular region centered on the target with a radius of for the GIS and for the SIS. We used the local background determined from the observation in the analysis for both detectors. In particular, the GIS background was estimated from a source free region at the same off-axis angle as the source and with the same size as the source extraction region.
Both Brinkmann et al. (wpb96 (1996)) and Brandt et al. (brandt97 (1997)) neither find spectral differences between the two SIS detectors nor between the two observations of IRAS 13349+2438 separated by about three days. We therefore merged the data from the two observations to increase the signal-to-noise ratio. The same procedure was applied to the GIS detectors.
All spectra were rebinned to have at least 20 photons in each energy channel. This allows the use of the technique to obtain the best fit values for the model spectra. We used the latest GIS redistribution matrices available (V4_0) from the calibration database and created the SIS response matrices for our observation using SISRMG, which applies the latest charge transfer inefficiency (CTI) table (sisph2pi_110397.fits). The ancillary response files for all four detectors were generated using the ASCAARF program.
Spectra were fitted in the energy range 0.8 to 9 keV for the GIS and between 0.6 and 8 keV for the SIS. The upper energy boundaries are given by the maximum energy at which the source was detected in each instrument. The lower energy boundaries result from the calibration uncertainties of the detectors (e.g. Dotani et al. dotani (1997)). If not mentioned otherwise, we quote the results of simultaneous fits to all four instruments only.
4.2 Spectral analysis
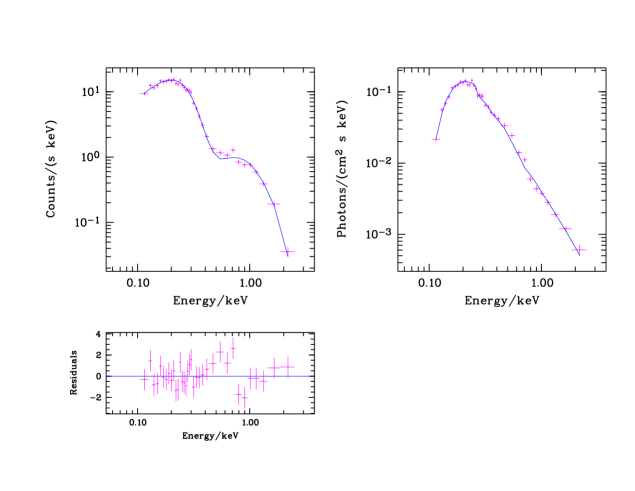
To check for the consistency of our data preparation procedure, we first fitted several simple models to the ASCA data and compared them to previous analyses (Brinkmann et al. wpb96 (1996); Brandt et al. brandt97 (1997); Leighly leighly (1999)). For the simple power law model we get cm-2, and (565 d.o.f). The fitted is consistent with the Galactic value and is therefore fixed to cm-2 in the following. Restricting the fit to energies above 2 keV we find and (237 d.o.f.). In accord with Brinkmann et al. (wpb96 (1996)) and Leighly (1999), we note that the inclusion of a narrow ( keV) iron K line improves the fit significantly (; P = 99.9% according to an F-test for two additional parameters). The best-fitting parameters are: , and eV. The obtained iron line parameters are typical for narrow-line Seyfert 1 galaxies (Leighly 1999). A gaussian emission line with the above parameters is included in all following models. Dividing the ASCA data by an extrapolation of this model to lower energies gives the residuals shown in the upper panel of Fig. 6. Clearly, there are systematic residuals below 1.5 keV.

Adding a single absorption edge to the power law model results in the following best-fitting parameters: , , and (563 d.o.f.). The agreement with the Brandt et al. (brandt97 (1997)) results is excellent. As can be seen in the middle panel of Fig. 6, the fit is very good and all systematic residuals have disappeared.
As shown by Brandt et al. (brandt97 (1997)), a dust free warm absorber provides a good fit to the ASCA data with and log .
Next we applied the dusty warm absorber model described in Sect. 3.2 to the ASCA data (including the iron K line with line energy and fixed to the above values). The best-fitting model parameters are as follows: , log U = 0.00, log and (563 d.o.f.). The ratio of data to model for this fit is shown in the lower panel of Fig. 6. Note that the column density of the ionized material corresponds very well to the value expected from the observed optical extinction. Although the fit is statistically acceptable and clearly better than the simple power law model, it is significantly worse than the power law plus absorption edge fit. The data lie systematically above the model in the lowest energy channels. Whether this indicates that the dusty warm absorber model is not an optimal description of the ASCA spectrum or whether calibration uncertainties of the SIS detectors are important, is difficult to answer.
5 Discussion
5.1 A dust-free warm absorber?
As we have shown in Sect. 3, a dust-free warm absorber model represents the formally best description of the PSPC spectrum of IRAS 13349+2438. The systematic structures in the residuals almost completely disappear and, in addition, the spectral shape of the intrinsic X-ray continuum is consistent with the hard X-ray spectrum as observed with ASCA (). We further note that applying the dust-free warm absorber model we also obtain a viable description of the ASCA data, although with significantly different physical parameters for the warm absorber as compared to the ROSAT PSPC results. The energy of the absorption edge is significantly lower in the ASCA data and consistent with O vii, whereas the PSPC data clearly favor O viii. Furthermore, the optical depth of the absorption edge is much higher in the PSPC data and, consequently, the column density of the warm absorber derived from the ROSAT observations (log ) is about an order of magnitude higher than in the ASCA observation (log ; Brandt et al. 1997).
The rapid X-ray variability observed in IRAS 13349+2438 indicates changes in the ionizing continuum and thus a variable ionization state of the warm absorber is not unlikely. This might explain the change in the absorption edge energy as IRAS 13349+2438 was about a factor of four brighter in X-rays during the second ROSAT observation (P2) as compared to the ASCA observation. In the bright state, most of the oxygen is ionized to O viii. When the ionizing flux decreases, the O viii ions recombine to O vii and the observed absorption edge energy decreases. This kind of variation of the ionization state of the warm absorber has also been claimed for the Seyfert 1 galaxy MCG–06–30–15 (Reynolds et al. reynolds (1995); Otani et al. otani (1996)). The first PSPC observation (P1), when IRAS 13349+2438 was in a state comparable to the ASCA observation, suffers from low photon statistics and although the resulting spectral parameters of the dust-free warm absorber model are consistent with P2 we note that the higher (1.05 compared to 0.84) might indicate spectral changes.
Apart from changes in the ionization state, the differences between the ASCA and ROSAT spectra also require a change in the column density of the ionized material of at least cm-2 between the two observations, i.e. within about 3 years. One might speculate that isolated clouds of ionized material stripped off the torus and moving across the line of sight could be responsible for such a change in column density.
A principal difficulty of any dust-free warm absorber model of course is to explain the discrepancy between the observed amount of optical reddening and the absence of any cold X-ray absorption. Apart from postulating atypical gas-to-dust ratios in IRAS 13349+2438 we might think of two possible ways out: variable optical extinction and different paths for the optical and the X-ray radiation.
With regard to the first possibility we note that the X-ray and the optical observations were not simultaneous and therefore variable optical extinction cannot be excluded. In fact, changes in the reddening of emission lines in Seyfert 1.8 galaxies on a time scale of years were reported by Goodrich (1989a , goodrich90 (1990)) and interpreted in terms of moving cold obscuring material. On the other hand, no changes in the optical extinction have been observed up to now (Wills et al. wills (1992); Lanzetta et al. lanzetta (1993)) and the preliminary results of recent spectroscopic observations of IRAS 13349+2438 (Leighly, priv. com.; Papadakis, priv. com.) are completely consistent with the original Wills et al. (wills (1992)) results. Furthermore, the amount of cold absorption measured with the ROSAT PSPC and ASCA is always consistent with the Galactic value and does not indicate variable cold absorption. Both results favor constant optical extinction. Obviously, simultaneous soft X-ray and optical observations of IRAS 13349+2438 are required to ultimately decide whether variable optical extinction plays a role, but based on current observations this seems highly unlikely.
An alternative explanation for the apparent discrepancy between optical and cold X-ray absorption would be a special geometry, in which the optical and the X-ray continuum do not travel along the same paths to the observer. Since the observed rapid X-ray variability of IRAS 13349+2438 effectively excludes a significant contribution of scattered X-rays, one might invoke a partial covering geometry, where the optical continuum happens to pass through a lower total column density of obscuring material. Although such a scenario might be constructed for a single object, this approach becomes increasingly contrived in the light of the growing number objects, for which a ’simple’ dusty warm absorber provides a consistent explanation of the X-ray and optical properties (e.g., NGC 3227, NGC 3786, IRAS 17020+4544). We therefore now turn to the dusty warm absorber hypothesis.
5.2 A dusty warm absorber?
The prime argument for the presence of dust within the warm absorber is the apparent discrepancy between the observed optical extinction and the absence of cold absorption in the X-ray spectrum. Furthermore, as we have shown in Sect.4.2, a self-consistent Galactic-ISM dusty warm absorber model is a reasonable representation of the ASCA spectrum of IRAS 13349+2438 and the column density of the warm absorber determined by spectral fitting is consistent with the derived from optical reddening.
We note, however, that the ASCA spectrum is not very sensitive to the dustiness of the warm absorber, since the most important features (like the Carbon absorption edge) are expected below 0.6 keV. Nevertheless, the absence of a strong O viii edge in the ASCA spectrum222This is confirmed by Brandt et al. (brandt97 (1997)), who find for the O viii absorption edge, which is consistent with zero. (Brinkmann et al. wpb96 (1996)) is exactly the expected signature of dust within a warm absorber (cf. Fig. 4). The structure in the spectrum around 0.65 keV was modeled as an O vii absorption edge by Brandt et al. (brandt97 (1997)) and as an isolated emission line by Brinkmann et al. (wpb96 (1996)). In fact, even both features may be present and overlapping. We note that also an instrumental emission feature has been reported around 0.6 keV (see Sect. 2.1 of Otani et al. otani (1996)).
The major problem with dusty warm absorber models for IRAS 13349+2438 lies in the fact that they are, at most, marginally consistent with the ROSAT PSPC data. Even if one accepts the reduced quality of the fit (), a temporal change of the intrinsic continuum of between the ROSAT and the ASCA observation has to be explained.
The difference in the quality of the fit between the dust-free and the dusty warm absorbers is due to the clear indication of an O viii absorption edge in the ROSAT data (see also Table 1 of BFP96), which should be much weaker if the warm gas is dusty. In principle, it is possible to introduce increased O viii absorption also in the case of a dusty warm absorber, for example by increasing the gas-phase oxygen abundance (which is depleted in the models to account for the binding of metals into dust). However, the limited spectral resolution of ROSAT certainly does not warrant this kind of fine-tuning to achieve optimal fits and the improved spectral capabilities of future X-ray missions are be needed to study in detail the elemental abundances of the warm absorber as well as the properties of the any dust in IRAS 13349+2438.
As far as the change in the intrinsic continuum is concerned, one might speculate about various explanations, including a ’real’ change in the spectrum and instrumental effects.
The X-ray continuum spectrum might indeed have varied by between the ROSAT and the ASCA observations, which are separated by about three years. This possibility of course cannot be ruled out and in fact spectral changes have previously been observed in narrow-line Seyfert 1 galaxies (e.g. Mrk 766; Leighly et al. 1996). However, we consider it unlikely for IRAS 13349+2438 in view of the fact that no spectral variations have been observed between as well as within the individual PSPC and ASCA observations. In particular, the spectra observed in the two PSPC observations seem to be consistent despite a dramatic increase in flux by a factor of four. Furthermore, no spectral variations have been detected within the ASCA observation (e.g. Brinkmann et al. wpb96 (1996)).
Systematic differences between ASCA and ROSAT spectra have been reported for various simultaneous observations in the past (e.g. NGC 5548; Iwasawa et al. (iwasawa (1999)) and references therein). In particular, the photon index tends to be steeper by in these PSPC observations as compared to ASCA. On the other hand there are also observations, where the ASCA and ROSAT spectra do agree reasonably well (e.g. Miyaji et al. miyaji (1998); Brinkmann et al. brinkmann98 (1998); Cappi et al. cappi (1997)). Although these observations were not done simultaneously, it seems unlikely that spectral changes occured in all these sources which exactly compensate for any putative calibration uncertainties. The ASCA/ROSAT discrepancies definitely need to be further investigated. This is, however, beyond the scope of this paper.
We conclude that it cannot be excluded that the observed difference between the ROSAT and ASCA power law continuum spectrum of IRAS 13349+2438 is at least partly due to instrumental effects. We note, however, that even if we allow for the steeper PSPC spectrum in the dusty warm absorber model (and only in this model a systematically steeper continuum is required for the ROSAT data), the fit is still only marginally acceptable.
In the previous section we discussed the possibility of a variable dust-free warm absorber. In order to preserve the dusty warm absorber hypothesis, and hence to obtain a physical model to explain all X-ray and the optical properties consistently, we might also speculate about more complicated warm absorber models. For example, a two-zone warm absorber has been proposed for the Seyfert 1 galaxy MCG–6–30–15 (Otani et al. otani (1996)), i.e. a variable inner warm absorber responsible for the O viii absorption edge and an outer warm absorber in a lower ionization state and thus mainly imprinting the O vii edge. IRAS 13349+2438 might be a similar case: the inner warm absorber varied between the ROSAT and the ASCA observation either by changes in the ionization state and/or by a variation in Nw, whereas the outer dusty warm absorber is present in both observations.
6 Conclusions
We presented new ROSAT HRI data for IRAS 13349+2438 and a re-analysis of the ROSAT PSPC and ASCA spectra in terms of a warm absorber, but self-consistently including the effects of dust on the soft X-ray spectrum.
The HRI light curve of IRAS 13349+2438 confirms the rapid and large amplitude variability already noted in the ASCA data (Brinkmann et al. wpb96 (1996)). We observed a factor of two change in count rate within one day and 20% variability within about three hours. These rapid variations of the soft X-ray flux rule out a significant contribution of scattered X-rays to the total flux.
The analysis of the measured ROSAT PSPC and ASCA spectra gives contradictory results. The PSPC data are best fit by a dust-free warm absorber, but large changes in the column density of the ionized material and the ionization state are required to describe the ASCA data with this model. And finally it cannot explain the discrepancy between the optical reddening and the absence of cold X-ray absorption. On the other hand, a dusty warm absorber is consistent with the ASCA data and gives a column density of the warm material, which agrees very well with the one predicted from optical reddening. However, the dusty warm absorber is, at most, marginally consistent with the PSPC data and requires a much steeper () intrinsic continuum as that found in the ASCA data.
Physical effects, such as a variable warm absorber column density and ionization state as well as instrumental effects have to be considered to explain the apparent discrepancies. Maybe a two-zone warm absorber, similar to the one postulated for the Seyfert 1 galaxy MCG–6–30–15, is able to provide a consistent explanation of all X-ray data and the optical extinction, but we consider it an over-parameterization of presently available X-ray data. From spectral fits to current ROSAT and ASCA data alone the presence of dust within the warm absorber cannot be proven and the discrepancy between the observed optical reddening and the absence of cold X-ray absorption remains the strongest argument in favor of a dusty warm absorber in IRAS 13349+2438. Future X-ray observations (with XMM or probably SAX), will be able to directly probe the dust content of the warm absorber, e.g. via the predicted Carbon absorption edge.
Acknowledgements
The ROSAT project is supported by the Bundesministerium für Bildung, Wissenschaft, Forschung und Technologie (BMBF) and the Max-Planck-Gesellschaft. This research has made use of the ASCA IDL Analysis System developed by Tahir Yaqoob, Peter Serlemitsos and Andy Ptak and of the NASA/IPAC Extragalactic Data Base (NED) which is operated by the Jet Propulsion Laboratory, California Institute of Technology, under contract with the National Aeronautics and Space Administration. We thank Gary Ferland for providing Cloudy.
References
- (1) Antonucci R., Hurt T., Miller J., 1994, ApJ 430, 210
- (2) Beichmann C.A., Soifer B.T., Helou G., et al., 1986, ApJ 308, L1
- (3) Boller Th., Brandt W.N., Fabian A.C., Fink H.H., 1997, MNRAS 289, 393
- (4) Brandt W.N., Fabian A.C., Pounds K.A., 1996, MNRAS 278, 326 (BFP96)
- (5) Brandt W.N., Mathur S., Reynolds C.S., Elvis M., 1997, MNRAS 292, 407
- (6) Brinkmann W., Siebert J., 1994, A&A 285, 812
- (7) Brinkmann W., Kawai N., Ogasaka Y., Siebert J., 1996, A&A 316, L9
- (8) Brinkmann W., Otani C., Wagner S.J., Siebert J., 1998, A&A 330, 67
- (9) Cappi M., Matsuoka M., Comastri A., et al., 1997, ApJ 478, 492
- (10) David L.P., Harden Jr. F.R., Kearns K.E., et al., 1997, The ROSAT High Resolution Imager (HRI), USRSDC/SAO Calibration Report 1997 June, revised, U.S. ROSAT Science Data Center, SAO, Cambridge, MA
- (11) Dotani T., Yamashita A., Ezuka H., et al., 1997, ASCA News No.5
- (12) Fabian A.C., 1979, Proc. R. Soc. Lond. A. 366, 449
- (13) Ferland G.J., 1993, University of Kentucky, Physics Department, Internal Report
- (14) Goodrich R.W., 1989a, ApJ 340, 190
- (15) Goodrich R.W., 1989b, ApJ 342, 224
- (16) Goodrich R.W., 1990, ApJ 355, 88
- (17) Grevesse N., Anders E., 1989, in Cosmic Abundances of Matter, AIP 183, ed. C.J. Waddington, New York: AIP, p.1
- (18) Hayashida K., 1997, ASP Conf. Series 113, 40
- (19) Iwasawa K., Fabian A.C., Nandra K., 1999, MNRAS in press (astro-ph 9904071)
- (20) Kim D.-C., Sanders D.B., Veilleux S., Mazzarella J.M., Soifer B.T., 1995, ApJS 98, 129
- (21) Komossa S., Bade N., 1998, A&A 331, L49
- (22) Komossa S., Fink H., 1997a, A&A 327, 483
- (23) Komossa S., Fink H., 1997b, A&A 327, 555
- (24) Komossa S., Greiner J., 1999, ASP Conf. Series 161, 228
- (25) Lanzetta M.L., Turnshek D.A., Sandoval J., 1993, ApJS 84, 109
- (26) Lawrence A., Papadakis I., 1993, ApJ 414, L85
- (27) Laurent-Muehleisen S.A., Kollgaard R.I., Ryan P.J., et al., 1997, A&AS 122, 235
- (28) Leighly K.M., 1999, ApJ in press
- (29) Leighly K.M., Mushotzky R.F., Yaqoob T., Kunieda H., Edelson R., 1996, ApJ 469, L147
- (30) Leighly K.M., Mushotzky R.F., Nandra K., Forster K., 1997a, ApJ 489, L25
- (31) Leighly K.M., Kay L.E., Wills B.J., Wills D., Grupe D., 1997b, ApJ 489, L137
- (32) Mathis J.S., Rumpl W., Nordsieck K.H., 1977, ApJ 217, 425
- (33) Miyaji T., Ishisaki Y., Ogasaka Y., et al., 1998, A&A 334, L13
- (34) Morse J.A., 1994, PASP 106, 675
- (35) Murphy E.M., Lockman F.J., Laor A., Elvis M., 1996, ApJS 105, 369
- (36) Osterbrock D.E., Pogge R.W., 1985, ApJ 297, 166
- (37) Otani C., Kii T., Reynolds C.S., et al., 1996, PASJ 48, 211
- (38) Reynolds C.S., Fabian A.C., Nandra K., et al., 1995, MNRAS 277, 901
- (39) Wills B.J., Wills D., Evans N.J., et al., 1992, ApJ 400, 96
- (40) Zimmermann H.U., Becker W., Belloni T., et al., 1994, EXSAS User’s Guide, MPE Report 257