A Measurement of the Coulomb Dissociation of 8B
at 254 MeV/nucleon and the
8B Solar Neutrino Flux
Abstract
We have measured the Coulomb dissociation of 8B into 7Be and proton at 254 MeV/nucleon using a large-acceptance focusing spectrometer. The astrophysical factor for the 7Be(p,)8B reaction at MeV is deduced yielding (exp.) (theo.) eV-b. This result agrees with the presently adopted zero-energy factor obtained in direct-reaction measurements and with the results of other Coulomb-dissociation studies performed at 46.5 and 51.2 MeV/nucleon.
PACs: 25.40.Lw, 25.60.-t, 25.70.De, 26.65.+t
The precise knowledge of the solar thermonuclear fusion of 8B (from 7Be plus proton) is crucial for estimating the 8B solar neutrino flux and the predicted neutrino rates in terrestrial neutrino measurements. The relevant 7Be(p,)8B cross section is parameterized in terms of the astrophysical factor which is defined by where is the Sommerfeld parameter. The flux of 8B solar neutrinos is particularly important for the results of the Homestake, Super Kamiokande, and SNO experiments [1] which measure high-energy solar neutrinos mainly or solely from the 8B decay.
Unfortunately, this cross section has not been known with sufficient accuracy for a long time, despite the fact that several comprehensive direct measurements were reported for the 7Be(p,)8B reaction [2, 3, 4, 5, 6]. The main difficulty in such experiments is the determination of the effective target thickness of the radioactive 7Be target. This difficulty is reflected in the fact that the results of these measurements can be grouped into two distinct data sets which agree in their energy dependence but disagree in their absolute normalization by about 30%. In view of this discrepancy, experimental studies with different methods are highly desirable.
As an alternative approach one can measure the inverse process, the Coulomb dissociation (CD) of 8B into 7Be and proton [7]. The CD yields are enhanced because thicker targets can be used and a larger phase space is available for CD. This method uses stable targets and thus is free from the difficulty of determining the effective target thickness. On the other hand, direct (p,) and Coulomb dissociation measurements have different sensitivities to the multipole composition of the photon fields. The E2 amplitude is enhanced in CD due to the large flux of E2 virtual photons, whereas it can be neglected in the (p,) reaction.
Recently, Motobayashi et al. have performed a CD experiment at B MeV/nucleon, yielding values for in the energy range 0.61.7 MeV [8]. The extracted (p,) cross section is consistent with the results from the lower group of direct-reaction data points [4, 5, 6]. Another measurement at 51.9 MeV/nucleon by the same group with improved accuracy led essentially to the same conclusion [9].
In this article, we report on an experiment of the CD of 8B at a higher energy of 254 MeV/nucleon performed at the SIS facility at GSI, Darmstadt, Germany. The present incident energy has several advantages compared to those used in Refs. [8, 9]: (i) due to the strong forward focusing of the reaction products the magnetic spectrometer KaoS [10] was used for a kinematically complete measurement with high detection efficiency over a wider range of the p-7Be relative energy; (ii) effects that obscure the dominant contribution of E1 multipolarity to the CD, such as E2 admixtures and higher-order contributions, are reduced [11, 12]; (iii) the M1 resonance peak at MeV is excited stronger and therefore can be used to check the accuracy of the invariant-mass calculation.
A 8B beam was produced by fragmentation of a 350 MeV/nucleon 12C beam from the SIS synchrotron impinging on an 8.01 g/cm2 beryllium target. The beam was isotopically separated in the fragment separator (FRS) [13] and transported to the standard target position of the spectrometer KaoS [10]. The average beam energy of 8B at the center of the breakup target was 254.0 MeV/nucleon, a typical 8B intensity was 104/spill with 7s extraction time. Beam particles were identified event by event with the TOF- method by using a plastic scintillator with a thickness of 5 mm placed 68 m upstream from the target and a large-area scintillator wall placed close to the focal plane of KaoS. About 20 % of the beam particles were 7Be, which could however unambiguously be discriminated from breakup 7Be particles by their time of flight.
An enriched 208Pb target with a thickness of 199.7 ( 0.2) mg/cm2 and with an effective area of mm2 was placed at the standard target position of KaoS. The reaction products, 7Be and proton, were analyzed by the spectrometer which has a large momentum acceptance of and an angular acceptance of 140 and 280 mrad in horizontal and vertical directions, respectively. Two pairs of silicon micro-strip detectors, installed at about 14 and 31 cm downstream from the target, measured the x- and y-positions and hence the scattering angles of the reaction products in front of the KaoS magnets. Each strip detector had a thickness of 300 m, an active area of 56 56 mm2, and a strip pitch of 0.1 mm. The energy deposited on each strip was recorded using an analog-multiplexing technique. This configuration enabled us to measure opening angles of the reaction products with a 1-accuracy of 4.8 mrad which is mainly caused by angular straggling in the relatively thick Pb target. By reconstructing the vertex at the target with an 1-accuracy of 0.3 mm, background events produced in the target frame or in the strip detectors could be largely eliminated. The remaining background events were found without the target under the same condition to be less than 0.5% of the true events.
Momenta of the reaction products were analyzed by trajectory reconstruction using position information from the micro-strip detectors and two two-dimensional multi-wire proportional chambers (MWPC) which detected the protons or the Be ions close to the focal plane of KaoS with a position resolution of about 1 mm.
A large-area () scintillator wall [10] consisting of 30 plastic scintillator paddles with a thickness of 2 cm each was placed just behind the MWPC. It served as a trigger detector for the data acquisition system and as a stop detector for time-of-flight (TOF) measurements. To distinguish breakup events from non-interacting beam particles, the TOF wall was subdivided into two equal-size sections. The breakup events were characterized by coincident hits in the low-momentum (proton) and high-momentum (7Be etc.) sections of the wall. The beam normalization was done by analyzing 8B single hits on the high-momentum section (downscaled by a factor of 1000) under the condition (from the tracking information) that they originated from the active target area. From the measured angles and momenta of the breakup products the p-7Be relative energy and the scattering angle of the center-of-mass of proton and 7Be (i.e. the excited 8B) with respect to the incoming beam were reconstructed.
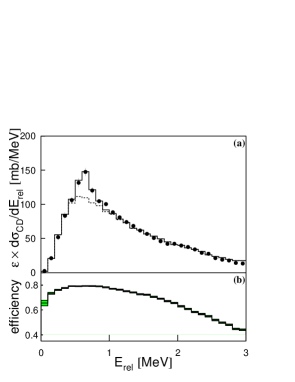
The p-7Be coincidence yield is shown in Fig. 1 (a) as a function of the p-7Be relative energy. It is obvious from the figure that, contrary to the direct measurements, the M1 resonance at MeV is not very pronounced. This is related to the energy resolution of our experiment (see below), and also to the relatively low sensitivity of CD to M1 transitions.
To evaluate the response of the detector system, Monte-Carlo simulations were performed using the code GEANT. The simulation took into account e.g. the finite size of the Si strip and MWPC detectors as well as our inability to discriminate proton and 7Be for very small opening angle where both particles hit the same strip. Events were generated with probabilities proportional to the CD cross section calculated with a semi-classical formula [14]. For the M1 resonance at MeV, the (p,) cross section calculated from the total and gamma widths measured by Filippone et al. [5] was used. The non-resonant contribution was obtained by normalizing the E1 (p,) cross section calculated by Bertulani [15] with a scale factor of 1.20.
Further corrections in the simulation are due to the feeding of the excited state at 429 keV in 7Be. We used the result by Kikuchi et al. [16] who measured the -decay in coincidence with the CD of 8B.
The histograms in Fig. 1(a) show the simulated E1+M1 yields (solid) and E1 yields (dashed). As seen in this figure, the shape and magnitude of the experimental energy dependence are well reproduced. This indicates that the CD yield is well described by a combination of the M1 resonance and the pure E1 continuum. In the lower part of Fig. 1 we show that the total efficiency calculated by the GEANT simulation is high over the entire range covered in our study. From the Monte Carlo simulation we also estimate our relative-energy resolution to be e.g. and 0.22 MeV at and 1.8 MeV, respectively.
In order to estimate upper limits for a possible E2 contribution to our yields, we have analyzed the distributions. Since we did not measure the incident angle of 8B at the target, the experimental angular distributions represent the distributions folded with the angular spread of the incident beam. In Fig. 2, we plot the experimental yield against the scattering angle for three relative-energy bins indicated in the figure; the contribution from the measured beam spread is shown in Fig. 2 (d). The full histograms represent the results of a Monte-Carlo simulation for E1 excitation using the theory of Bertulani[15], normalized to the experimental yield. The M1 transition also contributes to the 0.50.7 MeV bin with the same angular dependence. The simulated E2 angular distributions are also shown by the dashed histogram. The angular resolution was estimated to be 0.35 degrees (1), smaller than the observed widths. As seen in the figure the experimental distributions are well reproduced by the simulation using E1 and M1 multipolarities, and no room is left to add an additional E2 component. The corresponding 3 upper limits for the E2/E1 transition amplitude ratio are calculated from our model as /, and for , 0.50.7, and 1.01.2 MeV, respectively.
Recently, Esbensen and Bertsch have pointed out that interference between E1 and E2 components could play an important role in CD of 8B and should manifest itself in an asymmetry of the longitudinal-momentum distribution of 7Be[17]. Analyzing measured 7Be momentum spectra in term of this model, Davids et al. [18] have deduced / at 0.63 MeV which is much higher than our upper limits above. One should keep in mind, however, that such a strong E2 component need not necessarily affect the extraction of : the dynamical calculation of Esbensen and Bertsch [17] at 45.6 MeV shows that its effect can be much smaller than what is obtained by simply adding E1 and E2 components. Further experimental and theoretical studies are clearly desirable to clarify the magnitude of the E2 component in CD.
From the data and the simulation presented in Fig. 1 (a) we can deduce the astrophysical factors for E1 multipolarity by scaling the theoretical factors by the ratio of observed and simulated counts. The resulting distribution is plotted in Fig. 3 as a function of the p-7Be relative energy, together with existing (p,) [4, 5, 6] and CD [9] results. The (p,) results were scaled to a peak cross section of the 7Li(d,p)8Li reaction of mb [19]. The binning of our data was chosen to be approximately equal to the FWHM of the resolution. The errors shown in Fig. 3 result from summing in quadrature statistical errors and those resulting from uncertainties in the momentum calibration, in the angular cutoff of pure Coulomb processes, and in the feeding of the excited state in 7Be. Since we are mostly interested in the E1 component, the simulated M1 component of the MeV resonance was subtracted from the data. At low , our results agree well with the lower group of the (p,) results [4, 5, 6] and the CD result of Kikuchi et al. [9]. We observe some discrepancies at higher , however, as shown in Fig. 3. While we cannot explain the discrepancy with the RIKEN data [16], since all of the assumptions underlying their and our analysis are identical, the discrepancy to the direct measurements may be due to our neglect of an E2 component which, in a proper theoretical treatment, might affect the high- data points while leaving the low data virtually unchanged (see right-hand panel of Fig.11 in Ref.[17]).
Several theoretical models for 8B have been proposed to predict the shape and magnitude of the energy dependence, such as one-body potential models (see e.g. [11, 15] for recent calculations) or more complex many-body (cluster) models (e.g. [20, 21, 22, 23]). Our data in Fig. 3 follow very closely the results obtained by Bertulani[15] over the entire range of energies as indicated by the solid curve which was normalized to our data points using a scaling factor of 1.20. The shape of the distribution predicted by the cluster model calculation [20], which was favoured by the recent (p,) experiment of Hammache et al. [6], does not agree equally well with our results at the higher energies (dashed line in Fig. 3).
To obtain the zero-energy astrophysical factor, we follow Jennings et al. [24] in fitting the theoretical energy dependence only to data points below MeV (see insert in Fig. 3) since this region should be largely free from uncertainties concerning nuclear excitations. From our two low data points we extracted eV-b where the first contribution results from fitting the data points of Fig. 3 and the second one is related to the uncertainty in extrapolating to zero . This result is compatible with the value of eV-b obtained by Jennings et al. [24] when fitting the combined data points of Refs. [5, 6], and also with the adopted value of eV-b from Ref. [19]. We note, however, that the question of possible backscattering losses of recoiling nuclei in direct (p,) and (d,p) reactions [25, 26] is not yet solved.
We conclude that we have demonstrated that high-energy Coulomb dissociation is very useful for determining the astrophysical -factor of the 7Be(p,)8B reaction at low energies. We have used an analytical formula from the literature [24] to extrapolate our two low-energy -factors to and obtain a value that is consistent with the most recent compilation [19]. This supports essentially the standard-model prediction for the high-energy solar neutrino flux [1].
We are grateful for the technical support by K.H. Behr, A. Brünle, and K. Burkard of the FRS staff. We thank N. Kurz for help with the data acquisition and J. Friese, R. Gernhäuser, E. Badura, and J. Hoffmann for their support in designing and realizing the Si micro-strip detector readout. Constant support and interesting discussions concerning the theoretical aspects were contributed by S. Typel, G. Baur, B.J. Jennings and H. Oberhummer. We thank P. Descouvemont and D. Baye for providing their numerical results.
REFERENCES
- [1] J.N. Bahcall et al., Phys. Lett. B 433, 1 (1998).
- [2] P.D. Parker et al., Astrophys. J. 153, L85 (1968).
- [3] R.W. Kavanagh et al., Bull. Am. Phys. Soc. 14, 1209 (1969).
- [4] F.J. Vaughn et al., Phys. Rev. C 2, 1657 (1970).
- [5] B. W. Filippone et al., Phys. Rev. C 28, 2222 (1983).
- [6] F. Hammache et al., Phys. Rev. Lett. 80, 928 (1998).
- [7] G. Baur and H. Rebel, Annu. Rev. Nucl. Part. Sci. 46, 321 (1996).
- [8] T. Motobayashi et al., Phys. Rev. Lett. 70, 2680 (1994); N. Iwasa et al., J. Phys. Soc. Japan 65, 1256 (1996).
- [9] T. Kikuchi et al., European Phys. J. A 3, 213 (1998).
- [10] P. Senger et al., Nucl. Instr. Meth. A 327, 393 (1993).
- [11] S. Typel and G. Baur, Phys. Rev. C 50, 2104 (1994); S. Typel et al., Nucl. Phys. A 613, 147 (1997).
- [12] C.A. Bertulani, Phys. Rev. C 49, 2688 (1994).
- [13] H. Geissel et al., Nucl. Instr. Meth. B 70, 286 (1992).
- [14] C.A. Bertulani and G. Baur, Phys. Rep. 163 (1988) 300.
- [15] C.A. Bertulani, Z. Phys. A 356, 293 (1996).
- [16] T. Kikuchi et al., Phys. Lett. B 391, 261 (1997), and priv. comm.
- [17] H. Esbensen and G.F. Bertsch, Nucl. Phys. A 600, 37 (1997).
- [18] B. Davids et al., Phys. Rev. Lett. 81, 2209 (1998).
- [19] E.G. Adelberger et al., Rev. Mod. Phys. 70, 1265 (1998).
- [20] P. Descouvemont and D. Baye, Nucl. Phys. A 567, 341 (1994).
- [21] C.W. Johnson et al., Astrophys. J. 392, 320 (1992).
- [22] A. Csótó et al., Phys. Rev. C 52, 1130 (1995).
- [23] L.V. Grigorenko et al., Phys. Rev. C 57, R2099 (1998).
- [24] B.K. Jennings et al., Phys. Rev. C 58 (1998) 3711.
- [25] L. Weissman et al., Nucl. Phys. A 630, 678 (1998).
- [26] F. Strieder et al., Eur. Phys. J. A 3, 1 (1998).