The ROSAT All-Sky Survey Bright Source Catalogue
Abstract
We present the ROSAT All-Sky Survey Bright Source Catalogue (RASS-BSC, revision 1RXS) derived from the all-sky survey performed during the first half year (1990/91) of the ROSAT mission. 18,811 sources are catalogued (i) down to a limiting ROSAT PSPC count-rate of 0.05 cts/s in the 0.12.4 keV energy band, (ii) with a detection likelihood of at least 15 and (iii) at least 15 source counts. The 18,811 sources underwent both an automatic validation and an interactive visual verification process in which for 94% of the sources the results of the standard processing were confirmed. The remaining 6% have been analyzed using interactive methods and these sources have been flagged. Flags are given for (i) nearby sources; (ii) sources with positional errors; (iii) extended sources; (iv) sources showing complex emission structures; and (v) sources which are missed by the standard analysis software. Broad band (0.12.4 keV) images are available for sources flagged by (ii), (iii) and (iv). For each source the ROSAT name, position in equatorial coordinates, positional error, source count-rate and error, background count-rate, exposure time, two hardness-ratios and errors, extent and likelihood of extent, likelihood of detection, and the source extraction radius are provided. At a brightness limit of 0.1 cts/s (8,547 sources) the catalogue represents a sky coverage of 92%. The RASS-BSC, the table of possible identification candidates, and the broad band images are available in electronic form (Voges et al. 1996a) via http://wave.xray.mpe.mpg.de/rosat/catalogues/rass-bsc . 111 The RASS-BSC and the identification table are also available in electronic form at the CDS via anonymous ftp to cdsarc.u-strasbg.fr (130.79.128.5) or via http://cdsweb.u-strasbg.fr/Abstract.html
Key Words.:
catalogs - surveys - X-rays: general1 Introduction
| Satellites | date | energy | number of | References |
|---|---|---|---|---|
| range (keV) | sources | |||
| UHURU | 1970-73 | 2-6 | 339 | Forman et al. (1978) |
| OSO-7 | 1971-73 | 1-60 | 184 | Markert et al. (1979) |
| ARIEL-5 ( bII 10) | 1974-80 | 2-18 | 142 | McHardy et al. (1981) |
| ARIEL-5 ( bII 10) | 1974-80 | 2-10 | 109 | Warwick et al. (1981) |
| HEAO-1/A1 | 1977-79 | 1-20 | 842 | Wood et al. (1984) |
| HEAO-1/A2 | 1977-79 | 0.2-2.8 | 114 | Nugent et al. (1883) |
| HEAO-1/A4 | 1977-79 | 13-180 | 40 | Levine et al. (1984) |
Sky surveys play a major role in observational astronomy, in particular in the era of multi-wavelength observations. Before the launch of the ROSAT satellite several all-sky X-ray catalogues existed based on collimated counter surveys (see Table 1). One of the main scientific objectives of ROSAT was to conduct the first all-sky survey in X-rays with an imaging telescope leading to a major increase in sensitivity and source location accuracy (Trümper 1983). Actually, the ROSAT mirror system (Aschenbach 1988) and the Position Sensitive Proportional Counter (PSPC) (Pfeffermann et al. 1988) used for the survey were primarily optimized for detecting point sources in the all-sky survey. However, the wide angle and fast optics as well as the low detector background of the PSPC provided excellent conditions for studying extended sources like supernova remnants, clusters of galaxies, and the diffuse X-ray background. In this context the “unlimited field of view” of the all-sky survey was of great advantage.
The ROSAT All-Sky Survey (RASS) was conducted in 1990/91, just after the two month switch-on and performance verification phase. The first processing of the ROSAT All-Sky Survey took place in 19911993 resulting in about 50,000 sources. This source list had not been published, because during the analysis a large number of minor deficiencies and possibilities for improvement were discovered. Nevertheless, the data have been extensively used by the scientific groups at MPE and their collaborators for many scientific projects.
Based on the experience with the first RASS processing a second analysis was performed in 19941995, resulting in 145,060 sources (detection likelihood 7). The present publication comprises only the brightest 18,811 of this sample. These data represent by far the most complete and sensitive X-ray sky survey ever published. It is a factor of 20 more sensitive than any previous all-sky survey in X-rays and contains about a factor of 4 more sources than all other X-ray catalogues, which sample only a few percent of the sky.
In this paper we present the outcome of the RASS in terms of “point sources”. For 98.2% of the 18,811 sources the source extent radius is less than 5 arcmin, and for 99.6% the extent is smaller than 10 arcmin. 0.4% of the sources exhibit a larger source extent and show complex emission patterns (see Section 3.2) rather than a point-like spatial distribution. These sources have been included for completeness as they fulfill the selection criteria of the RASS-BSC (hereafter RBSC). Diffuse sky maps with angular resolution of 40 arcmin and diffuse sky maps in six colours of 12 arcmin resolution have been published elsewhere (Snowden et al. 1995, 1997).
In Sect. 2 we summarize the basic properties of the ROSAT All-Sky Survey and of the Standard Analysis Software System (hereafter SASS). The selection strategy for including sources into the RBSC, the screening process, and the content of the RBSC are presented in Sect. 3. The results from the correlation of RBSC sources with various databases are given in Sect. 4. The electronic access to the RBSC is described in Sect. 5.
2 The ROSAT All-Sky Survey
2.1 Observation strategy and exposure map
ROSAT has conducted the first All Sky Surveys in soft X-rays (0.12.4 keV; 1005 Å) and the extreme ultraviolet (0.0250.2 keV; 50060 Å) bands using imaging telescopes (Trümper 1983, Aschenbach 1988, Wells et al. 1990, Kent et al. 1990). The satellite was launched on June 1, 1990 and saw first light on June 16, 1990 (Trümper et al. 1991). The following 6 week calibration and verification phase already included a small fraction of the sky survey (see Table 2). The main part of the survey began on July 30, 1990 and lasted until January 25, 1991. A strip of the sky which remained uncovered, because of operational problems in January, was retrieved in February and August 1991 (see Table 2). The data obtained until 1991 form the basis of the present analysis. The total survey exposure time amounts to 1.031 107s or 119.36 days.
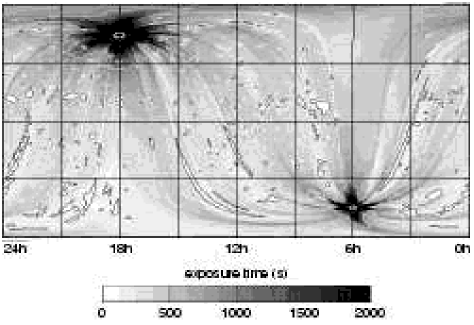
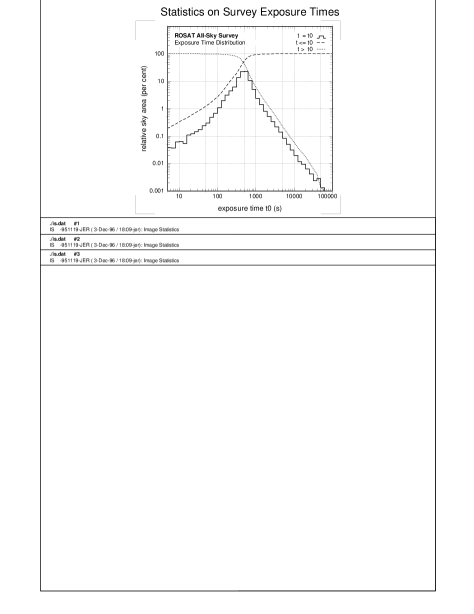
The basic survey strategy of ROSAT was to scan the sky in great circles whose planes were oriented roughly perpendicular to the solar direction. This resulted in an exposure time varying between about 400 s and 40,000 s at the ecliptic equator and poles respectively. During the passages through the auroral zones and the South Atlantic Anomaly the PSPC had to be switched off, leading to a decrease of exposure over parts of the sky (see Fig. 1). The sky coverage as a function of the exposure time is displayed in Fig. 2. For exposure times larger than 50 seconds the sky coverage is 99.7% for the observations until 1991.
| Dates | ROSAT days | Detector | |||||
|---|---|---|---|---|---|---|---|
| 1990 | Jul | 11 - | 1990 | Jul | 16 | 41–45 | PSPC-C |
| 1990 | Jul | 30 - | 1991 | Jan | 25 | 60–242 | PSPC-C |
| 1991 | Feb | 16 - | 1991 | Feb | 18 | 263–264 | PSPC-B |
| 1991 | Aug | 03 - | 1991 | Aug | 13 | 435–444 | PSPC-B |
2.2 SASS processing
The first analysis of the all-sky survey data was performed for strips of containing the data taken during two days. These strips were analysed using various source detection algorithms, comprising two sliding window techniques (differing in how the background was determined) and a maximum-likelihood method. A list of X-ray sources (RASS-I) was produced which included information about sky position and source properties, such as count-rate, hardness-ratios, extent, and source detection likelihoods. The main aim of this analysis was to supply almost immediate information about the X-ray sources and to allow a fast quality check of the survey performance.
The RBSC presented in this paper is based on the so-called RASS-II processing which is described below in Sect. 2.2.1–2.2.3.
2.2.1 Advantages of the RASS-II processing
The main differences between the RASS-II data processing and the RASS-I processing are as follows: (i) the photons were not collected in strips but were merged in 1,378 sky-fields of size , so that full advantage was taken of the increasing exposure towards the ecliptic poles; (ii) neighbouring fields overlapped by at least 0.23 degrees, to ensure detection of sources at the field boundaries, which posed a problem in the first processing; (iii) a new aspect solution reduced the number of sources with erroneous position and morphology; (iv) the calculation of the spline-fitted background map was improved, resulting in better determined count-rates; (v) the candidate list for the maximum-likelihood analysis (see Sect. 2.2.2) was enlarged by lowering the threshold values for the two preceding sliding window source detection algorithms, and by changing the acceptance criteria to allow very soft and very hard sources to be included; and (vi) photons obtained with poor aspect solutions were no longer accepted.
2.2.2 Source detection algorithm
The source detection algorithms of the SASS processing can be divided into 6 different steps:
1. The local-detect method
The local-detect algorithm is based on a sliding window technique. It was
already successfully used for the analysis of EINSTEIN data and has been
modified for ROSAT. A window of pixels is moved across the binned
photon images. These images are produced by binning the data into 512 by 512
pixel images with a pixel size of 45 arcsec for three energy bands (broad:
Pulse Height Amplitude (PHA) channels 11–235 (0.12.4 keV), soft: channels
11–41 (0.10.4 keV), hard: channels 52–201 (0.52.0 keV)). The contents
of the pixels inside the detection cell are added and compared with the local
background taken from the 16 pixels surrounding the pixel
detection window. To detect also extended sources the size of the detection
cell is increased systematically by keeping the ratio of the areas of
background and source windows fixed at 16/9.
2. The background map
Using the source list produced in three energy bands by the local-detect
method, circular regions are cut out around each source position. The radius
of the circle is dependent on the detection cell size. The resulting
“swiss-cheese”-images are fitted by a two-dimensional spline function to
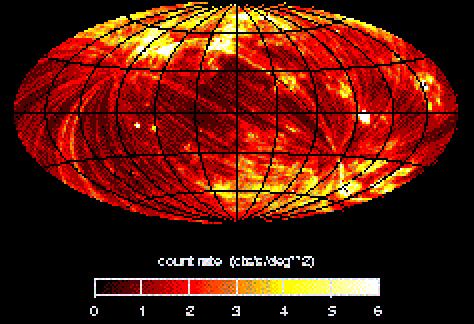
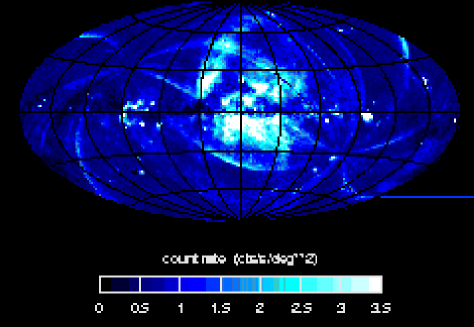
fill the holes and to generate three energy dependent background maps. In Fig.
3 we show the background maps in the soft and hard energy bands in galactic
coordinates.
3. The map-detect algorithm
The map-detect algorithm produces a second source list by repeating the
sliding window search, using a pixel window and the spline
fit to the background. Again sources are searched for in three energy bands
and with varying cell size.
4. Merging of source lists
The source lists from the local- and map-detection algorithms are
merged and are further used as input lists to steps 5 and 6.
5. Determination of source extraction radius
A preliminary extent of the source counts is derived from the radial
distribution of counts in annuli centered on the source position. This extent,
with a minimum being fixed at 300 arcsec, is baselined as an extraction radius
for the selection of the photons used in the subsequent maximum-likelihood
detection algorithm.
6. The maximum-likelihood method
The merged source lists are used as input to the maximum-likelihood method
(Cruddace et al. 1987). In contrast to the previously described detection
algorithms this method takes into account the position of each individual
photon. This allows a proper weighting of each photon with the instrument
point spread function, which is a strong function of off-axis angle. The
high-resolution photons in the center of the PSPC are weighted higher than the
off-axis photons. The maximum-likelihood method provides a source position and
existence likelihood in the broad band. With this position fixed, the
detection likelihood in each of the 4 energy bands A (PHA channels 11–41), B
(52–201), C (52–90), D (91–201) is calculated. Vignetting is taken into
account for each photon using an analytic fit, leading to a mean vignetting
factor for each source. Source extent and its likelihood are derived using
just the broad band data, assuming that the point response function and the
surface brightness are 2-D Gaussian functions, that they are independent of
photon energy, and that the background is uniform in annular rings concentric
around the optical axis.
For strong sources various techniques are applied in the SASS to quantify the likelihood for time variability and to perform spectral fits. This information is not included in the present version of the RBSC.
2.2.3 Parameters derived from the RASS-II processing
In the following section a few basic source parameters from the RASS-II
processing
are described. A complete description of the derived source parameters is
given at
http://wave.xray.mpe.mpg.de/rosat/documentation/
productguide
and a description of the catalogue entries of the RBSC is available at
http://wave.xray.mpe.mpg.de/rosat/catalogues/rass-bsc.
A source count-rate corrected for vignetting is given in the broad band. Two
hardness ratios HR1 and HR2 are calculated, which represent X-ray colours.
From the source counts in the band A and the band B HR1 is given by:
HR1=(B–A)/(B+A). HR2 is determined from the source counts in the bands C and
D by: HR2=(D–C)/(D+C). Since background subtraction is involved, the source
counts in some bands may be negative. These negative counts have been set to
zero, so that HR1 or HR2 becomes –1 or +1. Note that HR2 is a hardness ratio
constructed in the hard region, since bands C and D together contain the same
channels as the hard band B. Thus HR1 near –1 and HR2 near +1 is no
contradiction. Hardness ratio errors greater than 9.99 have been set to 9.99.
Each source has been assigned a ’priority’ parameter, the leftmost 6 characters of which denote the detection history before the maximum-likelihood algorithm was applied. These are: 1=M–broad, 2=L–broad, 3=M–hard, 4=L–hard, 5=M–soft, 6=L–soft. Here M and L stand for the map-detect algorithm and the local-detect method, respectively. Broad, hard and soft refer to the energy bands defined above. A flag is set to 0 for no detection or 1 for detection.
The source extent (ext in the RBSC) is defined as the excess above the width of the point spread function given in arcsec. In addition, the likelihood (extl) for the source extent and the extraction radius in arcsec for a source (extr) used in the maximum-likelihood method are provided.
3 The ROSAT Bright Source Catalogue
3.1 Selection criteria
The total number of sources found in the RASS II is 145,060 (detection likelihood 7). From this database the RBSC was selected according to the following criteria: (i) the detection likelihood is 15; (ii) the number of source photons is 15 and (iii) the source count-rate in the (0.12.4 keV) energy band is 0.05 , resulting in 23,394 sources. These sources underwent an intensive screening process, which is described in the following section.
3.2 Screening process
In order to ensure a high quality of the catalogue, the images of all sources which fulfill the above mentioned criteria were individually inspected.
An automatic as well as a visual screening procedure was applied to all 1,378 sky fields. The automatic procedure searched for sources with overlapping extraction radii, as the count-rate determination can be affected in such cases. These sources were colour-coded in the subsequent visual inspection process.
The visual inspection process is based on ROSAT All-Sky Survey images in the broad, soft and hard energy bands. The SASS position for each RBSC source as well as the extraction radius were marked in the various images. This enables the identification of regions on the sky where the detection algorithm had split sources into multiple detections, and verifies that the source extraction radius and the source position are correct. In addition, sources which were missed by the detection algorithm can be found. During the visual screening process source parameters from the SASS could be checked interactively, using software tools from the Extended Scientific Analysis System (EXSAS, see Zimmermann et al. 1994). The reliability of the screening process was verified in different ways. 100 of the 1,378 sky fields were used as training sets for the screening process and were analysed by more than one person to minimize the deviations in the flag setting. The results of the flag setting were again visually inspected.
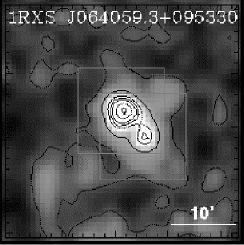
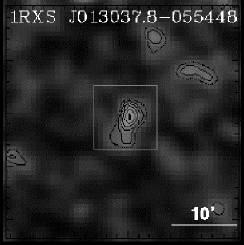
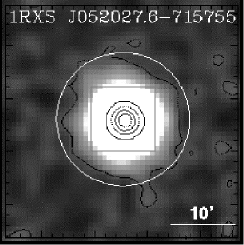
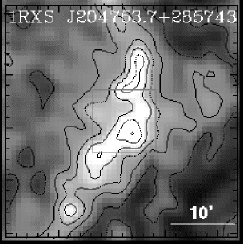
About 16% of the 23,394 sources were found to be spurious detections (mainly in large extended emission regions like the Vela Supernova remnant and the Cygnus Loop) which have been removed from the final source list. The remaining 18,811 sources are included in the present version of the RBSC. For 94% of these sources the SASS parameters were confirmed, and the remaining 6% of the sources have been flagged. The source flags applied to RBSC sources are defined in the following paragraphs (see Fig. 4 for examples of flagged RBSC sources).
(i) nearby flag
This flag is set when the distance between two sources is less than the sum of
the individual extraction radii. The count-rate might be wrong in such cases.
The nearby flag is given to both sources, when their count-rate ratio is
less than a factor of 5. If one source exhibits a count-rate which is at least
5 times higher than that of the weaker source, the nearby flag is given only
to the weaker source. In such cases, the count-rate of the brighter source is
not affected significantly. The nearby flag was given to 588 sources.
(ii) position error
Whenever the source position is obviously not centered on the source
extraction cell the position flag is applied. We did not correct the positions
as there may be several different reasons for this problem (e.g. asymmetric
elongated emission patterns, multiple emission maxima in the detection cell).
The position error flag was applied to 317 sources and a broad band
image provided for each one.
(iii) source extent larger than the source cell
size extraction radius.
The standard analysis software fails in some cases to find the correct source
extent, with the result that the count-rates are usually underestimated. All
of these marked sources underwent a post-processing step to quantify whether
the source extent is indeed larger than the value found by the standard
analysis software. The number of sources marked with the source extent
flag was 225. A broad band image is available for inspection and the new
extraction radius is indicated by a white circle.
(iv) complex emission patterns
The SASS count-rate as well as the source position may be uncertain for
sources which show complex emission patterns. 177 sources were flagged in the
visual process. The flag serves as a warning that the SASS count-rate and
position may be uncertain. A broad band image is available for inspection.
(v) Sources missed by the detection algorithm
In the visual inspection process sources were found, which were missed by the
standard analysis software system. The number of such sources included into
the RBSC is 49. Their main parameters, count-rate, exposure time, and position
were determined in an interactive process using EXSAS tools.
3.3 Statistical properties
3.3.1 Sky- and count-rate distributions

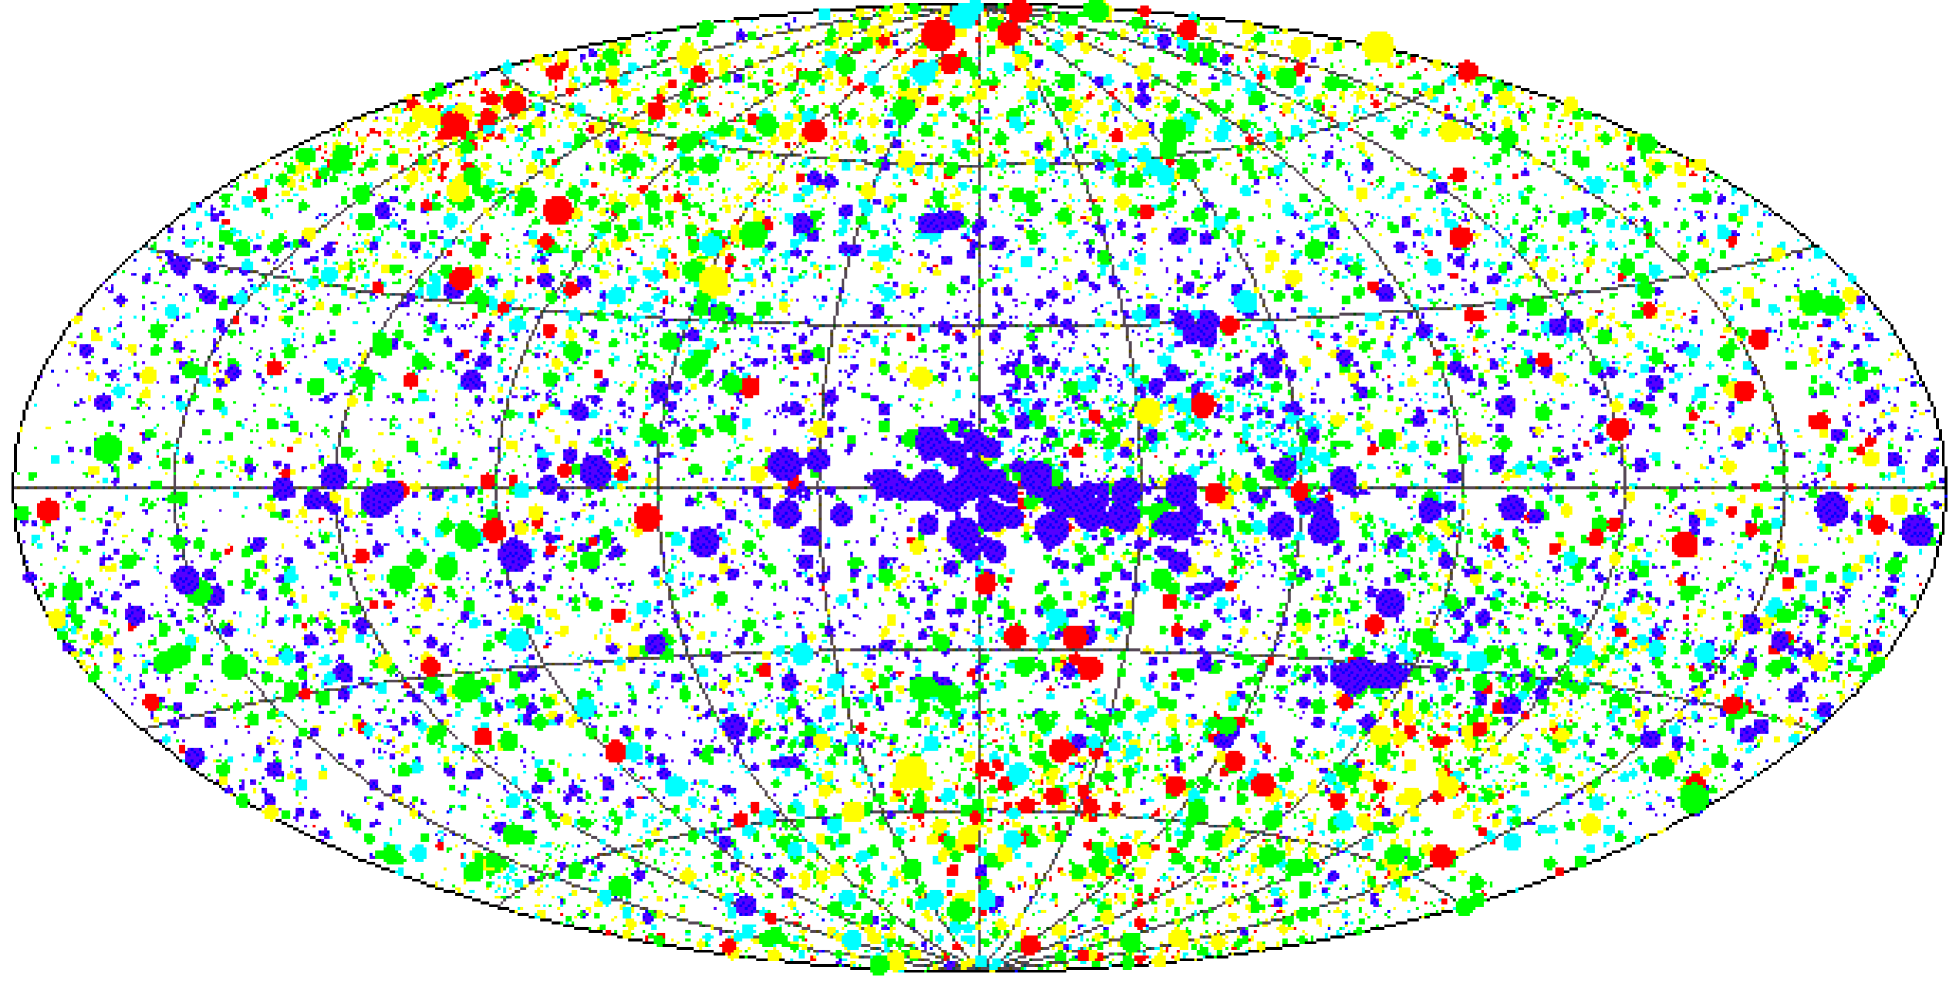
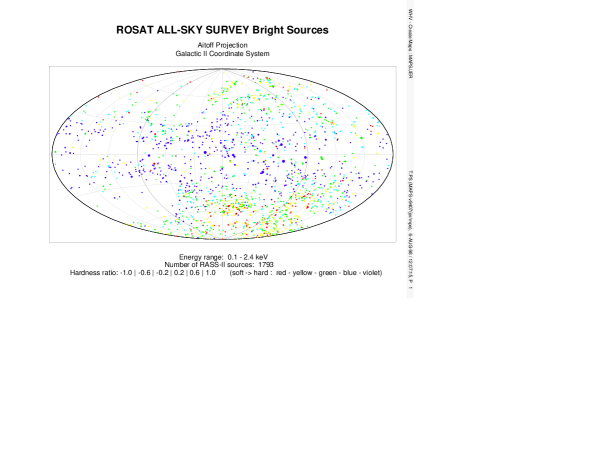
In Fig. 5 we present the sky distribution of all RBSC sources in galactic coordinates. The size of the symbols scales with the logarithm of the count-rate and the colours represent 5 intervals of the hardness ratio HR1. The distribution of RBSC sources shows the clustering of the bright () hard X-ray sources in the galactic plane, well known from the UHURU and HEAO-1 sky surveys. At fainter count-rates () the source distribution is more uniform. This is illustrated in Fig. 6, where we compare the cumulative number count distributions for sources in the galactic plane () and outside the galactic plane (). A linear fit to the distribution of all sources outside the galactic plane (thick line in Fig. 6) results in a slope of –1.30 0.03. The faint line in Fig. 6 represents the count-rate distribution for the galactic plane population of RBSC sources. The histogram shows a break at a count-rate of about 1.3 . A linear fit to the distribution above this break-point gives a slope of –1.20 0.04; the slope below the break-point is –0.72 0.06. The flattening of the log N–log (count-rate) of the galactic plane distribution at the bright end is due to the disk population of bright X-ray sources (see Fig. 5).
The effect of interstellar photoelectrical absorption is demonstrated in Fig. 5 by the fact that sources near the galactic plane exhibit higher values of the hardness ratio HR1 (blue symbols) than sources outside the galactic plane. Although both galactic and extragalactic objects show a large spread in their spectral energy distribution in the ROSAT band (e.g. when simple power-law models were fit to the ROSAT spectra of broad and narrow line Seyfert 1 galaxies, the photon indices ranged between about 2 and 5), the dominant effect here is probably the larger amount of absorption within the galactic plane.
3.3.2 Exposure time, hardness ratios, detection likelihood and source extent distributions
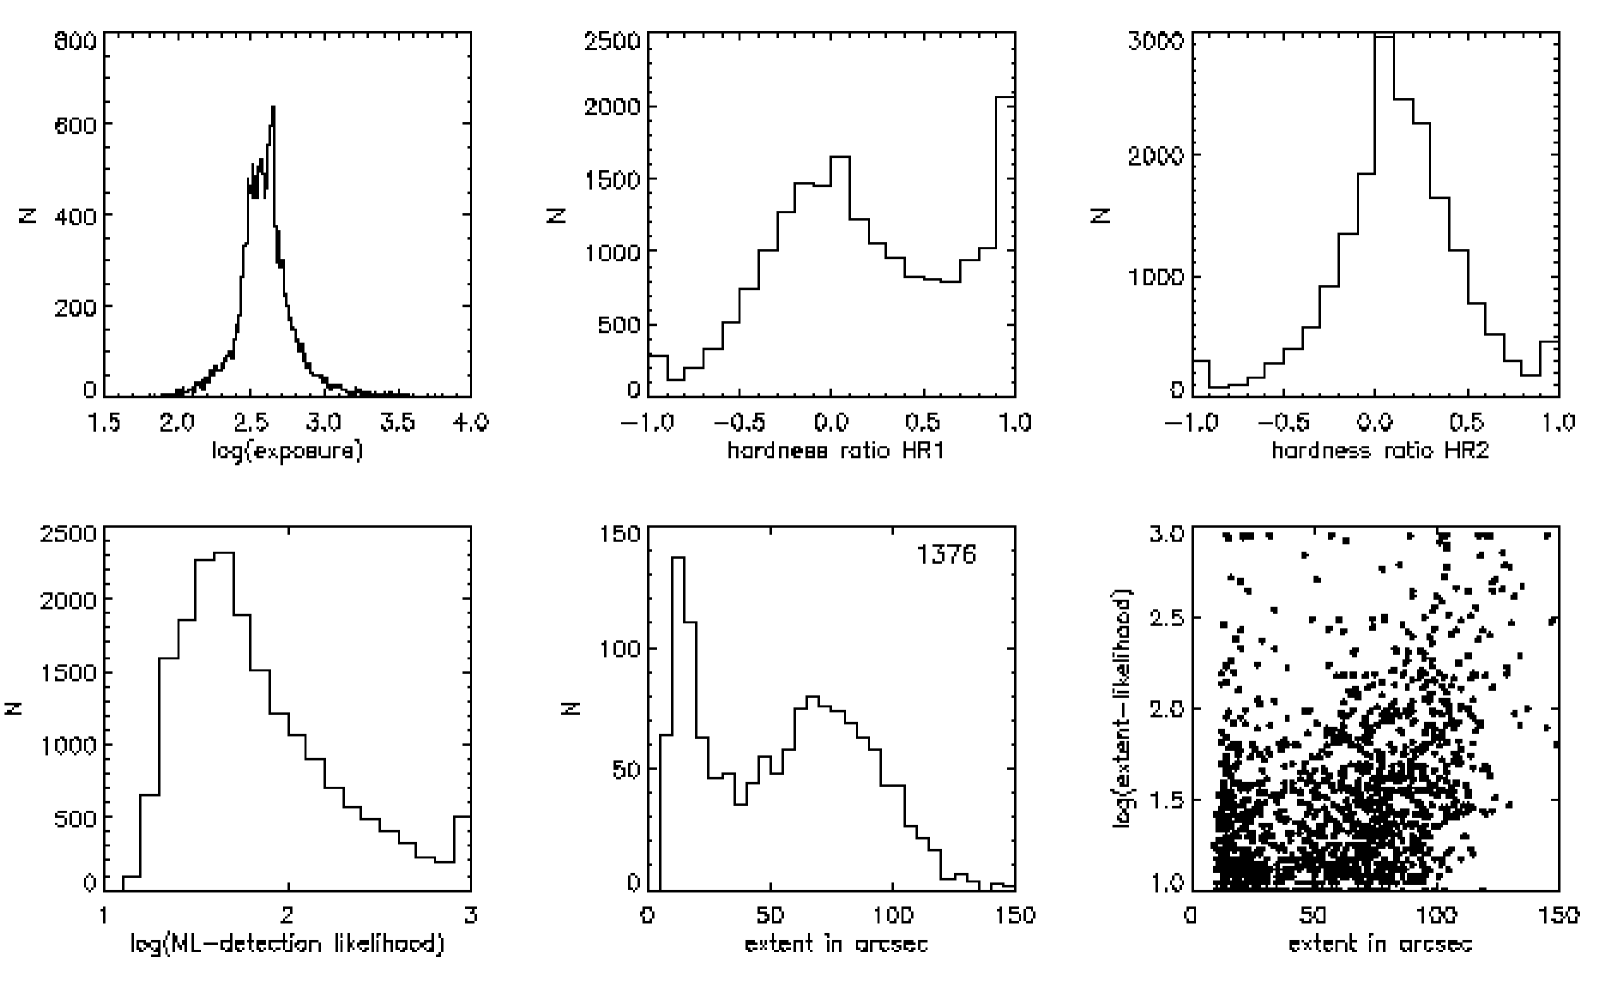
In Fig. 7 we present the distributions of some source parameters of the RBSC. For most of the sources (see the upper left diagram) the exposure time is of the order of a few hundred seconds. The HR1 and HR2 distributions of the RBSC sources binned in intervals of 0.1 are shown in the upper middle and right diagrams, respectively. This gives a more detailed representation of the HR1 distribution compared to Fig. 5, where only 5 bins were used. The distribution of the source detection likelihood is shown in the lower left diagram. The lower value of 15 is set by the source selection criterion for RBSC sources. The last two diagrams show the distribution of the source extent and the extent-likelihood as a function of extent. A more detailed discussion of the RBSC source parameter distribution for different object classes can be found in Sect. 4.
3.3.3 Positional accuracy

The RBSC sources were correlated with the TYCHO catalogue (Høg et al. 1998) to assess the positional accuracy. As TYCHO contains only stars, this correlation gives the positional accuracy of point-like sources. Figure 8 shows the result from the correlation of the RBSC for a search radius up to 120 arcsec with the TYCHO catalogue entries. The comparison shows that 68% (90%) of the RBSC sources are found within 13 arcsec (25 arcsec) of the optical position.
3.3.4 Temporal variability of RBSC sources
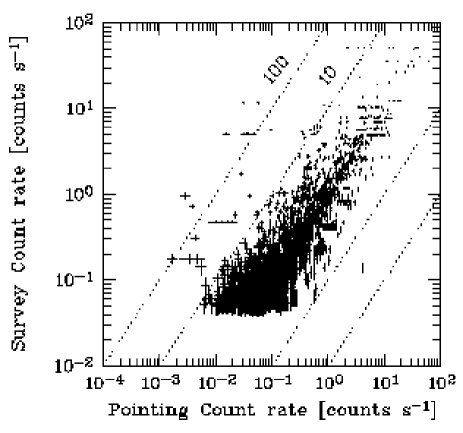
We have investigated the temporal variability of RBSC sources on time scales of months to years by comparing the ROSAT All-Sky Survey observations with public pointed ROSAT PSPC observations (see also Voges & Boller 1998). The comparison was done with a search radius of 60 arcsec around the RBSC source position. The resulting number of RBSC sources which have counterparts in ROSAT public pointed observations is 2,611. Figure 9 shows the ROSAT survey count-rate versus the pointing count-rate for these sources. Sources showing a factor of variability above 5 (109), were visually inspected, similar to the screening process performed for the RBSC sources described in Section 3.2, to ensure the reliability of the source existence and of the source count-rate. 20 RBSC sources exhibit a factor of variability between 10 and 100. 5 RBSC sources show a factor of variability above 100. There is an excess of sources with factors of variability above 10, which are brighter during the RASS observations. This is most probably due to the fact, that during the RASS observations the count-rate threshold for the source detection is on average higher with respect to ROSAT pointed observations. As a result, the RBSC sources shown in Fig. 9 are biased towards sources with extreme variability. A comprehensive variability analysis of ROSAT sources will be presented elsewhere.
3.3.5 Flux determination and log Nlog S distributions
In order to facilitate the use of the catalogue for statistical studies it may be useful to quote not only count-rates but photon fluxes. To convert count-rates into fluxes in the 0.1–2.4 keV energy range we have used two different models: Model 1 assumes a power law and may be useful for AGN and clusters of galaxies. We use a fixed photon index of , which is the typical value derived from ROSAT observation of extragalactic objects (see Hasinger et al. 1991, Walter & Fink 1993), and an absorbing column density fixed at the galactic value along the line of sight (Stark et al. 1992). These fluxes, corrected for galactic absorption, are called flux1. Model 2 is based on an empirical conversion between count-rates and fluxes following Schmitt et al. (1995), originally developed to obtain flux values for stars:
Both flux values are listed in the electronic form of our catalogue.
For a statistical study we use both fluxes for three types of objects, stars from the TYCHO catalogue, clusters of galaxies (ACO) from the compilation of Abell et al. (1989) and AGN listed in the Veron catalogue. We have further subdivided the samples in two categories; A: point sources having an extent-likelihood value of zero; B: sources with an extent-likelihood 0.
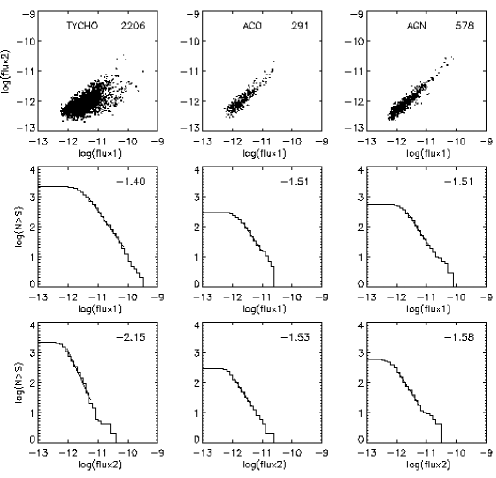
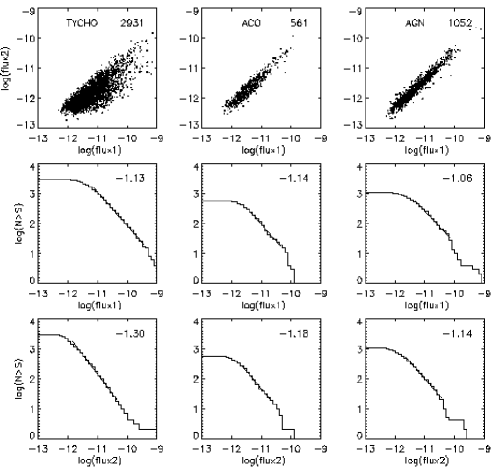
In Fig. 10 we compare the two different flux determinations for the three object classes mentioned above which fall into category A. For TYCHO stars we obtain the largest dispersion between the two methods (left plot in the upper panel). The differences in fluxes are most likely due to the correction for the galactic absorption. The first method tends to overestimate the flux, as the galactic hydrogen column density is taken along the full line of sight. The true value is lower than the value taken in the computation of flux1. For stars the flux determination with method 2 is more reliable than method 1. A much smaller dispersion is found in comparing flux 1 and flux 2 for ACO and AGN. This is probably explained by the fact that both source populations are detected at high galactic latitudes, where the amount of galactic absorption is considerably smaller than in the galactic plane.
In Fig. 11 we compare the two different flux methods for the three object classes which fall into category B. Again, for TYCHO stars we obtain the largest dispersion between the two methods (left plot in the upper panel). The differences in fluxes are due most likely to the correction for the galactic absorption. As in Fig. 10, a smaller dispersion is found for ACO and AGN objects.
The log Nlog S distributions for the three object classes of category A are shown in the middle panel (using flux1 values) and in the lower panel (using flux2 values) of Fig. 10. We want to stress that we did not apply any corrections concerning the varying sensitivity of the survey to the log Nlog S distributions. To determine the slope a linear fit was made to the distribution, starting at the turn-over point of the distribution and ending where the cumulative number count dropped below 15. For ACO and AGN we derive slopes of the log Nlog S distribution close to –1.5, which is the expected slope for an Euclidean source distribution, for both flux determination methods. For stars the log Nlog S distribution is unreliable for flux1 as discussed before. The flux2 distribution for stars (lower panel) is very steep for category A. We have no good explanation for this steep slope. This requires further investigation.
The log Nlog S distribution for the three object classes of category B are shown in the middle (using flux1 values) and lower panels (using flux2 values) of Fig. 11. The log Nlog S distributions and their slopes for ACO and AGN objects are comparable with each other for both object types and both flux determination methods.
However, there is a general difference in the slopes for category A and category B sources. For example, the slope for ACO is –1.51 in category A (extl = 0) and –1.14 in category B (extl 0). There are various explanations possible for the flatter logNlog S distribution, such as: a) the count-rate determination for extended sources is underestimated by the SASS; this effect is largest for the fainter X-ray sources; b) the source detection probability for faint extended sources decreases more rapidly than for point sources; c) the probability to assign an extent likelihood value to a detected source decreases with decreasing source count-rate. This effect is stronger for faint extended sources as compared to point-like sources.

Cases a,b and c are well-known software deficiencies in SASS. Various methods have been developed by Böhringer et al. (1998) (growth curve method), DeGrandi et al. (1997) (steepness ratio technique), Ebeling et al. (1993) (Voronoi, tesselation and percolation method), and Wiedenmann et al. (1997) (Scaling index method), to attack this problem, in particular for the study of clusters of galaxies.
4 Correlation with existing data bases
We have performed a cross-correlation of the RBSC with various catalogues. These catalogues include public data bases like the NED or SIMBAD and the latest versions of published catalogues or catalogues in print, as well as lists which were made available to us by private communications from the following alphabetically listed authors: Alcala et al. (1995, 1996, 1998) (T-Tauri stars), Appenzeller et al. (1998) (optical identifications of northern RASS sources), Bade et al. (1998) (The Hamburg/RASS Catalogue of optical identifications), Berghöfer et al. (1996) (OB-stars), Beuermann et al. (1999) (identification of soft high galactic latitude RASS X-ray sources), Boller et al. (1998) (IRAS galaxies), Buckley et al. (1995), Burwitz et al. (1996a, 1996b) (individual stellar and cataclysmic variables candidates), Covino et al. (1997), Danner (1998) (stellar candidates in star forming regions), Fleming (1998), Fleming et al. (1995, 1996), (EINSTEIN extended medium sensitivity survey as well as white dwarf and M dwarf detections), Gregory & Condon (1991), Gregory et al. (1996) (radio sources), Haberl et al. (1994), Haberl & Motch (1995) (intermediate polars), Hakala et al. (1993) (cataclysmic variable sources), Harris et al. (1994) (EINSTEIN catalogue of IPC sources), Schwope et al. (1999) (identifications of RBSC sources), Hoffleit & Warren (1991) (WFC Bright source catalogue), Hünsch et al. (1998a, 1998b, 1999) (bright and nearby giant, subgiant and main-sequence stars), Kock (1998), Kock et al. (1996), Krautter et al. (1997), Kunkel (1997) (T-Tauri stars), Laurent-Muehleisen et al.(1998) (spectroscopic identification of AGN in the RASS-Green Bank catalogue), Law-Green et al. (1995), Magazzu et al. (1997) (T-Tauri stars), Mason et al. (1992) (white dwarfs), Metanomski et al. (1998) (photometry of F, G and K stars in the RASS), Motch et al. (1996, 1997a, 1997b, 1998) (Galactic plane survey), Nass et al. (1996) (Hamburg catalogue of bright source identifications), Neuhäuser et al. (1995, 1997) (T-Tauri stars), Perlman et al. (1996) (BL Lacertae objects), Romer et al. (1994) (clusters of galaxies), Schmitt (1997) (A, F and G stars in the solar vicinity with distances less than 13 pc), Schmitt et al. (1995) (K and M stars in the solar vicinity with distances less than 7 pc), Staubert et al. (1994) (cataclysmic variable sources), Stern et al. (1995) (RASS identifications in the Hyades cluster), Thomas et al. (1996, 1998) (optical identification of RASS sources), Wagner et al. in preparation (BL Lacertae objects), Wei et al. in preparation (quasars), Wichmann et al. (1996, 1997) (T-Tauri stars), Xie et al. (1997) (active galactic nuclei). These catalogues result in significant measure from follow-up optical observations of ROSAT sources. In these many campaigns extensive use was made of the COSMOS (MacGillivray and Stobie (1985); Yentis et al. (1992)) and APM (McMahon & Irwin (1992)) digitised sky surveys.
| CATALOGUE | Entries | 300 | 300 | search | bkg. | rad. | rad. | rad. | all | near. | References |
| all | near. | rad.(sr) | cont. | 68% | 90% | 95.5% | sr | sr | |||
| SIMBAD | 956370 | 26931 | 11687 | 82 | 9.09 | 18 | 47 | 65 | 12637 | 8221 | CDS, France (1998) |
| NED | 800000 | 38675 | 9103 | 108 | 17.31 | 20 | 60 | 86 | 15873 | 6826 | Helou et al. (1995) |
| TYCHO | 1058332 | 16737 | 10274 | 42 | 3.63 | 12 | 21 | 28 | 6156 | 5465 | Høg et al. (1998) |
| FIRST | 437429 | 7678 | 2516 | 58 | 15.74 | 16 | 42 | 51 | 1544 | 978 | White et al. (1997) |
| NVSS | 1814748 | 23991 | 11544 | 44 | 12.83 | 18 | 33 | 39 | 3594 | 3437 | Condon et al. (1998) |
| VERON | 15106 | 1936 | 1826 | 76 | 0.77 | 11 | 20 | 27 | 1718 | 1701 | Veron-Cetty & Veron (1998) |
| RITTER | 414 | 155 | 155 | 46 | 2.52 | 8 | 17 | 26 | 149 | 149 | Ritter & Kolb (1998) |
| PRIVATE | 13483 | 10790 | 7744 | 102 | 0.17 | 9 | 17 | 24 | 10676 | 7699 | see Sect. 4 |
| ROSATP3 | 82325 | 11106 | 3631 | 86 | 5.89 | 23 | 48 | 65 | 6677 | 3300 | Voges et al. (1996b) (*) |
| ROSAT-WGA | 68907 | 9451 | 3057 | 120 | 7.51 | 28 | 58 | 80 | 6624 | 2908 | White et al. (1994) (*) |
| ROSHRI | 7622 | 3801 | 869 | 112 | 4.83 | 14 | 33 | 52 | 2682 | 844 | ROSAT RRA consortium (1999) (*) |
| ROSAT-WFC | 688 | 605 | 436 | 92 | 1.23 | 24 | 47 | 60 | 593 | 429 | Mason et al.(1995), Pye et al. (1995) |
| EUVE | 549 | 322 | 319 | 98 | 4.01 | 49 | 68 | 80 | 308 | 307 | Bowyer et al. (1996) |
| IRAS-FSC | 173044 | 4049 | 3711 | 62 | 3.70 | 21 | 37 | 48 | 2205 | 2200 | Moshir et al. (1989) |
| IRAS-PSC | 245889 | 3923 | 3300 | 58 | 5.86 | 19 | 38 | 50 | 1566 | 1562 | IRAS Cats. & Atlases Suppl. (1988) |
| CATALOGUE | Entries | 60 | 60 | search | bkg. | rad. | rad. | rad. | all | near. | References |
| all | near. | rad.(sr) | cont. | 68% | 90% | 95.5% | sr | sr | |||
| HST-GSC | 25239690 | 26216 | 12352 | 24 | 13.92 | 11 | 18 | 22 | 15824 | 9759 | Lasker et al. (1990) |
Table 3 is a compilation of all catalogues used. In the identification process discussed in this section we use a search radius of 90 arcsec around the RBSC position. For 90% of all RBSC sources at least one counterpart has been found in either one of the catalogues (not taking into account ROSATP3, ROSAT-WGA, and ROSHRI pointing catalogues), whereas 10% have no catalogue entries. We have divided the RBSC sources with catalogue counterparts into two subclasses, (i) unique entries and (ii) multiple entries (see Fig.12). Unique entries refer to RBSC sources which have only one catalogue entry in the various catalogues, or which have a unique identification in the private catalogues. The number of RBSC sources which have unique entries is 7,117. Only these sources are used in the following to derive observational properties, like the ratio of the optical- to X-ray flux. For 9,900 RBSC sources more than one counterpart is detected within the 90 arcsec search radius. RBSC sources with multiple entries are not included in the discussion below. From the 7,117 unique entries 42% are classified as extragalactic objects and 58% are of galactic origin. The extragalactic objects are subdivided into galaxies, including active and non-active galaxies, and clusters of galaxies. 2,553 RBSC sources are identified as galaxies and 413 as galaxy clusters.
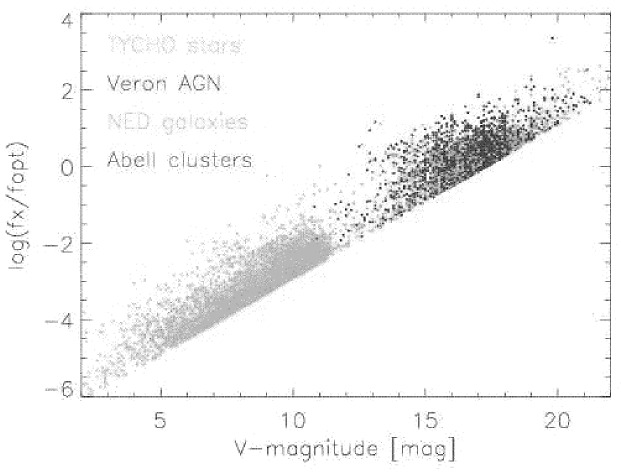
The ratio of the X-ray-to-optical flux is a useful discriminant of the nature of the X-ray source, in particular in discriminating between stars and extragalactic objects. Figure 13 shows a correlation of the flux ratio with the optical magnitude for a sample of RBSC sources already identified as stars, AGN, or clusters of galaxies. The gap between stars and AGN/ACO is partly an artifact as star catalogues become incomplete at .

Description of the columns:
| Col | abbreviation | description |
|---|---|---|
| 1 | SrcNam | the ROSAT All-Sky Survey Catalogue source name |
| 2 | R.A. | Right Ascension (2000) in decimal degrees |
| 3 | Dec. | Declination (2000) in decimal degrees |
| 4 | ?p | the total positional error (–radius) in arcsec, including 6” systematic error |
| 5 | npedm | screening flags (’T’ for ’true’, ’F’ or ’-’ for ’false’, ’.’ for ’not used’) with the following denomination: n for nearby sources affecting SASS flux determination, p for possible problem with position determination, e for source extended beyond SASS extraction radius, d for complex diffuse emission pattern, m for source missed by SASS |
| 6 | riv. | additional flags which are abbreviated with: r source counts and extraction radius recalculated, i for broad band image available, v for variability flag (not yet filled); . is a dummy flag |
| 7 | src-cps | source count-rate (vignetting corrected) in the broad band in counts/sec |
| 8 | ?src-cps | error of source count-rate in the broad band in counts/sec |
| 9 | bgr-cpsa | background count-rate (vignetting corrected) in counts/sec/arcmin2 |
| 10 | exp | exposure time in sec |
| 11 | hr1 | hardness ratio 1 (as explained in Sect. 2.2.3.) |
| 12 | ?hr1 | error of hardness ratio 1 |
| 13 | hr2 | hardness ratio 2 (as explained in Sect. 2.2.3.) |
| 14 | ?hr2 | error of hardness ratio 2 |
| 15 | ext | source extent in arcsec |
| 16 | extl | likelihood of source extent |
| 17 | srcl | likelihood of source detection defined as srcl = –ln (1 – P) (P = probability of source existence) |
| 18 | extr | extraction radius in arcsec |
| 19 | PriFlgE | priority flags derived from the sliding window detection history using either the background map (M) or the local background (B) where 0 = no detection and 1 = detection with the order of flags: M–broad, L–broad, M–hard, L–hard, M–soft, L–soft; E indicates the PHA range with highest detection likelihood (as explained in Sect. 2.2.2.) |
| 20 | vigf | vignetting factor |
| 21 | orgdat | date (yymmdd) when the source was included |
| 22 | moddat | date (yymmdd) when the source properties were changed |
| 23 | # id | number of possible identification objects found within a search radius of 5 arcmin |
| 24 | field-id src# | the identification number of the SASS field, and the SASS source number |
| 25 | # | running source number |
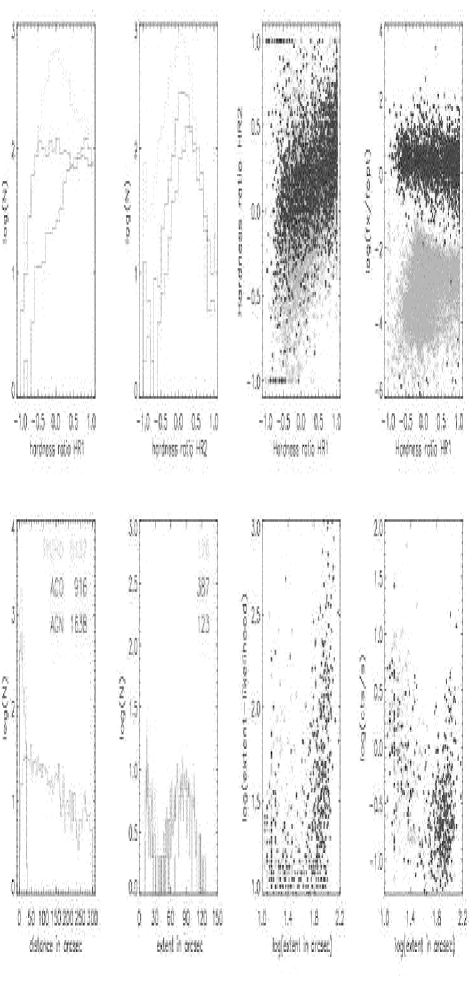
In Fig. 14 we compare results of the analysis of RBSC sources for Tycho stars, clusters of galaxies and active galactic nuclei. The distribution of ACO objects show a strong increase towards larger HR1 values, i.e. the majority of ACO objects are much harder as compared to stars and AGN. The AGN show a flat distribution in the range between –0.5 to +1.0. Below HR1=0.5 the distribution drops quite rapidly due to galactic absorption and due to an intrinsic dispersion in the slopes of the X-ray continua. The HR1 distribution for stars peaks at HR1 = 0. Most of the stars are found in the range –0.5 to +0.5. The histograms of the hardness ratio HR2 confirm the nature of ACO clusters as “hard” sources. The distribution for stars and AGN are softer and alike. In the distribution of HR2 versus HR1 ACO are dominating the upper right region; AGN are found mostly in the central part with HR1 –0.5 and –0.5 HR2 +0.5. Stars are occupying a slightly more extended region than AGN. The scatter plot of versus HR1 shows that the locus of stars is well separated from AGN and ACO clusters. Stars are primarily found in the lower portion of the plot. ACO clusters occupy only the upper right part of the figure. The first histogram in the lower panel of Fig. 14 displays the angular separation of RBSC positions from the optical positions. For stars and AGN most X-ray sources are found within 30 arcsec; the distribution for clusters of galaxies is much broader as one would expect from the X-ray source extent alone, which is shown in the next histogram. Abell et al. (1989) determined the cluster centers visually quoting typical standard deviations of 2’–3’ for the coordinates with the positional uncertainty depending on the compactness of the cluster. The optically determined centers do not necessarily follow the gas distribution and thus the gravitational potential well, which is the origin of the X-ray emission. Ebeling et al. (1993) found that the optical position of rich clusters had a mean deviation from the RASS position of 3’ for rich clusters, and 7’ for poor clusters. In some exceptional cases angular separations of up to 15’ were found. The last two scatter plots of Fig. 14 exhibit the extent likelihood and the count-rate versus extent. The populations of stars and AGN are well separated from those of ACO clusters.
Figure 15 gives the celestial distribution of RBSC sources which have no counterparts according to the catalogues listed in Table 3, when a search radius of 90 arcsec is used. It is obvious that certain regions of the sky have been intensively studied at other wavelengths (empty regions in Fig. 15). In addition by comparing Fig. 15 with Fig. 5, it is evident that almost all of the brightest RBSC sources have already been identified.
The list of possible identification candidates as generated from cross-correlating the RBSC sources with various catalogues is intended to assist in determining the nature of the X-ray sources. No attempt was made to remove duplicate entries from different source catalogues and in some cases contradictory identification candidates may be given. With the help of X-ray parameters, such as the hardness ratios, the source extent and the ratio, a decision can be made as to which entry is the plausible identification candidate (also see Motch et al. 1998 and Beuermann et al. 1999).
5 Electronic archive
All relevant information about access to the RBSC is available at http://wave.xray.mpe.mpg.de/rosat/catalogues/ rass-bsc. The full catalogues (RBSC and identification catalogue) and the descriptions of the catalogue contents can be retrieved as ASCII files via the WWW or via anonymous ftp. The RBSC presents the X-ray data. Subsets of the catalogue sources may be retrieved via the ROSAT Source Browser also available at the above mentioned address. An example of a search inquiry and its output are explained in Figs. 16 – 17. The identification catalogue (Fig. 18 and Tab. 4) consists of the results from cross-correlating the RBSC with the catalogues listed in Tab. 3. The main X-ray properties (such as name, position in equatorial and galactic coordinates, and fluxes) are given, as well as a designated number which represents the number of counterpart candidates found within a search radius of 300 arcsec. For each of the candidates an individual record is appended, containing the source position, angular separation from the X-ray position, different magnitudes (or fluxes in Radio or IR wavelength bands), redshift, spectral type and classification (if available). The catalogues are meant to be living databases, so that whenever improved X-ray or new ID data are available they will be included. Each data record contains a date stamp according to year, month and day in which this record was changed or newly included.
Acknowledgements.
We would like to thank the ROSAT team at MPE for their support and for stimulating discussions. We thank Damir Šimić for help in compiling the identification data and Ray Cruddace for the critical reading of the manuscript. The ROSAT Project is supported by the Bundesministerium für Bildung und Forschung (BMBF/DLR) and the Max-Planck-Gesellschaft (MPG). This work has made use of the SIMBAD database operated at CDS, Strasbourg, France. In addition this research also made use of the NASA/IPAC Extragalactic Database (NED), which is operated by the Jet Propulsion Laboratory, California Institute of Technology, under contract with NASA, and the COSMOS digitised optical survey of the southern sky, operated by the Royal Observatory Edinburgh and the Naval Research Laboratory, with support from NASA. We thank Richard MacMahon for making the APM catalogue availabe to MPE.
RBSC row:
| Col | abbreviation | description |
|---|---|---|
| 1 | SrcNam | the ROSAT All-Sky Survey Catalogue source name |
| 2 | R.A. | Right Ascension (2000) in decimal degrees |
| 3 | Dec. | Declination (2000) in decimal degrees |
| 4 | ?p | the total positional error (–radius) in arcsec, including 6” systematic error |
| 5 | # id | number of possible identification objects found within a search radius of 5 arcmin (= number of ID-rows following) |
| 6 | catalog-id | name of source catalogue (always 1RXS) |
| 7 | F | flag indicating the origin of the source position (always x: X-ray) |
| 8 | gal_Nh | galactic HI column density in units of |
| 9 | gal_long | galactic longitude lII in decimal degrees |
| 10 | gal_lat | galactic latitude bII in decimal degrees |
| 11 | hr1 | hardness ratio 1 (as explained in Sect. 2.2.3.) |
| 12 | ?hr1 | error of hardness ratio 1 |
| 13 | hr2 | hardness ratio 2 (as explained in Sect. 2.2.3.) |
| 14 | ?hr2 | error of hardness ratio 2 |
| 15 | ext | source extent in arcsec |
| 16 | exl | likelihood of source extent |
| 17 | srcl | likelihood of source detection defined as srcl = –ln P (P = probability that source is a spurious detection) |
| 18 | exp | exposure time in sec |
| 19 | src-cps | source count-rate (vignetting corrected) in the broad band in counts/sec |
| 20 | ?src-cps | error of source count-rate in the broad band in counts/sec |
| 21 | flux1 | X-ray flux 1 in the 0.1–2.4 keV energy range in (as explained in Sect. 3.3.5.) |
| 22 | flux2 | X-ray flux 2 in the 0.1–2.4 keV energy range in (as explained in Sect. 3.3.5.) |
| 23 | t_obs_beg | first date (yymmdd.dd) of observation (.dd is the fraction of the day) |
| 24 | t_obs_end | last date (yymmdd.dd) of observation (.dd is the fraction of the day) |
| 25 | orgdat | date (yymmdd) when the source was included |
| 26 | moddat | date (yymmdd) when the source properties were changed |
Identification row:
| Col | abbreviation | description |
|---|---|---|
| 1 | source-ID | the source name |
| 2 | R.A. | Right Ascension (2000) in decimal degrees |
| 3 | Dec. | Declination (2000) in decimal degrees |
| 4 | sep | the positional separation between RBSC source and ID object in arcsec |
| 5 | pa | the position angle (North to East) between RBSC source and ID object in degrees |
| 6 | catalog-id | name of source catalogue |
| 7 | F | flag indicating the origin of the source position (o: optical; x: X-ray; r: Radio; e: EUV; i: IR) |
| 8 | type | type or class of object |
| 9 | fxfopt | ratio of X-ray to optical flux |
| 10 | vmag | visual magnitude |
| 11 | bmag | blue magnitude |
| 12 | rmag | red magnitude |
| 13 | b-r | (blue–red) colour |
| hr1 | or hardness ratio 1 if entry is from ROSATP3 or ROSATWGA catalogue | |
| 14 | b-v | (blue–visual) colour |
| ?hr1 | or error of hardness ratio 1 if entry is from ROSATP3 or ROSATWGA catalogue | |
| 15 | u-b | (ultraviolet–blue) colour |
| hr2 | or hardness ratio 2 if entry is from ROSATP3 or ROSATWGA catalogue | |
| 16 | var | variability flag |
| ?hr2 | or error of hardness ratio 2 if entry is from ROSATP3 or ROSATWGA catalogue | |
| 17 | red-sh. | red-shift |
| ext, exl | or source extent in arcsec and likelihood of source extent if entry is from ROSATP3 catalogue | |
| 18 | dist | distance in kpc |
| snr | or signal-to-noise-ratio if FIRST entry | |
| srcl, exp | or likelihood (ROSATP3) or signal-to-noise-ratio (ROSATWGA/ROSHRI) of source detection and exposure in sec if entry is from ROSAT pointing catalogues | |
| 19 | IR-12mu | infrared flux in the 12 band if entry is from IRAS catalogues IRASFSC and IRASPSC |
| R-f6cm | or Radio flux in the 6cm band if entry is from VERONV8 catalogue | |
| Ned-flux | or Radio (IR) flux density in mJy in the frequency (wavelength in microns) band given in column 20 if entry is from NED | |
| 20 | IR-25mu | infrared flux in the 25 band if entry is from IRAS catalogues IRASFSC and IRASPSC |
| R-f11cm | or Radio flux in the 11cm band if entry is from VERONV8 catalogue | |
| fl-band | or frequency (wavelength in microns) band used for flux given in column 19 if entry is from NED | |
| src-cps | or source count-rate (vignetting corrected) in the broad band in counts/sec if entry is from ROSAT pointing catalogues | |
| 21 | IR-60mu | infrared flux in the 60 band if entry is from IRAS catalogues IRASFSC and IRASPSC |
| R-f20cm(I) | or Radio integrated flux density in mJy in the 20cm band if entry is from FIRST or NVSS catalogues | |
| ?src-cps | or error of source count-rate in the broad band in counts/sec if entry is from ROSAT pointing catalogues | |
| 22 | IR-100mu | infrared flux in the 100 band if entry is from IRAS catalogues IRASFSC and IRASPSC |
| R-f20cm(P) | or Radio peak flux density in mJy in the 20cm band if entry is from FIRST or NVSS catalogues | |
| size | or size of object in arcmin if entry is from NED | |
| roff | or off-axis angle in arcmin if entry is from ROSAT pointing catalogues | |
| 23 | comments | additional information concerning type or class of object |
| 24 | orgdat | date (yymmdd) when the source was included |
| 25 | moddat | date (yymmdd) when the source properties were changed |
References
- (1) Abell G.O., Corwin H.G., Olowin R.P., 1989 ApJS 70, 1
- (2) Alcala J.M., Krautter J., Schmitt J.H.M.M., et al., 1995, A&AS 114, 109
- (3) Alcala J.M., Terranegra L., Wichmann R., et al., 1996, A&AS 119, 7
- (4) Alcala J.M., Chavarria C., Terranegra L., 1998, A&A 330, 1017
- (5) Appenzeller I., Thiering I., Zickgraf F.-J., et al., 1998, ApJS 117, 319
- (6) Aschenbach B., 1988, Appl. Optics 27, 1404
- (7) Bade N., Engels D., Voges W., et al., 1998, A&AS 127, 145
- (8) Berghöfer T.W., Schmitt J.H.M.M., Cassinelli J.P., 1996, A&AS 118, 481
- (9) Böhringer H., Guzzo L., Collins C.A., et al., 1998, The Messenger 94, 21
- (10) Beuermann K., Thomas H.-C., Reinsch K., et al., 1999, A&A , accepted
- (11) Boller Th., Bertoldi F., Dennefeld M., Voges W., 1998, A&AS 129, 87
- (12) Bowyer S., Lampton M., Lewis J., et al., 1996, ApJS 102, 129
- (13) Buckley D.A.H., Sekiguchi K., Motch C., et al., 1995, MNRAS 275, 1028
- (14) Burwitz V., Reinsch K., Schwope A.D., et al., 1996a, A&A 305, 507
- (15) Burwitz V., Reinsch K., Beuermann K., Thomas H.-C., 1996b, A&A 310, L25
- (16) Condon J.J., Cotton W.D., Greisen E.W., et al,. 1998, AJ 115, 1693
- (17) Covino E., Alcala J.M., Allain S., et al., 1997, A&A 328, 187
- (18) Cruddace R.G., Hasinger G.R., Schmitt J.H.M.M., 1987, in: Astronomy from Large Databases, Murtaugh F., Heck A. (eds.), p.177
- (19) Danner R., 1998, A&AS 128, 331
- (20) De Grandi S., Molendi S., Böhringer H., Chincarini G., Voges W., 1997, ApJ 486, 738
- (21) Ebeling H., Voges W., Böhringer H., Edge A.C., 1993, A&A 275, 360
- (22) Fleming T.A., 1998, ApJ 504, 461
- (23) Fleming T.A., Molendi S., Maccacaro T., Wolter A., 1995, ApJS 99, 701
- (24) Fleming T.A., Snowden S.L., Pfeffermann E., Briel U., Greiner J., 1996, A&A 316, 147
- (25) Forman W., Jones C., Cominsky L., et al., 1978, ApJS 38, 357
- (26) Gregory P.C., Condon J.J., 1991, ApJS 75, 1011
- (27) Gregory P.C., Scott W.K., Douglas K., Condon J.J., 1996, ApJS 103, 427
- (28) Haberl F., Thorstensen J.R., Motch C., et al., 1994, A&A 291, 171
- (29) Haberl F., Motch C., 1995, A&A 297, L37
- (30) Hakala P.J., Watson M.G., Vilhu O., et al., 1993, MNRAS 263, 61
- (31) Harris D.E., Forman W, Gioa I.M., et al., 1994, SAO HEAD CD-ROM Series I (Einstein), Nos 18-36
- (32) Hasinger G., Trümper J., Schmidt M., 1991, A&A 246, 2
- (33) Helou G., Madore B.F.,Schmitz M., et al., 1995, in: Information and On-Line Data in Astronomy, Egret D. & Albrecht M.A. (eds.) (Dordrecht: Kluwer), p.95
- (34) Hoffleit D., Warren Jr W.H., 1991, Astronomical Data Center, NSSDC/ADC
- (35) Høg E., Kuzmin A., Bastian U., et al., 1998, A&A 335, L65
- (36) Hünsch M., Schmitt J.H.M.M., Voges W., 1998a, A&AS 127, 251
- (37) Hünsch M., Schmitt J.H.M.M., Voges W., 1998b, A&AS 132, 155
- (38) Hünsch M., Schmitt J.H.M.M., Sterzik, M.F., Voges W., 1999, A&AS 135, 319
- (39) IRAS Catalogs and Atlases Explanatory Supplement, 1988, Beichman C., Neugebauer G., Habing H.J., Clegg P.E., and Chester T.J. (eds.) (Washington, DC: GPO), NASA RP-1190
- (40) Kent B.J., Reading D.H., Swinyard B.M., Graper E.B., Spurett P.H., 1990, Proc. SPIE, 1344, 255
- (41) Kock A., 1998, PhD thesis, Universität Würzburg
- (42) Kock A., Meisenheimer K., Fürst E., et al., 1996, A&A 307, 745
- (43) Krautter J., Wichmann R., Schmitt J.H.M.M., et al., 1997, A&AS 123, 329
- (44) Kunkel M., 1997, PhD thesis, Universität Würzburg
- (45) Lasker B.M., Sturch C.R., McLean B.J., et al., 1990, AJ 99, 2019
- (46) Laurent-Muehleisen S.A., Kollgaard R.I., Ciardullo R., et al., 1998, ApJS 118, 127
- (47) Law-Green J.D.B., Leahy J.P., Alexander P., et al., 1995, MNRAS 274, 939
- (48) Levine A., Lang F., Lewin W., Primini F., Dobson C. 1984, ApJS 54, 581
- (49) Maccacaro T., Gioia I.M., Wolter A., et al., 1988, ApJ 326, 680
- (50) MacGillivray H.T., Stobie R.S.,1985, Vistas in Astronomy, vol 27, 433
- (51) Magazzu A., Martin E.L., Sterzik M.F., et al.,1997, A&AS 124, 449
- (52) Markert T., Winkler P., Laird F., et al., 1979, ApJS 39, 573
- (53) Mason K.O., Watson M.G., Ponman T.J., et al., 1992, MNRAS 258, 749
- (54) Mason K.O., Hassall B.J.M., Bromage G.E., et al., 1995, MNRAS 274, 1194
- (55) McHardy I., Lawrence A., Pye J., Pounds K., 1981, MNRAS 197, 893
- (56) McMahon R.G., Irwin M.J., 1992, in: Digitised Optical Sky Surveys, MacGillivray H.T. and Thomson E.B. (eds.), p.417
- (57) Metanomski A.D.F., Pasquini L., Krautter J., Cutispoto G., Fleming T.A. 1998, A&AS 131, 197
- (58) Moshir M., Copan G., Conrow T, et al., 1989, Infrared Processing and Analysis Center
- (59) Motch C., Guillout P., Haberl F., et al., 1997a, A&AS 122, 201
- (60) Motch C., Haberl F., Guillout P., et al., 1996, A&A 307, 459
- (61) Motch C., Haberl F., Dennerl K., Pakull M., Janot-Pacheco E., 1997b, A&A 323, 853
- (62) Motch C., Guillout P., Haberl F., et al., 1998, A&AS 132, 341
- (63) Nass P., Bade N., Kollgaard R. I., et al., 1996, A&A 309, 419
- (64) Neuhäuser R., Sterzik M.F., Schmitt J.H.M.M., Wichmann R., Krautter J., 1995, A&A 297, 391
- (65) Neuhäuser R., Torres G., Sterzik M.F., Randich S., 1997, A&A 325, 647
- (66) Nugent J., Jensen K., Nousek J., et al., 1983, ApJS 51, 1
- (67) Perlman E., Stocke J.T., Schachter J., et al. , 1996, ApJS 104, 251
- (68) Pfeffermann E., Briel U.G., Hippmann H., et al., 1988, Proc. SPIE, 733, 519
- (69) Pye J.P., McGale P.A., Allan D.J., et al., 1995, MNRAS 274, 1165
- (70) Ritter H., Kolb U., 1998, A&AS 129, 83
- (71) Romer A.K., Collins C.A., Böhringer H., et al., 1994, Nat 372, 75
- (72) Schmitt J.H.M.M., Fleming T.A., Giampapa M.S.,1995, ApJ 450, 392
- (73) Schmitt J.H.M.M., 1997, A&A 318, 215
- (74) Schwope A., Hasinger G., Lehmann I., et al., 1999, to be submitted
- (75) Snowden S.L., Freyberg M.J., Schmitt J.H.M.M., et al., 1995, ApJ 454, 643
- (76) Snowden S.L., Egger R., Freyberg M.J., et al., 1997, ApJ 485, 125
- (77) Stark A.A., Gammie C.F., Wilson R.W., et al., 1992, ApJS 79, 77
- (78) Staubert R., König M., Friedrich S., et al., 1994, A&A 288, 513
- (79) Stern R.A., Schmitt J.H.M.M., Kahabka P.T., 1995, ApJ 448, 683
- (80) Thomas H.-C., Beuermann K., Schwope A.D., Burwitz V., 1996, A&A 313, 833
- (81) Thomas H.-C., Beuermann K., Reinsch K., et al., 1998, A&A 335, 467
- (82) Trümper J., 1983, Adv. Space Res. 27, 1404
- (83) Trümper J., Hasinger G., Aschenbach B. et al. 1991, Nature, 349, 579
- (84) Veron-Cetty M.P., Veron P., 1998, ESO Scientific Report 18
- (85) Voges W., Aschenbach B., Boller Th., et al., 1996a, IAUC 6420
- (86) Voges W., Boller Th., Dennerl K., et al., 1996b, in: Proc. of the Conference Röntgenstrahlung from the Universe, MPE Report 263, p.637
- (87) Voges W., Boller Th., 1998, Astron. Nachr. 319, 3
- (88) Walter R, Fink H.H., A&A 274, 105, 1993
- (89) Warwick R., Marshall N., Fraser G., et al., 1981, MNRAS 197, 865
- (90) Wells A., Abbey A.F., Barstow M.A., et al., 1990, Proc. SPIE, 1344, 230
- (91) White N.E., Giommi P., Angelini L., 1994, IAUC 6100
- (92) White R.L., Becker R.H., Helfand D.J., Gregg M.D., 1997, ApJ 475, 479
- (93) Wichmann R., Krautter J., Schmitt J.H.M.M., et al., 1996, A&A 312, 439
- (94) Wichmann R., Sterzik M.F., Krautter J., Metanomski A., Voges W., 1997, A&A, 326, 211
- (95) Wiedenmann G., Scheingraber H., Voges W., 1997, in: Data Analysis in Astronomy, Di Gesu V., Duff M.J.B., Heck A., Maccacron M.C., Scarsi L., & Zimmermann H.U. (eds.), p.203
- (96) Wood K., Meekins J., Yentis D., et al., 1984, ApJS 56, 507
- (97) Xie G., Cha G., Bai J., et al., 1997, Acta Astron. Sin. 17, 323
- (98) Yentis D.J., Cruddace R.G., Gursky H., et al, 1992, in: Digitised Optical Sky Surveys, MacGillivray H.T. and Thomson E.B. (eds.), p.67
- (99) Zimmermann H.U., Becker W., Belloni T., et al., 1994, MPE Report 257